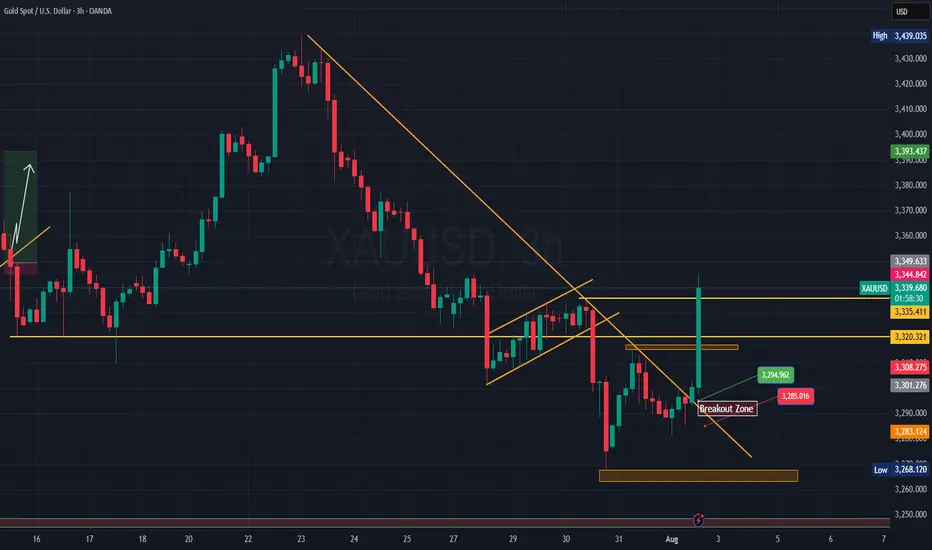
GOLD (XAUUSD): Important BreakoutsI've identified two significant breakouts on 📉GOLD.
The price violated a crucial intraday horizontal support and a major rising trend line.
These broken levels now form a contracting supply zone, suggesting that the price could continue to decline.
Target levels are 3314 and 3289.
GOLD trade ideas

XAUUSD SELL OFF CONTINUATION All my trade entry criterias met with the backing of the ADP Non-Farm Employment Change news release being positive for the USD, a SELL trade on GOLD

GOLD A Fall Expected! SELL!
My dear subscribers,
My technical analysis for GOLD is below:
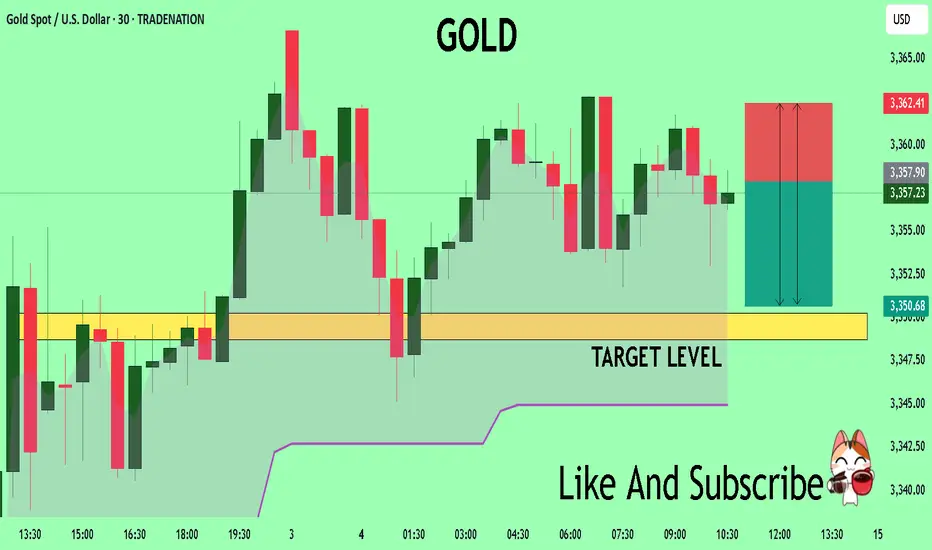
The price is coiling around a solid key level - 3358.0
Bias - Bearish
Technical Indicators: Pivot Points Low anticipates a potential price reversal.
Super trend shows a clear sell, giving a perfect indicators' convergence.
Goal - 3350.7
My Stop Loss - 3362.4
About Used Indicators:
By the very nature of the supertrend indicator, it offers firm support and resistance levels for traders to enter and exit trades. Additionally, it also provides signals for setting stop losses
Disclosure: I am part of Trade Nation's Influencer program and receive a monthly fee for using their TradingView charts in my analysis.
———————————
WISH YOU ALL LUCK
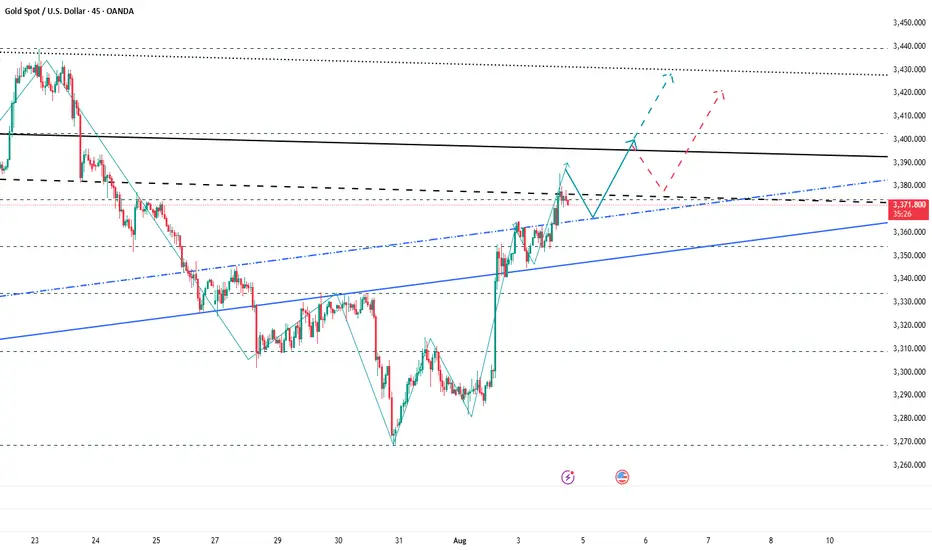
Next Stop 3420? Gold Bulls Push the LimitBecause the U.S. non-farm payroll report performed worse than expected, gold rebounded strongly last Friday and recovered half of its losses in one fell swoop. The bulls returned strongly. Today, after consolidating at a high level, gold continued to choose to break upward, reaching a high of around 3385.
There is no doubt that bullish forces still hold the upper hand. From a fundamental perspective, the Federal Reserve is currently facing greater pressure to cut interest rates; and it can also be clearly seen from the candlestick chart that a significant "W"-shaped double bottom structure has been constructed near 3268 and 3280, which has limited the gold's retracement space while also playing a key structural support role in the rise of gold. With the combined effects of news and technical factors, gold still has the potential to continue its upward trend. And I think there is still a great possibility that gold will test the 3400 mark again. Once gold stabilizes at 3400, it will definitely hit the 3420-3430 area.
As the center of gravity of gold gradually shifts upward, the lower support area also moves up. The current short-term support is obviously in the 3365-3355 area, while the relatively strong support is in the 3345-3335 area. According to the current pattern structure, the bulls may not allow gold to retreat to the 3345-3335 area. So in terms of short-term trading, we first consider the opportunity to enter long positions in the 3365-3355 area!
Bullish Trend with Clear Support & Resistance LevelsGold Price Action: Bullish Trend & Key Levels 🟡📈
This 30-minute chart provides a clear overview of the current price action for Gold (CFDs), with well-defined support and resistance levels. Let’s break down the key aspects of the chart and the possible trade opportunities. 💹
Key Observations:
📉 Support: The price has been bouncing off the lower boundary at $3,304.185, indicating a strong buying interest in this zone. A solid level to watch for bullish opportunities.
📈 Resistance: At $3,393.220, the price has faced difficulty breaking above, marking a critical sell zone if the price struggles to rise past it.
🔵 Trendline: The upward trendline highlights that price action is making higher lows, signaling a bullish trend overall.
Trade Opportunities:
🔼 Bullish Signal: If the price stays above the trendline and support zone, there’s a strong chance it will test the resistance around $3,393, presenting a potential buy opportunity.
🔽 Bearish Signal: A break below the support level could signal a possible downtrend, with sell opportunities towards the next support at $3,300 or lower.

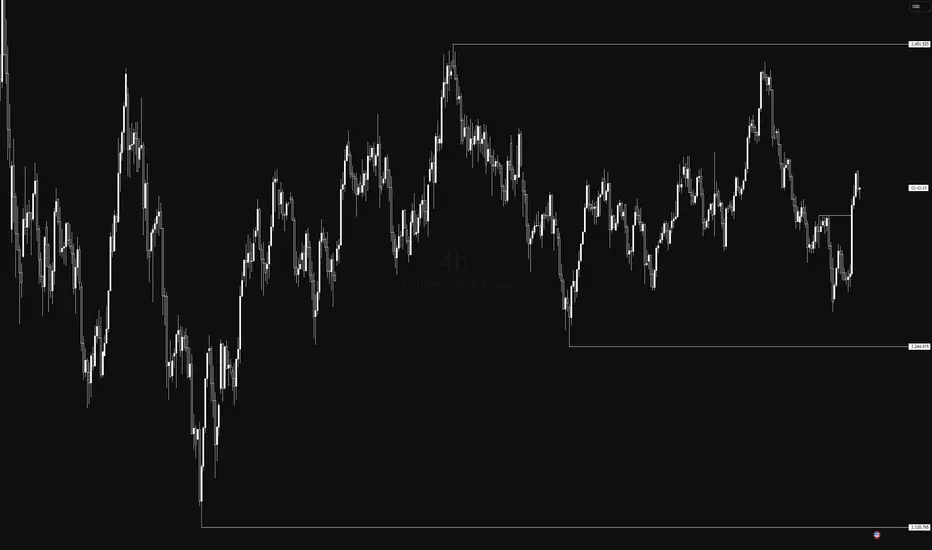
Bullish Break of Structure on 4H XAUUSD – Targeting 3451.525 Price broke structure to the upside on the 4H chart, showing bullish intent. I expect price to continue higher toward the 3451.525 level, which looks like a key liquidity area. As long as price holds above the break, the bias remains bullish.
GOLD: Strong Bullish Sentiment! Long!
My dear friends,
Today we will analyse GOLD together☺️
The recent price action suggests a shift in mid-term momentum. A break above the current local range around 3,296.556 will confirm the new direction upwards with the target being the next key level of 3,310.375 and a reconvened placement of a stop-loss beyond the range.
❤️Sending you lots of Love and Hugs❤️

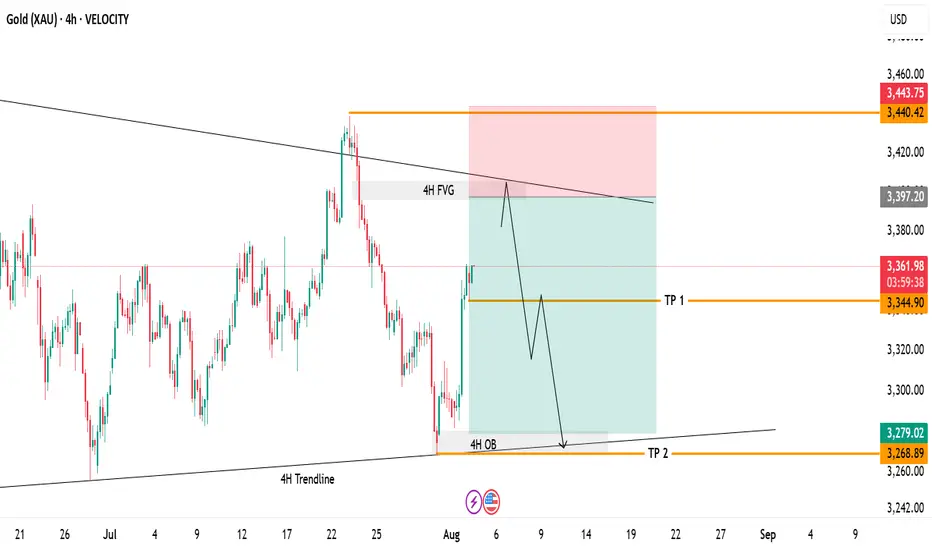
Gold 4H Swing Trade Setup!Currently watching price action as it approaches the 4H Fair Value Gap and descending trendline resistance. Price has not tapped this zone yet, and a move higher into this area could set up a potential reversal.
Setup Highlights:
4H FVG: 3,397–3,400 – Main area of interest.
Trendline Resistance: Confluence zone to watch for rejection.
Plan: Waiting for price to fill the imbalance and test the resistance before considering short entries.
Targets if Rejection Occurs:
TP1: 3,344 – First partial target.
TP2: 3,268 – 4H OB retest.
Invalidation:
A clear breakout and hold above 3,440 would invalidate the bearish scenario.
GOLD REMAINS UNDER PRESSURE AFTER U.S. INFLATION DATA📊 Market Overview:
Gold is trading around $3294, down from $3311 earlier after U.S. Core PCE and Employment Cost Index came in as expected — reinforcing the Fed's hawkish stance. A stronger dollar and rising Treasury yields continue to weigh on gold.
📉 Technical Analysis:
• Key resistance: $3302 – $3305
• Nearest support: $3285 – $3275
• EMA09 (H1): Price is below the 9-period EMA → short-term trend remains bearish
• Candlestick / volume / momentum: After the sharp drop, price is consolidating between $3293–$3298 with low volume. Failure to break above $3302 may trigger further downside. RSI near 45 suggests room for more selling.
📌 Outlook:
Gold may continue to decline in the short term if it fails to reclaim $3302 and the dollar remains strong through the Asian and European sessions.
💡 Suggested Trade Setup:
🔻 SELL XAU/USD: $3296 – $3298
🎯 TP: $3280 / $3275
❌ SL: $3305
🔺 BUY XAU/USD: $3275 – $3278 (if reversal candle appears)
🎯 TP: $3295
❌ SL: $3270

GOLD 4H – Potential Bullish Reversal After Falling Wedge BreakouPrevious Price Action,
There was a clear downtrend inside a descending channel
Price respected the channel with multiple touches on both upper and lower trendlines.
Eventually, there was a strong bullish breakout from the channel, signaling a potential trend reversal.
Bullish Breakout Confirmation,
After the breakout, the price made a sharp impulsive move up, followed by a minor consolidation.
Fibonacci retracement levels are drawn over the bullish leg possibly to identify pullback support zones.
Watch For.
A potential retest of the breakout zone or 50% Fib area.
Consolidation near current price (TP3) — might cause short-term resistance.
Price needs to hold above 3349 zone to maintain bullish structure.

Gold Trade Plan 29/07/2025Dear Traders,
it time to recover Gold after Deep Correction ,
i expect price will be continue upward movement
with Target 1 : 3339
Target 2 : 3351
Target 3 : 3370
Regards,
Alireza!

Gold’s Next Move: Bounce or Breakdown?Gold is pulling back after breaking the 3,360 USD resistance on the 6-hour chart. Price is currently testing the nearest fair value gap (3,370–3,380), but upside momentum is stalling, partly due to unfilled supply zones above.
A retest of the lower FVG near 3,340 will be key. Holding above this level could trigger renewed buying, while a break below may invalidate the bullish structure.
Traders should closely monitor whether downside gaps continue to fill and how price behaves near support zones. Lack of strong liquidity could lead to a false breakout.

GOLD Forming Bullish Pattern Read DescriptionGold is showing bullish momentum after a weaker-than-expected NFP report, which undermines the USD strength and increases demand for safe-haven assets like gold. With softer labor data, the market is now pricing in potential Fed rate cuts in the coming months, supporting upside pressure on gold.
Technical Analysis:
Price has respected the support zone and is now forming a bullish structure. If price holds above 3362, bullish momentum is expected to continue a Next targeting 3400 and 3419 – Strong resistance zone from recent highs
You May find more details in the chart.
Trade wisely best of luck Buddies.
Ps: Support with like and comments for better analysis.

We remain bullish on gold prices today—3400+.We remain bullish on gold prices today—3400+.
As shown in Figure 4h, gold prices are actively breaking through.
Currently, the upper resistance level for gold is 3385-3390.
Going long at low prices is a good strategy.
We exited yesterday at 3380 and entered today around 3350-3360, achieving very stable profits.
Current support level for gold: 3350-3360.
Gold prices have now resumed their upward trend, indicating that bullish sentiment has returned to the primary upward trend.
Bullish sentiment will continue to strengthen.
Our target price for gold remains above 3400.
Day Trading Strategy:
1: Swing Strategy: 3350-3385 (Buy Low, Sell High)
2: Low-Price Long Strategy
Buy: 3350-3360-3370
Stop Loss: 3345
Target: 3380-3400
3: High-Price Short Strategy: (Caution is advised when trading short positions; avoid short positions)

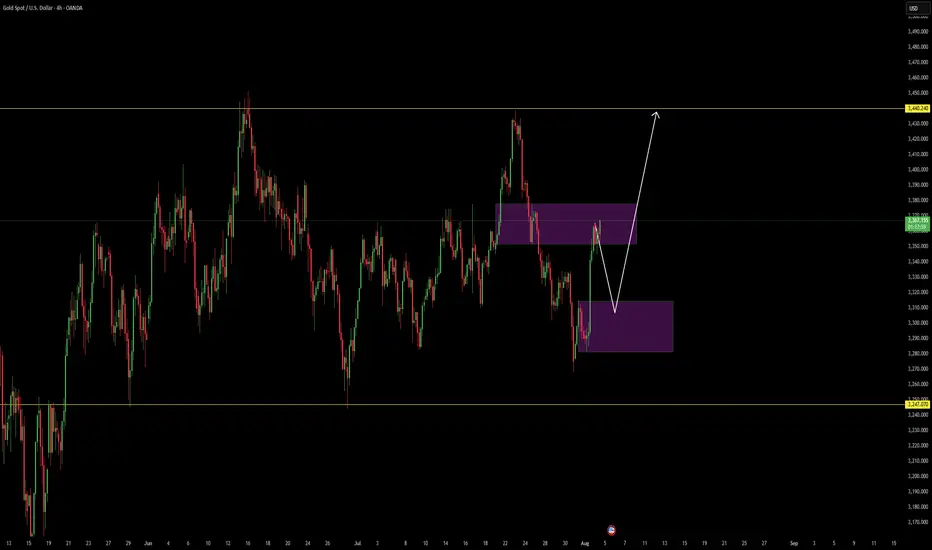
Volume. supportAlthough gold has made a downward segment overlap and the priority should be on a decline, due to Trump's trade wars and geopolitical tensions, I believe that after a pullback to the buyer zone of 3280–3315, gold will continue to rise.

Big money coming? Here, NFP data XAUUSD Technical Analysis PredDXY forecast today
XAU USD forecast today
EURUSD forecast today
NFP Data Forecast: Xauusd buys SELV sales for mass profit! Your latest gold trade guide confidently during the production of this most important wages is not related to the farm. In this video you will receive technical analysis from XaUUSD experts and proven adjustments for XaUUSD sales. It breaks down how you interpret forecasts for NFP data, how it affects gold prices, and where the best opportunities are. Whether you're a day trader or swing, this video gives you real information to plan your trade and plan your risk management as an expert. Don't miss this opportunity to turn your data into profits ahead of the market. Now look, trade more intelligently and go ahead with the crowd!
#NFPDATAFORECAST
#xauusd
#GoldTrading
#technicalalyasis
#forexsignals
#GoldPrice
#daytrading
#swingtrading
Bullish Breakout to $4,060 TargetOn the daily chart, XAUUSD is forming a Symmetrical Triangle with a bullish breakout potential.
📍 Buy zone: Around $3,200 (strong support and point D of the pattern)
📍 Target: $4,060 based on breakout projection.
Quick Analysis:
Pattern: Symmetrical Triangle + ABCD Harmonic
Buy near strong support at $3,200
Big upside potential after breakout
Good risk/reward for medium to long-term trades

LIVE BTC/USD, XAUUSD TRADING, 02/08/2025 SIGNALS PRICE ACTION TRLive BTC/USD, XAUUSD TRADING, 02/08/2025 signal price action trading strategy

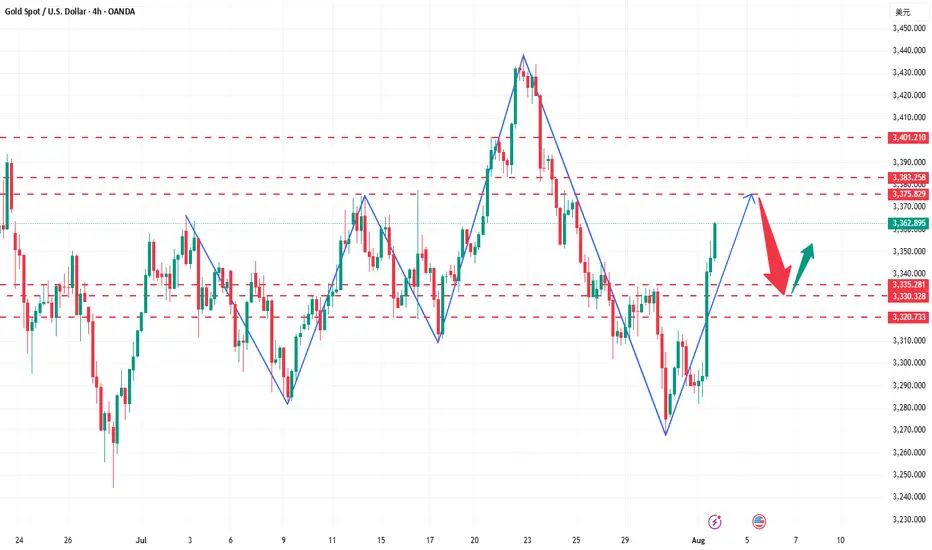
GOLD: Bottoming Out or Just the Calm Before the Storm? – GOLD: Bottoming Out or Just the Calm Before the Storm?
Gold has dropped nearly $50 over the last 4 sessions, showing clear bearish momentum. But is this just a liquidity grab before a reversal — or are we simply pausing before another leg down?
🔍 Market Context:
Recent US–EU defence and trade agreements may have weakened gold’s short-term appeal as a safe haven.
The US dollar and equities have both gained on strong macroeconomic data, redirecting capital flows away from metals.
Overall market sentiment has tilted risk-on, putting additional pressure on gold prices.
📊 Technical Overview (12H Chart):
Price has broken below the 3342 key support zone and rejected the retest — turning it into short-term resistance.
Current range sits between:
Sell-side liquidity zone: 3301–3292
Major demand/FVG zone: 3272–3270
Above price:
Resistance at 3342, and a broader sell zone at 3370–3388 (OB + FVG + Fib 0.5–0.618)
🔧 Trade Plan (Reaction-Based — Not Predictive):
🟢 Scenario 1 – Buy (Scalp Reaction)
Entry: 3292 – 3290
Stop Loss: 3285
Targets: 3296 → 3300 → 3305 → 3310 → 3315 → 3320 → 3325 → 3330
📍 Intraday bounce play from a high-liquidity zone
🟢 Scenario 2 – Buy (Deeper Reversal Swing)
Entry: 3272 – 3270
Stop Loss: 3265
Targets: 3276 → 3280 → 3284 → 3288 → 3292 → 3294 → 3300 → Trail
📍 Potential mid-term bottom setup if liquidity is fully swept
🔴 Scenario 3 – Sell (Short-Term Rejection)
Entry: 3340 – 3342
Stop Loss: 3346
Targets: 3335 → 3330 → 3325 → 3320 → 3310
📍 Clean rejection setup if price fails to reclaim key resistance
🔴 Scenario 4 – Sell (Higher Supply Zone)
Entry: 3370 – 3372
Stop Loss: 3376
Targets: 3365 → 3360 → 3355 → 3350 → 3345 → 3340 → 3330 → 3320
⚠️ Higher risk; only valid with strong confirmation
⚠️ Risk Notes:
Be mindful of fakeouts around London and NY opens, as liquidity sweeps are common.
Wait for price to enter your zone, then react — don’t anticipate.
Strict risk management is key in a volatile environment like this.
🧭 I’ll continue monitoring how price reacts around these zones.
If this kind of structured planning resonates with your approach,
feel free to stay connected — or share your perspective in the comments.

The trend is clear, why do I choose to be firmly bullish on goldGold Trend Analysis: Yesterday, the gold market demonstrated strong upward momentum, opening near 3290 before falling slightly to a low of 3281 before fluctuating upward. Boosted by the non-farm payroll data, the gold market surged during the US trading session, reaching a single-day gain of 2.02%, reaching a high of 3363 and closing there. The daily chart formed a long bullish candlestick with a long lower shadow, forming a Morning Star pattern, reinforcing the bullish trend. From the perspective of the cycle structure, the daily level is clearly in the 5-wave upward stage, and the upward trend of the large cycle has not changed. At the indicator level, the daily MACD momentum column (the column below the zero axis) represents the short-selling momentum. Its "gradual shortening" means that the short-selling force is weakening and the downward momentum is gradually fading. It is a potential signal of stopping the decline or rebounding. KDJ is about to form a golden cross between 20-50, which is a signal that short-term bullish power is beginning to increase, and the overall trend is bullish.
The 4-hour level shows typical bullish characteristics: the moving average system is arranged in a bullish pattern, but there is a certain deviation between the short-term price and the moving average. The technical side needs to correct the deviation rate through a callback before continuing to rise. The short-term support below is focused on the line near 3330-3335. This position is both the relay support level in the previous rise and the intersection of the 4-hour moving averages MA10 and MA20, which has strong support strength; the short-term resistance above is focused on the line near 3370-3383. This area is a pressure-intensive area near the previous high point. If it can be effectively broken through, it will further open up upward space. A successful breakout would open up further upside potential. A breakout would further open up the 3400 mark.
For gold trading, the short-term strategy is to buy on dips. If the price pulls back to the 3330-3335 support level, consider entering a long position with a target of 3355-3365. If it reaches 3370-3380, consider a short-term short position with a target of 3350-3340.
Gold 30Min Engaged ( Bullish After Break Out Entry Detected )———
Time Frame: 30-Minute Warfare
Entry Protocol: Only after volume-verified breakout
🩸Bullish Break - 3339
➗ Hanzo Protocol: Volume-Tiered Entry Authority
➕ Zone Activated: Dynamic market pressure detected.
The level isn’t just price — it’s a memory of where they moved size.
Volume is rising beneath the surface — not noise, but preparation.
🔥 Tactical Note:
We wait for the energy signature — when volume betrays intention.
The trap gets set. The weak follow. We execute.
Gold you now totaly buy trend for next 3 to 5 days Gold you now totaly buy trend for next 3 to 5 days
If you want learn more fell free contrect me .
