XAUUSD (GOLD): Bullish Impulsive Move Up Friday! Wait For Buys!In this Weekly Market Forecast, we will analyze the Gold (XAUUSD) for the week of Aug 4 - 8th.
Gold is bullish on the Monthly, Neutral on the Weekly, Bullish on the Daily.
The aggressive move higher after bad job numbers caused a shift in the market from bearish to bullish on the D1 time frame.
Be wary of the pullback, as that move is likely to be corrected, but that would set up a great long opportunity!
Enjoy!
May profits be upon you.
Leave any questions or comments in the comment section.
I appreciate any feedback from my viewers!
Like and/or subscribe if you want more accurate analysis.
Thank you so much!
Disclaimer:
I do not provide personal investment advice and I am not a qualified licensed investment advisor.
All information found here, including any ideas, opinions, views, predictions, forecasts, commentaries, suggestions, expressed or implied herein, are for informational, entertainment or educational purposes only and should not be construed as personal investment advice. While the information provided is believed to be accurate, it may include errors or inaccuracies.
I will not and cannot be held liable for any actions you take as a result of anything you read here.
Conduct your own due diligence, or consult a licensed financial advisor or broker before making any and all investment decisions. Any investments, trades, speculations, or decisions made on the basis of any information found on this channel, expressed or implied herein, are committed at your own risk, financial or otherwise.
GOLDCFD trade ideas

GOLD REVERSALHello folks, most traders stop out on this idea right? lets get back to previous month opening price, for short idea stoploss above. 3440.
But If you can wait for LONG below. maybe in the next 2 days.
Goodluck. I prefer LONG? I will update once I see volumes on downtrend today or the next day.
I only see short today. the volume is declining/exhausted. I predict reversal atm.
ciao.. see the chart above.
this is not a financial advice.
trade it like its your own business.

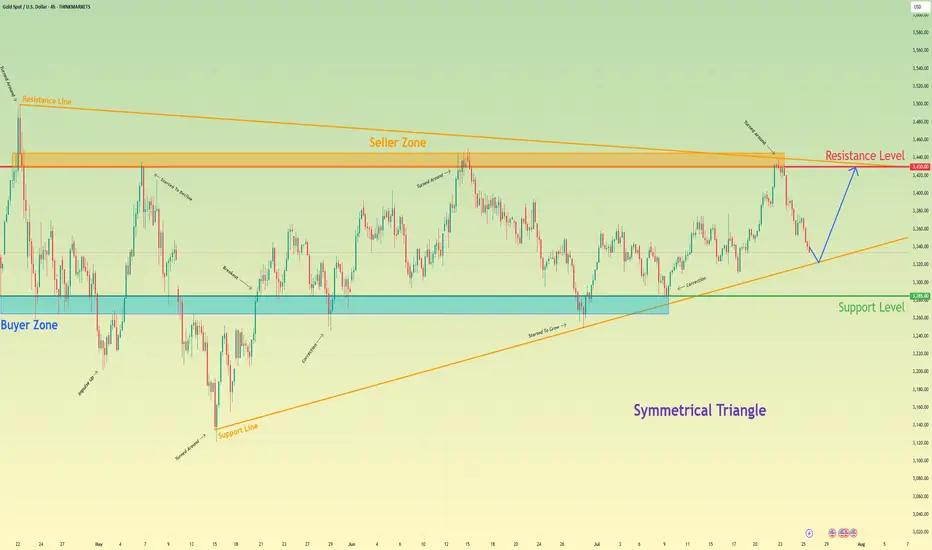
Gold will rebound from support line of triangle and rise to 3430Hello traders, I want share with you my opinion about Gold. Following a sequence of significant upward trends and the subsequent downward corrections that defined its range, gold has entered a broad market zone of consolidation. This battleground is clearly anchored by the historically significant buyer zone around 3285 and a formidable seller zone near 3430. Currently, the asset's price action is coiling and contracting within the confines of a large symmetrical triangle, a classic pattern that signifies a period of equilibrium and energy build-up before a potential high-volatility breakout. After a recent upward rebound was decisively rejected by the upper resistance line, the price is now in a corrective descent, heading towards the crucial ascending support line of the triangle. The primary working hypothesis is a long scenario, which is based on the expectation that this downward move will find strong buying interest on this key trendline, respecting the pattern's integrity. A confirmed and strong bounce from this level would signal another complete upward rotation within the triangle is underway. Therefore, the tp is logically and strategically set at the 3430 resistance level, as it not only aligns with the formation's upper boundary but also represents the major seller zone, a natural magnet for price on such a rebound. Please share this idea with your friends and click Boost 🚀
Disclaimer: As part of ThinkMarkets’ Influencer Program, I am sponsored to share and publish their charts in my analysis.
Gold Breakout Failed – Bearish Reversal in Play?Last week was both interesting and revealing for Gold.
After breaking above the key $3375 resistance—which also marked the upper boundary of a large triangle—price quickly accelerated higher, reaching the $3440 resistance zone.
However, instead of a bullish continuation, we witnessed a false breakout and sharp reversal. What initially looked like a healthy pullback turned into a full bearish rejection by week’s end.
________________________________________
📉 Current Technical Picture:
• On the daily chart, we now see a clear Three Black Crows formation
• On the weekly chart, a strong bearish Pin Bar confirms rejection
• And if we add the failed breakout above 3375, the bias tilts decisively bearish
________________________________________
📌 Key Zones and Trading Plan:
• Gold is currently bouncing from the ascending trendline zone, which is natural after dropping more than 1,000 pips in just 3 days
• The $3375–3380 area has regained importance as a key resistance zone, and that’s where I’ll be looking to sell rallies
• A bullish invalidation would only come if price manages to stabilize above $3400
Until then, this remains a bear-dominated market, and a drop below $3300 is on the table.
________________________________________
🧭 Support levels to watch:
• First support: $3280
• Major support: $3250 zone
________________________________________
📉 Conclusion:
The failed breakout, bearish candle formations, and current price structure all point to a market that's shifting in favor of sellers.
I’m looking to sell spikes into resistance, with a clear invalidation above $3400.
Disclosure: I am part of TradeNation's Influencer program and receive a monthly fee for using their TradingView charts in my analyses and educational articles.

GOLD Slips as Dollar Gains on Trade Deal – Bearish Below 3349
Gold Pares Gains as USD Strengthens on Trade Deal Ahead of Fed
Gold gave up early gains, pressured by a stronger U.S. dollar after the announcement of the US–EU trade agreement.
Meanwhile, attention shifts to upcoming U.S.–China negotiations later today, as both sides aim to extend the current trade truce and avoid new tariffs.
Investors are also closely watching the Federal Reserve’s policy decision on Wednesday, seeking signals on future interest rate moves.
TECHNICAL OUTLOOK:
Gold maintains a bearish trend while trading below 3349, with potential downside toward 3320.
A 1H candle close below 3320 – 3312 would confirm extended bearish pressure targeting 3285, driven in part by ongoing geopolitical risks.
⚠️ To shift back to a bullish structure, the price must stabilize above 3349.
Key Levels:
• Support: 3320 – 3285 – 3256
• Resistance: 3365 – 3375

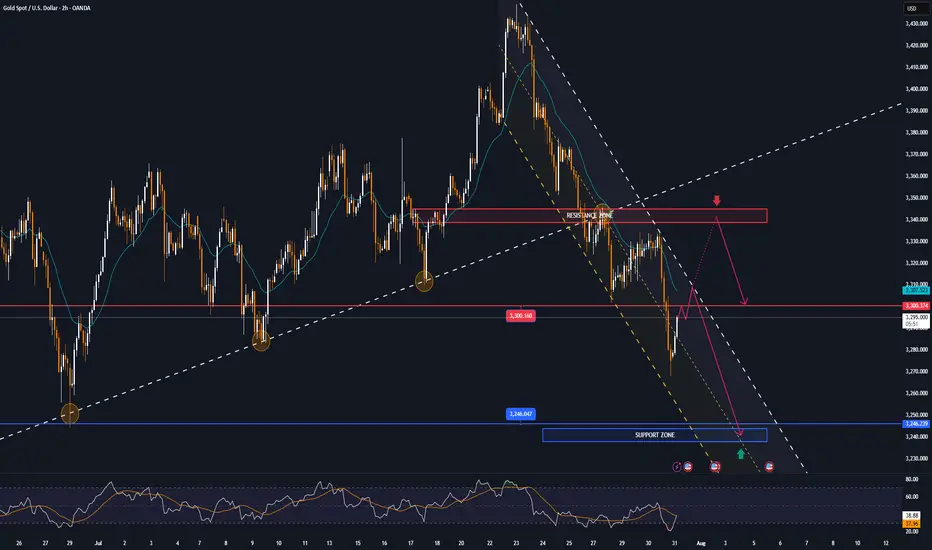
GOLD falls sharply, fundamental analysis and technical positionOANDA:XAUUSD fell sharply below the $3,300/oz price level as Chairman Jerome Powell did not signal any rate cuts at his next press conference on September 16-17. He only said that “no decision has been made on September” and that “more data will be evaluated in the coming months.” Economic data undermined the case for a rate cut, while geopolitical play remained a potential support.
The Fed and Interest Rates
The Federal Reserve kept interest rates unchanged for a fifth straight meeting on Wednesday, defying persistent pressure from President Donald Trump and White House officials.
However, two members of the central bank's board dissented, a rare move in three decades that underscored growing divisions within the central bank over the impact of Trump's tariff policies.
At the meeting, the Fed kept its benchmark federal funds rate in a range of 4.25% to 4.5%, in line with policy through 2025. Last fall, the Fed cut rates by a total of 100 basis points.
However, Federal Reserve Board Governors Christopher Waller and Michelle Bowman opposed cutting interest rates by another 25 basis points, marking the first time since Alan Greenspan in 1993 that two board members have opposed a majority resolution at a meeting.
At the press conference, Chairman Jerome Powell did not signal a rate cut at the next interest rate meeting on September 16-17, saying only that “no decision has been made about September” and that “more data will be evaluated in the coming months.” Powell also noted that despite Trump’s call for a sharp 3% rate cut to reduce interest costs on US debt and stimulate the housing market, the Fed will continue to monitor the longer-term impact of tariffs on the path of inflation and economic recovery.
Market expectations for a Fed rate cut in September fell to 47% in Powell's speech.
Economic data
ADP jobs data beats expectations and is bearish
US ADP payrolls jumped 104,000 in July, beating market expectations of 75,000 and marking the biggest gain since March. The data showed continued strength in the labor market, reinforcing the Federal Reserve’s stance on keeping interest rates high. Meanwhile, the preliminary estimate of annual GDP growth in the second quarter came in at 3% (2.4% expected), and the core personal consumption expenditures price index rose 2.5% year-on-year (2.3% expected), indicating both economic resilience and inflation stability, further weakening expectations for a rate cut.
Keep an eye on the ISM manufacturing PMI and non-farm payrolls data on August 1. If the jobs numbers continue to be strong, this could reinforce the Fed’s dovish stance.
Geopolitical and Policy Plays
News of a 90-day extension of the US-China tariff deal has eased some safe-haven demand, but Trump’s August 8 deadline for a new Russia-Ukraine deal, coupled with tensions in the Middle East, continue to provide potential support for gold.
Continued purchases by central banks (such as China and India) are a positive signal in the medium to long term, but are unlikely to offset short-term pressure from the Federal Reserve’s policies.
Technical outlook for OANDA:XAUUSD
On the daily chart, gold has been sold below the $3,300 level and now the $3,300 level has become the nearest resistance at present. For now, gold will be limited by the area of the 0.382% Fibonacci retracement with the original price point of $3,300, along with that it has formed a short-term downtrend with the price channel, the next target will be around $3,246 in the short term followed by the Fibonacci retracement level noted with readers in previous publications.
On the momentum front, the Relative Strength Index is operating below 50 and is far from the oversold zone (20-0), indicating that there is still plenty of room for downside ahead.
In addition, the gold trend will also be pressured by the EMA21, as long as gold remains below the EMA21, the current technical conditions continue to favor the downside.
For the day, the technical outlook for gold is bearish with notable positions listed as follows.
Support: 3,246 – 3,228 USD
Resistance: 3,300 USD
SELL XAUUSD PRICE 3345 - 3343⚡️
↠↠ Stop Loss 3349
→Take Profit 1 3337
↨
→Take Profit 2 3331
BUY XAUUSD PRICE 3240 - 3242⚡️
↠↠ Stop Loss 3236
→Take Profit 1 3248
↨
→Take Profit 2 3254
xauusd buybuy xauusd
XAUUSD
idea order block active with high volume here
and it back to test it
OANDA:XAUUSD

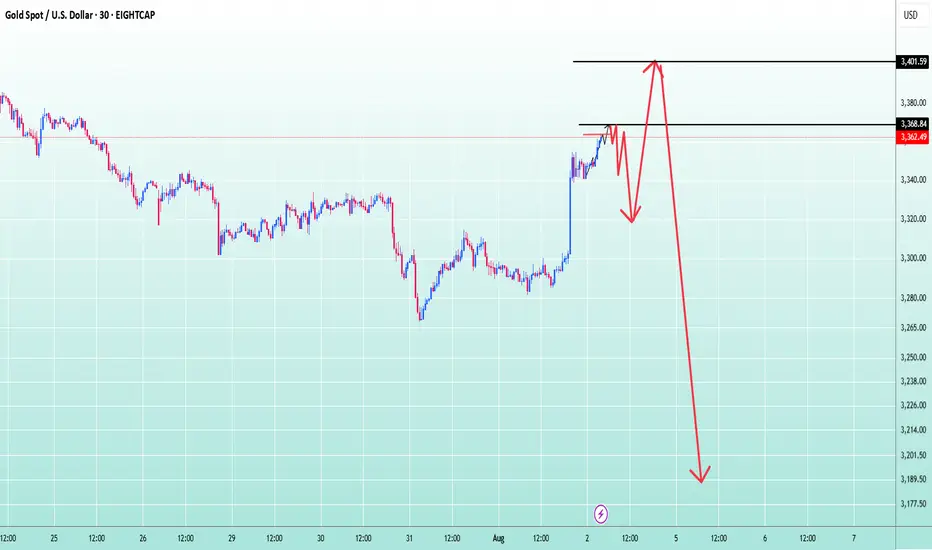
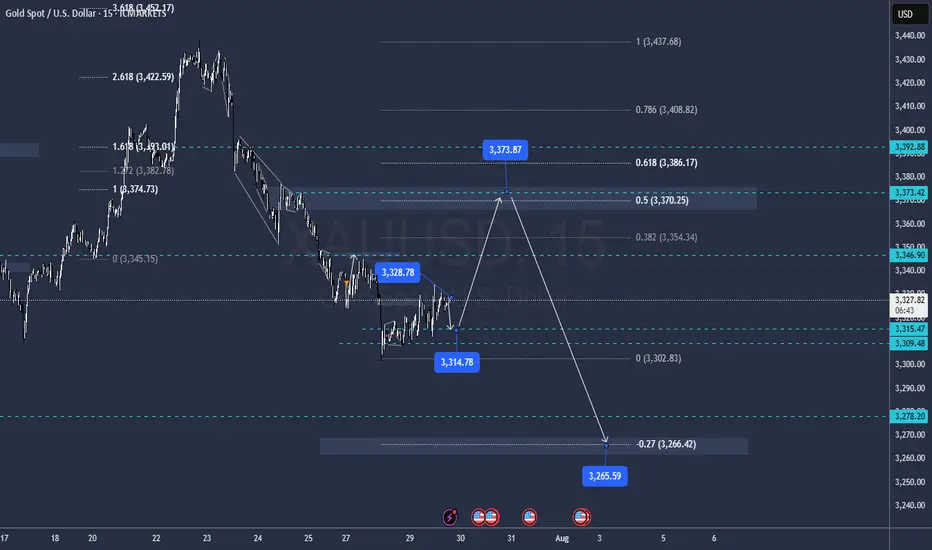
Gold trend analysis!From the price level of 3368 and above, gold is expected to pull back at least until the Stochastic on the M30–H1 timeframes reaches oversold levels.
After that, a bullish continuation is likely, pushing the price up to around 3400.
This area will be a critical decision point — determining whether the market will continue its uptrend or reverse into a downtrend.
If the H4 chart prints a reversal candlestick pattern, it would indicate the beginning of a bearish trend, which could potentially lead to a downward movement of up to 20,000 points.
GOLD Is ready for a short fallGold is approaching an interesting level and i expect the fall begins soon to beloe marked demand zone
GOLD this snicky GuyTruth be told, im not a big fan of this scenario, its going up mssy but it still looking Bulish, i I have to make a call I will be tking the sell from 3370 and yeah mayb the buy with really, really small risk, but its is up to you
Levels labeled in the chart
GG
Short idea!Hello all. market needs a new lower low and it reversed from no where. the loz is the best Option here. be happy(wink)

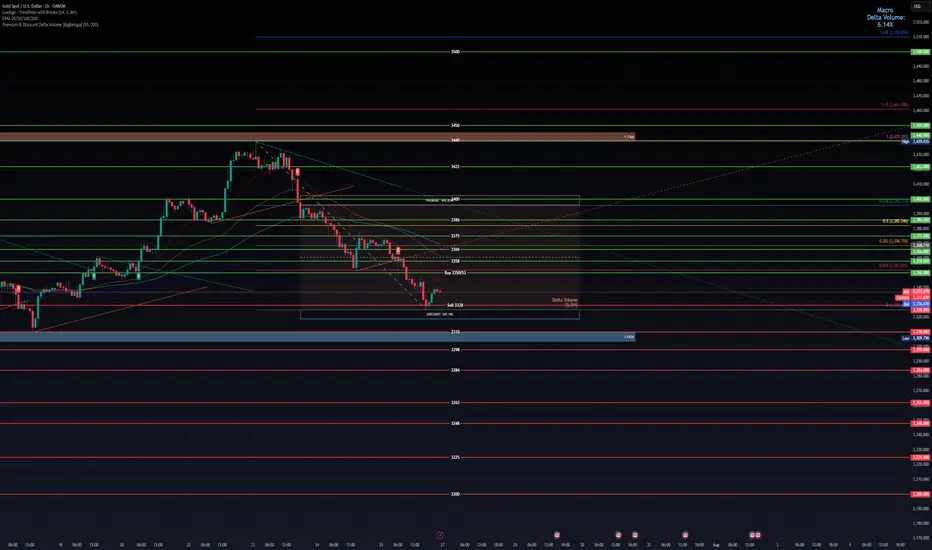
Gold weekly chart with both buy and sell entriesAnalysis of the Buy Entry: 2350/52
This level has been chosen as a potential long entry point due to a confluence of several technical factors.
Smart Money Concepts (SMC) - Discount Zone: The chart has a "Premium - Discount" range drawn over the recent downward price leg. The equilibrium (EQ) level is marked in the middle. According to SMC principles, traders look to buy assets at a "discount" (below the 50% EQ level) and sell at a "premium" (above the EQ level). Your buy entry at 2350/52 is located deep within the discount zone, making it an attractive price from this perspective.
Key Horizontal Support Level: The 2350 price is a significant psychological and technical level. Looking to the left of the chart, this area has previously acted as both support and resistance. By placing a buy order here, you are anticipating that this historical support level will hold again and cause price to bounce.
Potential Mean Reversion: At the point of entry, the price is significantly extended below the moving averages (the thin red, orange, and green lines). This can sometimes indicate an "oversold" condition in the short term, increasing the probability of a corrective bounce back up towards the moving averages (the "mean").
In summary, the buy entry is a calculated risk, betting on a bounce from a confluence of a deep discount price, a strong historical support level, and an oversold condition.
Analysis of the Sell Level: 2328
This level is critically important and likely serves two potential purposes: as a stop-loss for the buy trade, or as a trigger for a new short (sell) position.
Breakdown of Major Support: The chart highlights a significant support zone (the thick blue/grey box) roughly between 2330 and 2334. Your sell level at 2328 is placed just below this entire support structure and also below the most recent swing low. A price break below 2328 would signify a failure of this support, confirming that sellers are still in firm control.
Confirmation of Bearish Trend Continuation: In a downtrend, the price makes a series of lower highs and lower lows. A move down to 2328 would create a new lower low, reinforcing the bearish market structure and suggesting that the price is likely to continue much lower. This makes it an ideal place to exit a long position (cut losses) or to initiate a new short position to follow the dominant trend.
Order Flow and Volume Clues:
The note "Delta Volume?" next to this level suggests you are looking for confirmation from order flow data. A strong negative delta (more aggressive sellers than buyers) as the price breaks 2328 would provide strong confirmation for a short trade.
The label "LVN 2334.86" indicates a Low-Volume Node from a volume profile analysis. Price tends to move very quickly through these areas of low liquidity. By placing the sell level below the LVN and the support zone, you are anticipating an acceleration or a "flush" downwards once these key levels are breached.
In summary, the 2328 level is the invalidation point for the bullish "bounce" idea. If the price reaches this level, the reasons for buying are no longer valid, and the evidence strongly points towards a continuation of the downtrend.
Overall Strategy
The plan is to:
Enter a counter-trend long at 2350/52, anticipating a bounce from a strong support and discount zone.
Define risk by placing a stop-loss just below the key support structure at 2328.
Potentially use the 2328 level as a trigger to close the long and open a new short position to trade with the dominant bearish trend if the support level fails.
Gold-Buy ScenarioChange of structure, ABC retracement formation, Inverse Heed and shoulders formation and bullish flag formation

XAUUSD H4 Update – The Battle Has Moved to 3350
“From deep demand to key supply. The next move is decisive.”
🔸 Sunday Plan Recap
Price was falling aggressively into the HTF demand zone (3265–3240).
The plan anticipated a bounce only if that deep zone held.
Above price, major zones included:
3314 – mid-structure
3330–3345 – supply zone
3368–3380 – final retracement targets
🔸 What Changed?
✅ The deep demand zone worked — H4 CHoCH bullish was confirmed.
✅ Price climbed through 3285 and 3314, confirming a retracement leg.
🔥 Now, price sits at 3349.57, testing the same supply zone marked in Sunday’s plan (3330–3345).
🔸 Current H4 Structure
🔼 Short-term bias = bullish retracement
📍 Price = inside HTF premium zone
📈 EMAs aligned bullish (5/21/50), confirming short-term momentum
💡 RSI = approaching overbought
⚔️ Liquidity above 3355, trapped shorts below 3314
🧠 Today’s Battle Plan (August 1)
🔴 Sell Zone (live) – 3345 to 3355
Price just entered the key H4 supply zone. Watch for rejection signs:
Bearish confirmation needed (e.g. M15/M30 CHoCH or engulfing)
If confirmed → downside targets: 3314 → 3285 → 3265
High RR short only if structure confirms
🔵 Breakout Bullish Case
If 3355 breaks with a clean body + HL at 3340 → bullish continuation active
Next upside target: 3368 → 3380
🧭 Final Thoughts
We’ve reached the exact decision zone from Sunday’s plan.
The market will now reveal: retracement over... or breakout coming?
Patience is key — this is a high RR zone, but only if structure reacts.
💬 Did you catch the move from deep demand? Or waiting for confirmation here at supply?
📈 Share your thoughts in the comments and let’s break it down together.
🔔 Follow for real-time market insights, sniper plans, and structured trading logic you can trust.
❤️ Like if you enjoy clean, actionable updates🚀🚀🚀
🔁 Share with traders who love structure over noise
📉 Price data from Trade Nation feed

GOLD BUY TRADE IDEA🟡 XAU/USD Smart Money Setup – July 31, 2025
🔍 Key Technical Highlights:
• Demand Zone Entry:
• Price has tapped into a clear demand zone (gray box) around 3,274 – 3,290, signaling potential institutional accumulation.
• The previous inducement low has been swept, aligning with Smart Money Concepts (SMC).
• Liquidity Engineering:
• Equal highs (liquidity pool) visible from late June remain uncollected — a prime upside target.
• Price structure shows internal BOS, suggesting a shift in market sentiment.
• Expected Path:
• A potential multi-leg bullish move is mapped out, targeting the 3,440+ premium zone, completing imbalance fill and stop-run above highs.
• Risk-Reward:
• Stop loss sits just below the demand zone (~3,274), maintaining a favorable risk-to-reward ratio.
⸻
🧠 Smart Money Flow Narrative:
1. Sweep of inducement lows triggers institutional entries.
2. Demand zone holds with bullish reaction — confirmation of intent.
3. Expect higher highs and a rally toward uncollected liquidity above 3,440.
4. Low-risk buy opportunity for both swing and intraday traders.

SELL THE RALLIES ON GOLD 🟡 Gold Daily Time Frame Analysis
🔍 Market Structure Overview
Gold has been consolidating in a broad range near its all-time highs, indicating a bullish exhaustion. This prolonged sideways movement is characteristic of a distribution phase, often preceding a potential trend reversal.
The current price action lacks strong directional momentum, as buyers appear exhausted near record highs.
The distribution pattern implies that institutions may be preparing to offload long positions and potentially build short positions for a future bearish move.
---
🟥 Red Rectangle – Resistance Zone (Potential Distribution Area)
Price has repeatedly tested this zone without a successful breakout.
This zone likely contains heavy sell-side liquidity and institutional supply.
Key Resistance Levels within this zone:
$3,400
$3,425
$3,480
This repeated failure to break higher reinforces the possibility of a trend reversal from this area.
---
🟦 Blue Rectangle – Minor Support (Liquidity Engineered Zone)
Gold is reacting to this minor support zone, showing temporary buying interest.
This may indicate that institutions are building liquidity, luring in buyers to drive price back toward the red zone.
Once sufficient liquidity is accumulated, smart money may offload remaining long positions into resistance, and initiate a bearish trend.
Key Support Levels:
$3,300 – immediate minor support
$3,200
$3,100
$3,000 – major psychological and technical support
---
📈 Institutional Price Behavior
This price behavior aligns with Wyckoff Distribution Theory, where:
Price consolidates near the top
Demand weakens
Institutions offload to late buyers
Downtrend begins after liquidity sweep or Upthrust (UTAD)
---
🧠 Conclusion
Gold’s ranging structure near ATH suggests we may be in a distribution phase. The reaction to the minor support implies a liquidity-building move to draw price back to resistance before a potential markdown phase (bearish trend) begins.

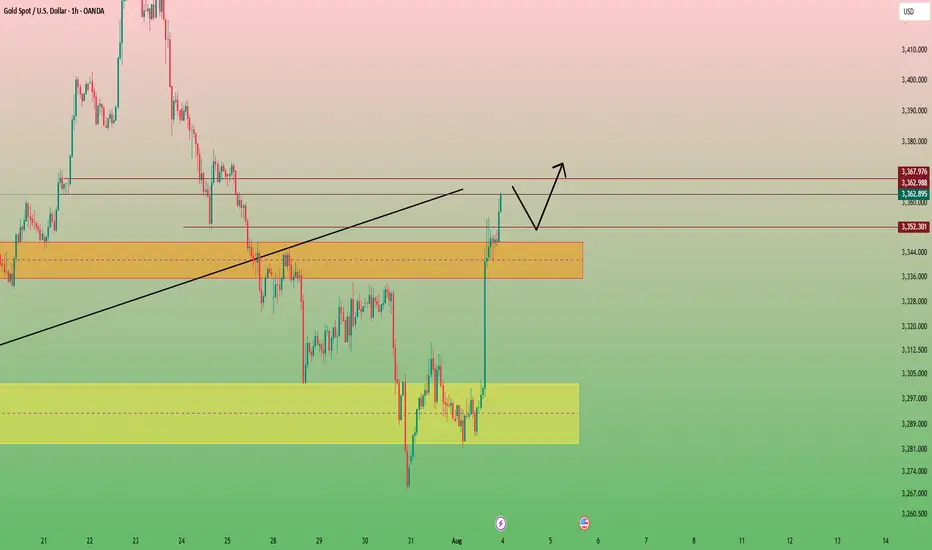
GOLD in 1HHello to all traders. 😎😎
I hope all your deals will hit their targets. 🎉🎉
On the first day of August, gold surged strongly due to news about tariffs imposed by Trump on imported goods. It gained nearly $60 in a single powerful candle.
Currently, I expect a pullback from the $2362–$2370 range down to around $2347–$2352, followed by a potential rebound back to $2370.
⚠️⚠️⚠️⚠️Don’t forget to apply proper risk management!
What Do You Think?
Which scenario do you think is happen? **Share your thoughts!** ⬇️
Don't forget that this is just an analysis to give you an idea and trade with your own strategy. And don't forget the stop loss🛑🛑🛑
❤️❤️❤️The only friend you have in financial markets is your stop loss❤️❤️❤️
Please support me with your ✅' like'✅ and comments to motivate me to share more analysis with you and share your opinion about the possible trend of this chart with me 🙏😊
Be Happy , Ali Jamali
XAUUSDGold (XAUUSD) has been undeniably one of the most rewarding instruments to trade this year. Whether that be longs or shorts.
Well, after the latest drop let’s be clear on one thing…. There is another big one to come.
There is a 4 year cycle of behaviour to not be ignored. Question, what happened this time in the Gold charts 4 years ago?
If you know the answer then you need to be setting up for sells.
Of course there have been many highs made this year and some are anticipating a new ATH before the drop. It is possible based on price action in 2025.
If history is to repeat itself, the open of Asian Session tonight (030825) could see a continuation up of the explosion up of Friday (010825). This should result in the sweeping out of stop losses of any sells that have been held over the weekend.
The closure of the sells will create buying pressure sending price further up to retest at least the most significant swing high. At and from this level and a few more above, we can look out for sustained selling to break below 3300 and beyond.
It is just theory at this point but should be taken into account.
Potential sell areas:
3368-3370
3378-3380
3400-3405
3412-3416
3428-3430
3433-3438
3444-3450
Of course risk management is key. But from the highest point that price reaches early next week could be the start of a very good sell.
All entry zone me should have an initial 1:2RR while holding partial sells with extended TPs as far as 3233,3217,3198,3159,3099.
Good luck 🤞
This is not financial advice and should be taken with a pinch of salt.

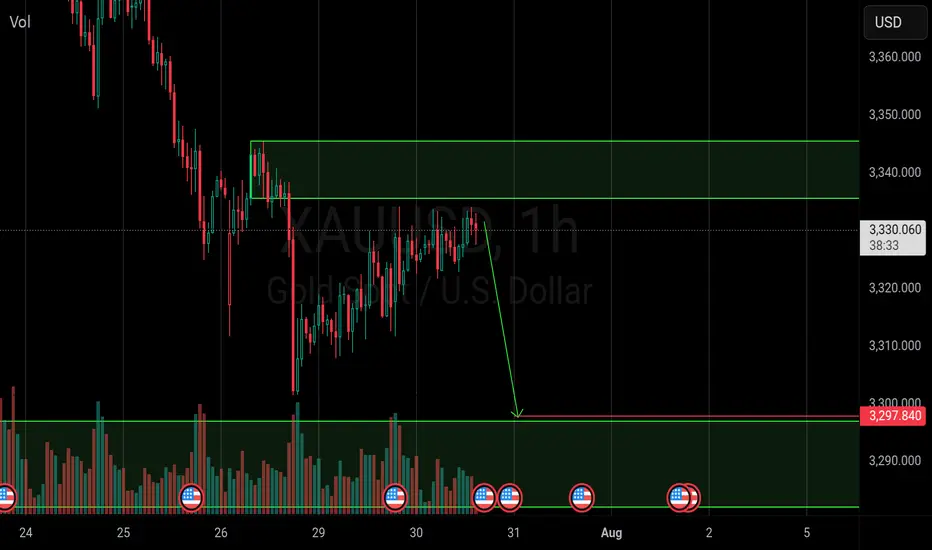
Gold Next Move (Read description). Hello, Traders.
As you saw we have achieved our target at last ideas.
This week gold is running in down trend, today it has touched the price 3268 and then gold pumped.
As you see guys, gold has breakout the last support area and its support became resistance.
Gold has changed the character according to H1 and there is break of structure (BOS).
The trend is bearish, so gold needs to fall, it can fall till 3351.
Comment positive feedbacks, Thanks.

Gold Eliot analysis My predictions about gold in previous years have been quite accurate and calculated. Currently, I think a wave 4 correction, which is a micro-wave, is taking place. As we can see, this micro-wave will probably decrease between $2,700 and $3,000 and then advance to targets above $4,000. Majid Babaei Tehran August 1404

XAU intra?
Hi ,
Broke low at 3305/04 yesterday.
Made low below 3300
Now retesting this area. Good place to place a ticket.
All the best
Not a guru

GOLD awaiting confirmation of a bullish zone formation.Gold has confirmed support at 3310, with the price rebounding and returning to the buying side. We are now awaiting confirmation of a bullish zone formation.
Gold remains under pressure ahead of key market-moving events, including the US GDP data release and the Federal Reserve’s interest rate decision. However, the pause in Dollar strength is offering some support to the gold price. As long as the price holds above this level, the bullish scenario remains valid. A sustained move above this zone may open the path toward the next resistances: 3360 / 3385 we can expect Growth more.
You May find more Details in the Chart.
Trade wisely best of Luck Buddies.
Ps: Support with like and comments for more insights Thanks for Supporting.

Gold (XAUUSD) Buy Setup – 30m Gold (XAUUSD) Buy Setup – 30m Chart
I am in a buy from 3307. Price is holding the support zone 3326–3334.
Looking for a bounce towards 3338 and 3375.
Stop loss below 3290.
