Daily XAUUSD Outlook — Riding the Fed Wave (July 28, 2025)Hey Gold Hunters! 🌟
Today feels like the calm before a storm—ADP whispers tomorrow, the Fed speaks Wednesday, and gold is inching toward its next big move. Let’s weave the macro pulse into our Smart‑Money map, highlight the five real zones, then plot our sniper‑perfect entries. No fluff—just the human beat of the market.
1️⃣ Macro Pulse & Market Mood
US Dollar: Bullish tilt as markets price in another hawkish Fed pause.
Tomorrow (Tue): ADP jobs print could spark an early swing.
Wed PM: FOMC Statement & Powell’s press conference—biggest catalyst this week.
Thu/Fri: Core PCE, Unemployment Claims, then Friday’s NFP + ISM Manufacturing.
Gold is caught in suspense: a squeeze here (into supply) or a slide there (into demand) will come fast once the Fed drops its hint.
🧭 Bias: Neutral‑bearish—looking for lower highs under the 3,345–3,375 supply zone, with a preference to short rallies into that band until price convincingly breaks and holds above 3,375. Once we see a clean weekly‑style close above that level, we’ll flip to neutral‑bullish.
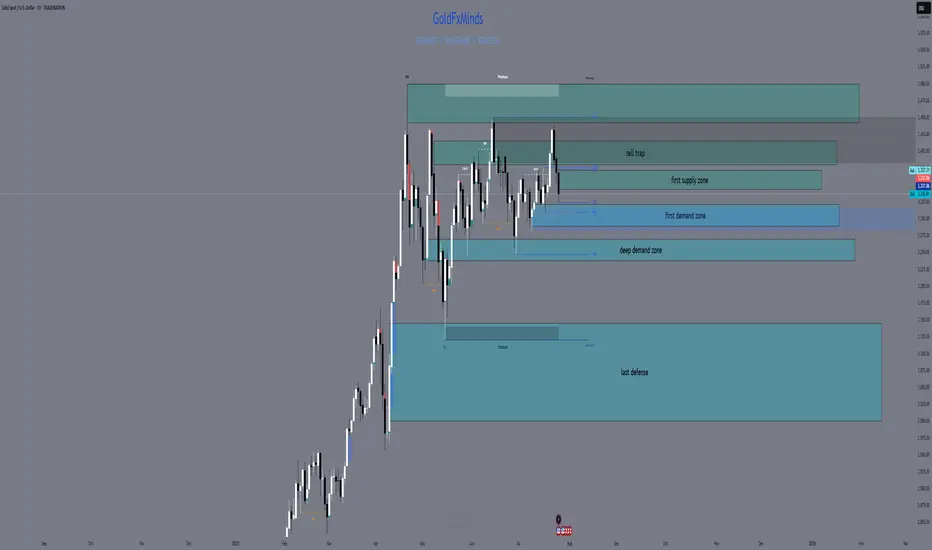
2️⃣ Five Breathing Zones (Top → Bottom)
🛑 Zone 1 “Sky Trap” (3,380 – 3,415)
The final airspace above our daily EMAs (10/50) where stops are hunted. Fib ext’s 127%–161.8% and an unfilled Fair‑Value Gap live here. Any spike that ends in a long upper wick or bearish engulf = short‑trap.
(let price fall clear of this zone before the next)
⚔️ Zone 2 “Premium Supply” (3,345 – 3,375)
The two‑week high order block, hugged by EMA50 and Fib 61.8%. Friday’s rejection candle was born here. Watch for bearish PA after a retest—your core sell zone.
(space down to next)
🌊 Zone 3 “First Demand Cove” (3,290 – 3,320)
Where mid‑June’s buyers piled in: June consolidation OB, filled FVG, and Fib 38.2–50% confluence. SMA100 sits below for extra gravity. A clean drop and bullish reaction here = sniper‑long trigger.
(gap to deep zone)
🚀 Zone 4 “Deep Pullback Bay” (3,240 – 3,270)
Hidden Fair‑Value Gap, BOS origin, and weekly EMA21 converge. If Zone 3 breaks, this is your deep‑dip reload—hunt that D1 reversal wick.
(last space)
🛡️ Zone 5 “Macro Reset Block” (3,000 – 3,140)
The root of 2024’s CHoCH, EMA200/SMA200 cluster, and 78.6–88.6% Fib retrace. Only if gold truly panics on a USD blitz—ultimate accumulation.
3️⃣ Sniper‑Perfect Scenarios
🔴 Short Setup
Where: A thrust into Zone 1 or 2 (3,345+).
Cue: Long upper wick → bearish engulf on D1/M30.
Edge: FVG fill + Fib confluence + RSI rollover.
🟢 Long Setup
Where: A dip into Zone 3 or, if swept, Zone 4.
Cue: Bullish pin‑bar or engulf + reclaim of EMA10/50.
Edge: June OB base + RSI bounce from ~50.
4️⃣ Your To‑Do List
Morning Watch: Does gold flirt with 3,375? Prep your shorts.
Mid‑Day Pull: A drop to 3,300? Hunt your longs.
Avoid: The gaps between zones—those are “no‑man’s land.”
News Trades: Let the daily candle close post‑Fed before committing.
💬 What’s your plan today? Comment below—let’s refine our edge!
👍 Enjoyed this map? Smash that Like & Follow for more pulse‑driven, zero‑fluff outlooks.
Disclosure: Chart powered by Trade Nation’s TradingView feed. I participate in their Influencer Program.
GoldFxMinds 💛
GOLDCFD trade ideas
Gold Price Outlook: Bearish Trend DevelopingGold has broken below key top resistance, indicating potential for continued downside movement.
The US Dollar's recent rise has slowed amid renewed concerns about the US-China trade truce and profit-taking ahead of this week’s key employment data, following already strong GDP and ADP reports. While the dollar remains supported overall, uncertainty is capping its momentum, indirectly adding short-term volatility to gold.
The price action suggests a bearish breakout from key resistance zones. Momentum is building toward the downside, indicating the market could continue lower unless strong support levels hold. A potential bearish flag or breakdown structure is forming, and if confirmed, we may see a decline toward next support zones.
📍 Key Levels to Watch:
Resistance: 3310 / 3320
Support: 3269 / 3240
If gold remains below the broken resistance and fails to reclaim 3320, the bearish pressure is likely to continue. Watch upcoming employment data as it could add volatility and confirm the direction.
You may find more details in the chart.
Ps: Support with like and comments for better analysis Thanks.

GOLD Correction Ahead!
HI,Traders !
#GOLD is growing strongly
And the pair looks locally
Overbought so after it
Hits the horizontal resistance
Area around 3374.56 we will
Be expecting a local bearish
Correction and a move down !
Comment and subscribe to help us grow !

Will Upcoming Data Determine the Next Gold's Direction?Macro approach:
- Gold retreated this week, reversing early gains to trade near four-week lows amid renewed US dollar strength and caution ahead of the Fed's policy decision.
- The retreat was mainly pressured by stronger-than-expected US economic data and a tentative revival in risk appetite, offsetting pockets of safe-haven demand.
- Key drivers included robust US GDP growth for 2Q, a bounce in consumer confidence, and the Fed's steady rates with a more hawkish tone, suggesting cuts may be further out.
- Meanwhile, recent US-EU and US-China trade deals eased some global uncertainty, damping gold's appeal as a hedge.
- Market participants also eyed the labor market's continued cooling, but resilient consumer spending further buoyed the dollar.
- Gold may remain volatile, with potential upside if upcoming US PCE inflation and NFP reports disappoint expectations. Any escalation in trade tensions or signals of Fed policy easing could renew support for gold prices.
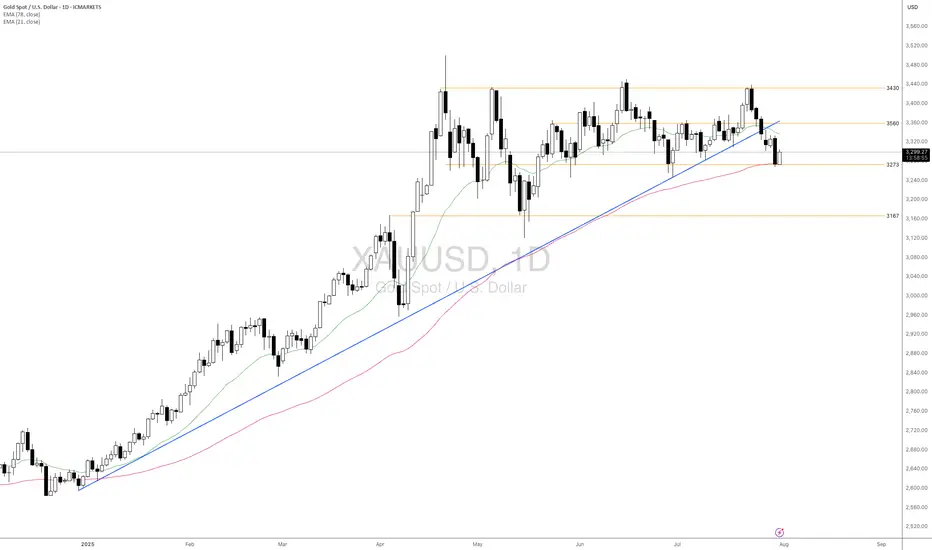
Technical approach:
- XAUUSD fluctuated within the range of 3285-3560, which is below the broken ascending trendline. The price between the two EMAs awaits an apparent breakout to determine the next trend.
- If XAUUSD breaks below the support at 3273, confluence with EMA78, the price may plunge to retest the following support at 3167.
- On the contrary, remaining above the support at 3273 may lead XAUUSD to retest the resistance at around 3560.
Analysis by: Dat Tong, Senior Financial Markets Strategist at Exness
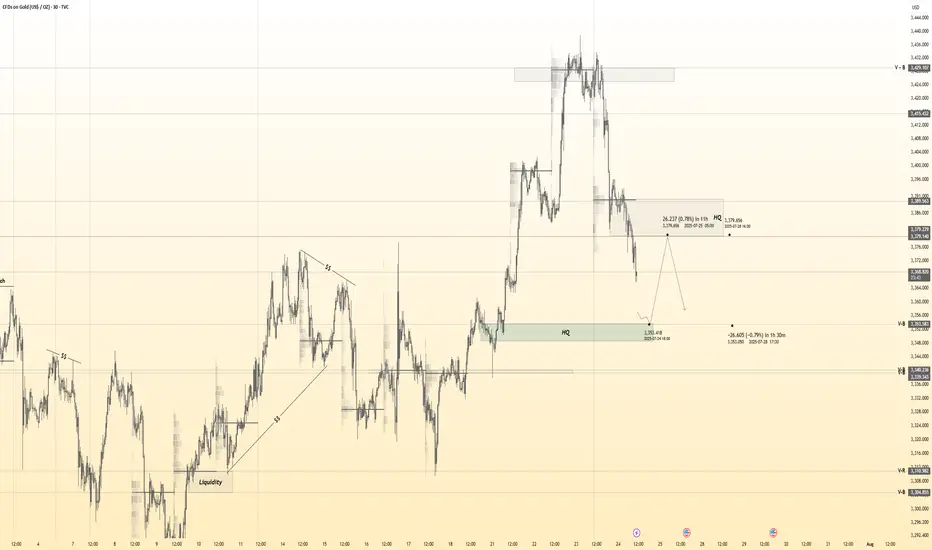
Gold breaks price channel, officially starts falling✏️ OANDA:XAUUSD price has officially broken the bullish wave structure and broken the bullish channel. A corrective downtrend has begun to form. If there is a pull back to the trendline today, it is considered a good opportunity for sell signals.
The liquidity zone 3250 is the target of this corrective downtrend. The 3283 zone also has to wait for confirmation because when the market falls and the momentum of the decline, the number of FOMO sellers will be very strong. The opposite direction is when closing back above 3375, Gold will return to the uptrend.
📉 Key Levels
SELL zone 3343-3345
Target: 3250
BUY trigger: Rejection candle 3285
Buy zone: 3251
Leave your comments on the idea. I am happy to read your views.

GOLD (XAUUSD) -Monthly Analysis & Trading Plan (Aug 2025)GOLD (XAUUSD) -Monthly Analysis & Trading Plan (Aug 2025)
Title: XAUUSD: Correction in Progress, Patience is Key for the Next Move
Chart: XAUUSD Monthly (1M)
Analysis Type: ICT/SMC, Price Action, & Moving Average
Summary:
After a historic and powerful bull run that saw Gold (XAUUSD) breach all-time highs in the first half of 2025, the market has entered a significant corrective phase. The massive red candle in June signaled a strong reversal of momentum, and the current July candle confirms that sellers remain in control, albeit with less intensity. This is a critical juncture for long-term traders, and a strategic approach is required.
Key Observations & Analysis
1. **Price Action & Market Structure:**
The move from late 2024 through May 2025 was a textbook "impulsive leg." The sharp reversal in June 2025, with a powerful bearish candle, likely acted as a **liquidity grab** or a **high-volume distribution event**, trapping late buyers. The market is now in a clear **break in market structure (BOS)** to the downside on this long-term timeframe, suggesting the correction is not over.
2. **ICT/SMC Concepts:**
* **Imbalance/Fair Value Gap (FVG):** The rapid bullish move created significant imbalances on the monthly chart. Price often returns to fill these gaps. The current correction is likely heading to fill or test these inefficiencies.
* **Order Block (OB):** The massive bullish move in late 2024/early 2025 likely created a strong bullish order block. The current sell-off is heading toward this potential institutional demand zone.
* **Liquidity:** The lows from late 2024 and early 2025 will be key liquidity pools. Smart money will likely be targeting these areas for a potential reversal or accumulation.
3. **Moving Average Analysis (MMA):**
* The price is currently trading above both the purple and yellow moving averages, which are still pointing upward. This confirms the long-term trend remains bullish, and the current move is a correction within that trend.
* The **purple moving average** is a key support level to watch. A test of this level would be a high-probability event, and its reaction will be crucial for the next major move.
Suggested Entry & Exit Levels
1. Aggressive Entry (Short)
Rationale
The bearish momentum, though slowing, is still the dominant force. An aggressive trader could look for a continuation of the short-term bearish trend.
Entry/b]
A short entry could be considered on a pullback to the recent highs around **$3,400 - $3,500** if a strong bearish candlestick pattern forms on a lower timeframe (e.g., weekly or daily).
Stop Loss
A tight stop-loss placed just above the recent high, for example, **$3,600**. This is a high-risk entry, so position sizing should be small.
Target
The first major target would be the **moving average support level**, roughly in the **$3,000 - $3,100** zone. The ultimate target for a full correction would be the order block from late 2024, around **$2,800**.
2. Conservative Entry (Long)
Rationale
The long-term trend is still bullish. The current move is a correction. The most prudent approach is to wait for a high-probability long entry at a key support level.
Entry/b]
Wait for price to reach the **purple moving average support zone (around $3,000 - $3,100)**. Look for a clear reversal signal on this level, such as a large bullish "pin bar" or "engulfing candle" on the monthly or weekly chart. This would be a high-probability demand zone for a reversal.
Stop Loss
A stop-loss should be placed below this key support level, perhaps around **$2,850 - $2,900**, giving the trade room to breathe.
Target
The first target for a new bullish leg would be the New swing high around **$3,800**. The ultimate long-term target would be a new all-time high above **$4,000**.
Conclusion
The Gold market is in a crucial phase. The bullish party from earlier in 2025 is over for now, and a healthy correction is underway. **The most logical and safe approach is to wait for the market to complete its corrective move.** Do not attempt to catch a falling knife. Instead, be patient and wait for price to reach a key institutional demand zone (our moving average support or the late 2024 order block) and show a clear sign of reversal. This will present a high-probability, low-risk long entry for the next impulsive move up.
Disclaimer
This is not financial advice. Please perform your own due diligence and risk management. Trading involves a significant risk of loss.

Gold 30Min Engaged ( Bullish & bearish Reversal Entry Detected )————-
➕ Objective: Precision Volume Execution
Time Frame: 30-Minute Warfare
Entry Protocol: Only after volume-verified breakout
🩸 Bullish Reversal : 3354
🩸 Bearish Reversal : 3378
➗ Hanzo Protocol: Volume-Tiered Entry Authority
➕ Zone Activated: Dynamic market pressure detected.
The level isn’t just price — it’s a memory of where they moved size.
Volume is rising beneath the surface — not noise, but preparation.
🔥 Tactical Note:
We wait for the energy signature — when volume betrays intention.
The trap gets set. The weak follow. We execute.
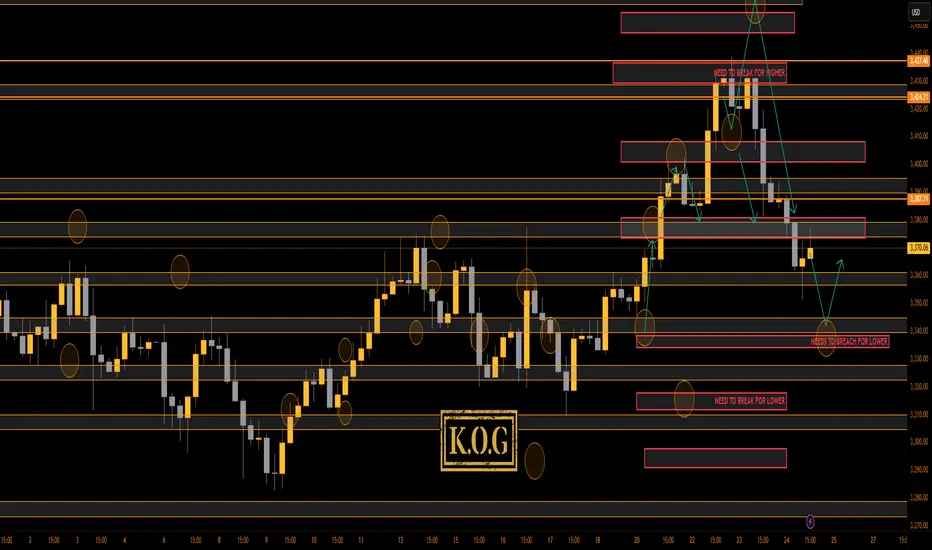
THE KOG REPORT - UpdateEnd of day update from us here at KOG:
Not bad play at all with the red boxes working well, KOG's bias of the day and the red box targets working well and of course the indicators and our trusted algo Excalibur guiding the way completing the move that we wanted downside. We then got a fantastic long from the bias level and red box activation up into where we are now.
So, what now?
We have resistance and a red box above which is broken suggesting we may see some more movement downside in the coming sessions. This would also align with the hunt and undercut low that can take place at this key level. We're a bit too low to short, so we'll either look for the break above 3375 to go higher, or, we'll wait lower for a potential long trade from the red box region.
Immediate support here is 3360-5 and resistance 3375.
Price: 3364
KOG’s Bias of the day:
Bullish above 3350 with targets above 3358✅, 3365✅ and above that 3379✅
Bearish on break of 3350 with target below 3337 and below that 3330
RED BOXES:
Break above 3365 for 3372✅, 3375✅, 3388 and 3406 in extension of the move
Break below 3350 for 3335, 3330, 3326 and 3307 in extension of the move
As always, trade safe.
KOG
How to Find Liquidity Zones/Clusters on Any Forex Pair (GOLD)
You need just 1 minute of your time to find significant liquidity zones on any Forex pair and Gold.
In this article, I will teach you how to identify supply and demand zones easily step by step.
Liquidity Basics
By a market liquidity, I mean market orders.
The orders are not equally distributed among all the price levels.
While some will concentrate the interest of the market participants,
some levels will be low on liquidity.
Price levels and the areas that will attract and amass trading orders will be called liquidity zones.
How to Find Supply Zones
To find the strongest liquidity clusters, we will need to analyze a daily time frame.
A liquidity zone that is above current prices will be called a supply zone.
High volumes of selling orders will be distributed within.
One of the proven techniques to find such zones is to analyze a historic price action. You should identify a price level that acted as a strong resistance in the past.
4 horizontal levels that I underlined on EURGBP influenced market behavior in the recent past.
The price retraced from these levels significantly.
Why It Happened?
A down movement could occur because of an excess of selling orders and a closure of long positions by the buyers.
These factors indicate a high concentration of a liquidity around these price levels.
How to Draw Supply Zone?
One more thing to note about all these horizontal levels is that they cluster and the distance between them is relatively small .
To find a significant liquidity supply zone, I advise merging them into a single zone.
To draw that properly, its high should be based on the highest high among these levels. Its low should be based on the highest candle close level.
Following this strategy, here are 2 more significant supply zones.
We will assume that selling interest will concentrate within these areas and selling orders will be spread across its price ranges.
How to Find Demand Zones
A liquidity zone that is below current spot price levels will be called a demand zone . We will assume that buying orders will accumulate within.
To find these zones, we will analyze historically important price levels that acted as strong supports in the past.
I found 3 key support levels.
After tests of these levels, buying pressure emerged.
Why It Happened?
A bullish movement could occur because of an excess of buying orders and a closure of short positions by the sellers. Such clues strongly indicate a concentration of liquidity.
How to Draw Demand Zones?
Because these levels are close to each other, we will unify them into a one liquidity demand zone.
To draw a demand zone, I suggest that its low should be the lowest low among these key levels and its high should be the lowest candle close.
Examine 2 more liquidity zones that I found following this method.
Please, note that Demand Zone 2 is based on one single key level.
It is not mandatory for a liquidity zone to be based on multiple significant levels, it can be just one.
We will assume that buying interest will concentrate within these areas and buying orders will be allocated within the hole range.
Broken Liquidity Zones
There is one more liquidity zone that I did not underline.
That is a broken supply zone. After a breakout and a candle close above, it turned into a demand zone. For that reason, I plotted that based on the rules of supply zone drawing.
Start Market Analysis From Liquidity
Liquidity zones are one of the core elements of forex trading.
Your ability to recognize them properly is the key in predicting accurate price reversals.
Identify liquidity zones for:
spotting safe entry points,
use these zones as targets,
set your stop losses taking them into consideration.
They will help you to better understand the psychology of the market participants and their behavior.
I hope that the today's tutorial demonstrated you that it is very easy to find them.
❤️Please, support my work with like, thank you!❤️
I am part of Trade Nation's Influencer program and receive a monthly fee for using their TradingView charts in my analysis.

10 POWERFUL INVESTING & TRADING QUOTES OF ALL TIME
Here are powerful quotes of professional traders, investors and experts in financial markets.
Let their words inspire you and help you in your trading journey.
"To succeed in the market, you must learn to think like everyone else and do the opposite." - Sir John Templeton 📈💭💡
"The four most dangerous words in investing are: 'This time it's different.'" - Sir John Templeton ⏳📉🛑
"The more you learn, the more you earn." - Warren Buffett 📚💰📈
"The key to trading success is emotional discipline. If intelligence were the key, there would be a lot more people making money." - Victor Sperandeo. 💪💰🚫🧠
"Investing is not about making predictions, it's about having a plan and sticking to it." - Tony Robbins 📊🔄📌
"The best time to buy a stock is when the blood is running in the streets." - Baron Rothschild 💀🔪💰
"The best investment you can make is in yourself." - Warren Buffett 💼💡💰
"The stock market is not a casino; it's a crooked casino." - Charlie Munger 🎰🎲🏛️
"Losses are part of the game. You can't win every trade." - Martin Schwartz. 📉😔💔
"The fundamental law of investing is the uncertainty of the future." - Peter Bernstein. ⚖️❓🔮
The More I trade, the more I realize how precise and meaningful are these phrases. Take them seriously, and they will help you achieve the financial success.
❤️Please, support my work with like, thank you!❤️
I am part of Trade Nation's Influencer program and receive a monthly fee for using their TradingView charts in my analysis.
SMART MONEY CONCEPT (SMC)Bearish Analysis – Market Structure
1: Market Context
• The price was coming from a strong bullish structure that had already mitigated the last remaining interest in the 4H OB.
• A key resistance zone was formed where institutional investors closed buy orders.
• The bullish momentum left a Fair Value Gap in 1H, which has not yet been mitigated.
2: Shift Signals
• A fake out (false breakout) was observed above the resistance, followed by a Change of Character (Choch).
• This indicates liquidity absorption and the possible start of a bearish phase.
• Distribution structure confirmed before the bearish momentum.
3:Entry Plan and Target
• Entry (Sell): In the upper zone after the 4H OB retest/resistance.
• Stop Loss: Above the fake out wick (invalidation zone).
• Take Profit: Around 3305, seeking to mitigate the FVG-1H and reach the previous support zone.
• RR: High (favorable for swing or scalping with partials).
4:Confirmation and Management
• Wait for confirmation on a lower timeframe (5M / 1M) before executing the entry.
• Watch for a possible last liquidity grab before falling.
• Manage with partials and move the SL to BE when the halfway point is exceeded.
GOOD LUCK TRADERS…

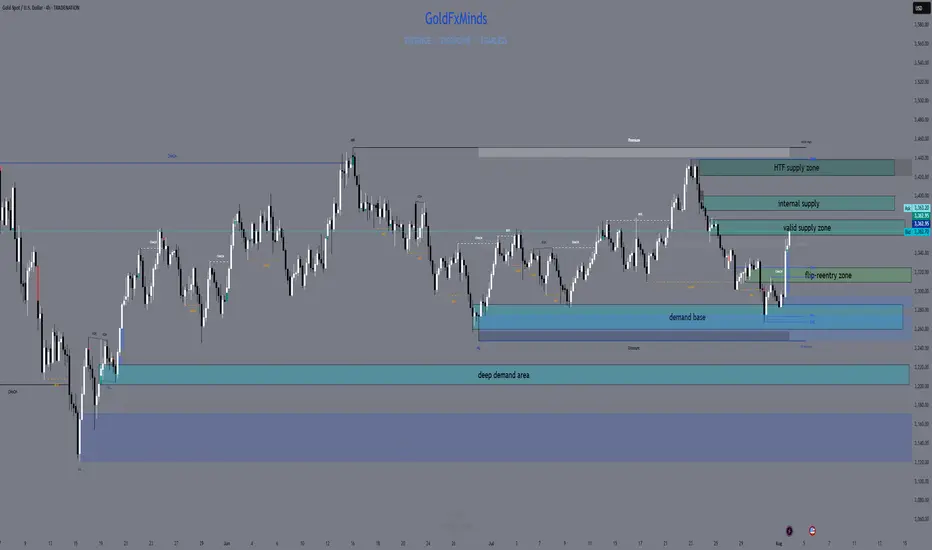
XAUUSD H4 Outlook – August 4, 2025Structure is bullish — but supply is layered. Precision now matters more than bias.
—
Gold is trading at 3362, sitting right inside the heart of a key structural zone. After a strong breakout from 3285–3260, price reclaimed imbalance, broke internal structure, and powered higher into premium. The trend is bullish — but we’ve just stepped into stacked supply.
Let’s break down every zone that matters now, from top to bottom:
🟥 3360–3375 – Valid H4 Supply Zone
This is the first active supply block — the origin of the last bearish leg. It holds a clean OB + imbalance and is currently being tested for mitigation.
We're inside it right now. This zone is critical:
→ If price breaks and holds above it, continuation is likely
→ If we reject here, it confirms sellers are defending their level
🟥 3385–3398 – Internal Supply Trap
A secondary supply zone built from previous order flow.
If bulls push through 3375 without rejection, this is the next area to watch for weakness.
This zone often creates fake breakouts, especially when momentum slows. RSI is already showing signs of exhaustion approaching this level.
🟥 3420–3440 – HTF Supply Trap
This is the top — the last unmitigated supply on the weekly.
It's not in play yet, but if bulls break above 3398 decisively, this is where the bigger trap could form.
Any long into this zone must be backed by strong structure and continuation candles — otherwise, it’s a liquidation magnet.
🟫 3322–3310 – Flip Reentry Zone
If we reject from current supply, this is the first high-probability reentry for bulls.
It’s where the last CHoCH confirmed, and it aligns with EMA confluence and minor imbalance.
Buy setups from here must be confirmed on M15/M30 — no blind longs.
🟦 3285–3260 – Breaker Demand Base
The true origin of the bullish move.
This zone caused the structural flip — clean OB, FVG stack, and liquidity sweep.
If price returns here, it becomes a must-hold for bullish continuation. One of the best sniper zones for longs.
🟦 3222–3205 – Final Demand Layer
Deep structure zone holding imbalance + previous HL base.
Only comes into play if 3260 fails. A break below this would shift bias to neutral or bearish on H4.
🎯 Bias Summary
✔️ H4 bias = bullish
✔️ Price is inside 3360–3375 supply
✔️ EMA 5/21/50 aligned, but RSI is elevated
⚠️ This is not a breakout — it’s a test zone
🔁 Execution Plan
📍 Rejection from 3360–3375 → sell scalp toward 3322
📍 Clean break of 3375 → watch for next short at 3385–3398
📍 Failure of 3398 → HTF draw toward 3430–3439
📍 Pullback toward 3322–3310 → potential long zone
📍 Clean drop to 3285 → high-RR buy area
📍 Break below 3260 → only valid demand left is 3222
—
This is not the time to chase. It’s the time to stalk.
You’re in premium. Supply is active. Let structure decide — you just execute with clarity.
—
Which zone are you watching for your next move?
Comment your bias below 👇🏼 Smash the ❤️ if this brought clarity, and follow GoldFxMinds to trade with precision every day.
Disclosure: Chart based on Trade Nation feed (TradingView).
XAUUSD Daily Outlook – August 4, 2025We’re not in breakout. We’re deep in premium — and supply is stacked.
—
Gold is now trading at 3362, sitting right inside the first valid daily supply zone — the same block between 3355 and 3375 that caused the last rejection. The bullish rally from 3272 was clean: liquidity sweep, CHoCH, imbalance filled, HL confirmed. Bulls did their job. Now they’re walking straight into pressure.
Above this zone, things don’t get easier — they get trickier.
Just a bit higher, we have an internal supply trap between 3398 and 3412. It’s a reaction zone built from imbalance and inducement — not strong enough to hold a reversal on its own, but perfect to fake out breakout buyers. If price pushes through 3375 and enters this pocket, snipers should be watching carefully for early signs of weakness.
And finally, at the top of the current structure sits the HTF supply trap at 3430–3439 — the last weekly wick, the macro reversal zone. That level is sacred. If price makes it there, either we’ll see full-blown expansion… or a violent reversal born from overconfidence.
So what do we do now?
We wait.
If price starts to reject from this 3355–3375 supply with bearish intent, we target the flip reentry zone at 3318–3328 — the previous CHoCH break and dynamic EMA cluster. That’s your first intraday long trigger if bulls want to come back strong.
If that breaks, next is the demand base at 3287–3267, the origin of this entire bullish move. Below that? Imbalance support near 3225 — the final line before structure shifts.
—
🟥 Valid Supply Zone → 3355–3375
🟥 Internal Supply Trap → 3398–3412
🟥 HTF Supply Trap → 3430–3439
🟫 Flip Reentry Zone → 3318–3328
🟦 Demand Base → 3287–3267
🟦 Imbalance Support → 3225–3205
—
This isn’t a breakout. It’s a build-up inside premium.
The smartest move today might be no move — until structure speaks.
—
Are you watching for the rejection? Or the breakout trap?
Let us know your bias below 👇🏼
Tap that ❤️ if this gave clarity, and follow GoldFxMinds to stay ahead of every key level — no noise, just structure.
—
With sniper calm and strategic clarity,
GoldFxMinds 💙
Disclosure: Analysis based on Trade Nation TradingView chart feed.

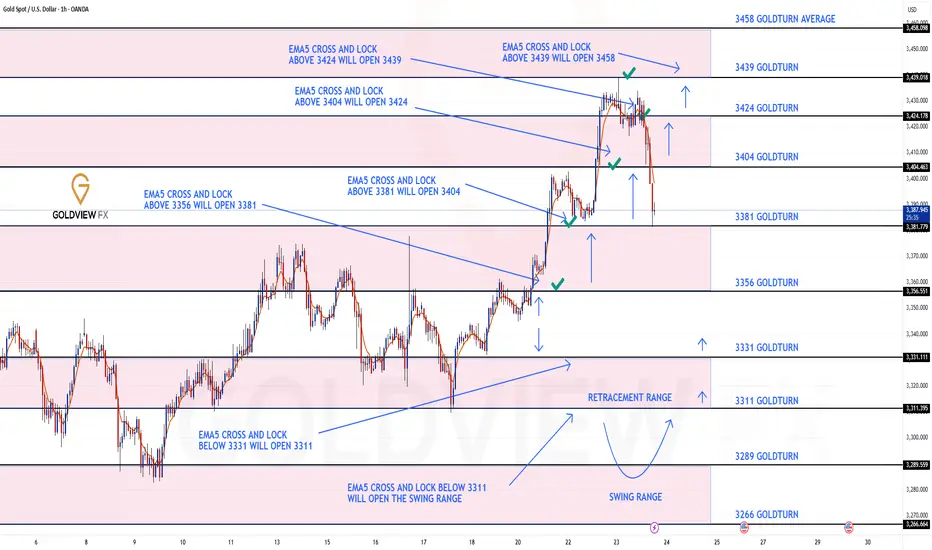
GOLD ROUTE MAP UPDATEHey Everyone,
Another PIPTASTIC day on the charts with our analysis once again hitting gold!!!
After completing all our bullish targets yesterday we stated that we will now look for EMA5 lock above 3424 to open the next bullish level at 3439.
- This played out perfectly completing 3439 to perfection!!
We are now seeing no further lock above 3439 confirming the rejection, which we are seeing now. We will now look for lower Goldturns to be tested for support and bounce inline with our plans to buy dips.
We will keep the above in mind when taking buys from dips. Our updated levels and weighted levels will allow us to track the movement down and then catch bounces up.
We will continue to buy dips using our support levels, taking 20 to 40 pips. As stated before, each of our level structures gives 20 to 40 pip bounces, which is enough for a nice entry and exit. If you backtest the levels we’ve shared every week for the past 24 months, you’ll see how effectively they were used to trade with or against short/mid-term swings and trends.
The swing ranges give bigger bounces than our weighted levels, that’s the difference between the two.
BULLISH TARGET
3356 - DONE
EMA5 CROSS AND LOCK ABOVE 3356 WILL OPEN THE FOLLOWING BULLISH TARGETS
3381 - DONE
EMA5 CROSS AND LOCK ABOVE 3381 WILL OPEN THE FOLLOWING BULLISH TARGET
3404 - DONE
EMA5 CROSS AND LOCK ABOVE 3404 WILL OPEN THE FOLLOWING BULLISH TARGET
3424 - DONE
EMA5 CROSS AND LOCK ABOVE 3424 WILL OPEN THE FOLLOWING BULLISH TARGET
3439 - DONE
EMA5 CROSS AND LOCK ABOVE 3439 WILL OPEN THE FOLLOWING BULLISH TARGET
3458
BEARISH TARGETS
3331
EMA5 CROSS AND LOCK BELOW 3331 WILL OPEN THE FOLLOWING BEARISH TARGET
3311
EMA5 CROSS AND LOCK BELOW 3311 WILL OPEN THE SWING RANGE
3289
3266
As always, we will keep you all updated with regular updates throughout the week and how we manage the active ideas and setups. Thank you all for your likes, comments and follows, we really appreciate it!
Mr Gold
GoldViewFX
XAUUSD – Is gold getting ready to bounce?Right now, gold is reacting around the 3,280 support zone after breaking down from its previous ascending channel. While the broader trend is still under bearish pressure, the recently released JOLTS data came in lower than expected, signaling that the U.S. labor market may be cooling — a mildly positive sign for gold.
From a technical view, price is showing signs of forming a short-term bottom near 3,229 and is starting to rebound. If gold can hold above this support and break through 3,339, a recovery toward the 3,360–3,400 zone could unfold.
That said, this bounce is likely just a technical correction. Without more bearish news for the dollar, gold still risks being rejected around the FVG area and heading lower again.
Trading idea: Consider short-term Buy opportunities if price stays above 3,280 and forms a clear reversal pattern. Stop-loss below 3,229. Short-term targets: 3,339–3,360.
What about you? Leaning towards buying the dip or staying with the downtrend?

Gold Sell Setup - M15PEPPERSTONE:XAUUSD
Timeframe: m15
Risk Level: Medium
🔹 Setup:
Price is testing the upper boundary of the descending channel.
📈 Entry:
Current price zone: 3302.5
🎯 Targets (TP):
TP1: 3393
TP2: 3283
TP4: 3264
TP6: 3244
⛔ Stop Loss (SL):
3312.2
#XAUUSD #GOLD #SELL #Signal #MJTrading
Psychology Always Matters:

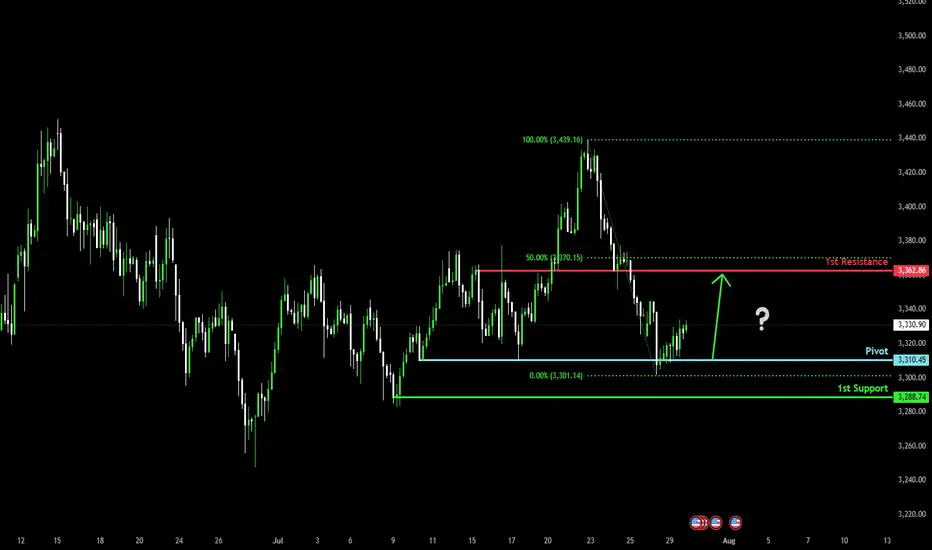
Bullish bounce off?The Gold (XAU/USD) has bounced off the pivot, which acts as a multi-swing low support and could rise to the 1st resistance, which is slightly below the 50% Fibonacci retracement.
Pivot: 3,310.45
1st Support: 3,288.74
1st Resistance: 3,362.86
Risk Warning:
Trading Forex and CFDs carries a high level of risk to your capital and you should only trade with money you can afford to lose. Trading Forex and CFDs may not be suitable for all investors, so please ensure that you fully understand the risks involved and seek independent advice if necessary.
Disclaimer:
The above opinions given constitute general market commentary, and do not constitute the opinion or advice of IC Markets or any form of personal or investment advice.
Any opinions, news, research, analyses, prices, other information, or links to third-party sites contained on this website are provided on an "as-is" basis, are intended only to be informative, is not an advice nor a recommendation, nor research, or a record of our trading prices, or an offer of, or solicitation for a transaction in any financial instrument and thus should not be treated as such. The information provided does not involve any specific investment objectives, financial situation and needs of any specific person who may receive it. Please be aware, that past performance is not a reliable indicator of future performance and/or results. Past Performance or Forward-looking scenarios based upon the reasonable beliefs of the third-party provider are not a guarantee of future performance. Actual results may differ materially from those anticipated in forward-looking or past performance statements. IC Markets makes no representation or warranty and assumes no liability as to the accuracy or completeness of the information provided, nor any loss arising from any investment based on a recommendation, forecast or any information supplied by any third-party.
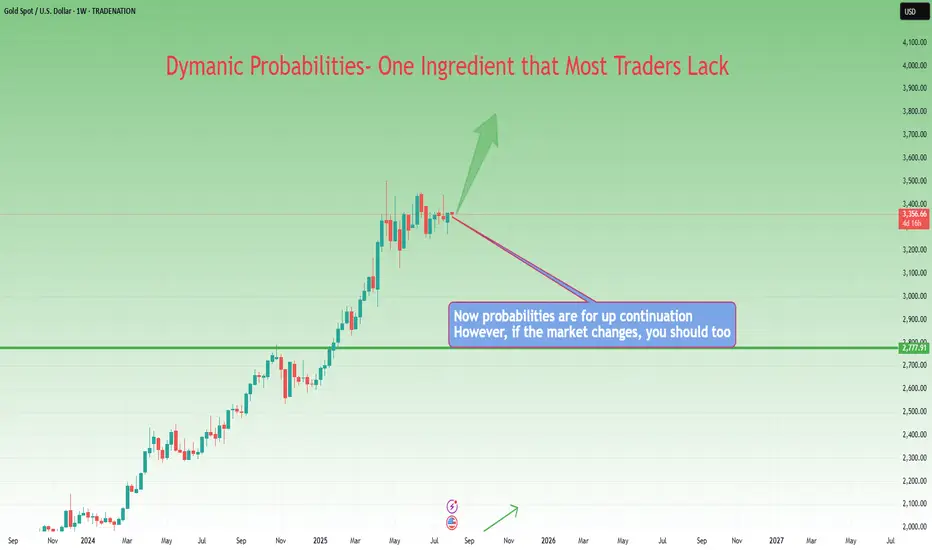
From Execution to Adaptation: Enter Dynamic ProbabilitiesIn the previous article , we looked at a real trade on Gold where I shifted from a clean mechanical short setup to an anticipatory long — not because of a hunch, but because the market behavior demanded it.
That decision wasn’t random. It was based on new information. On structure. On price action.
It was based on something deeper than just “rules” — it was about recognizing when the probability of success had changed.
That brings us to a powerful but rarely discussed concept in trading:
👉 Dynamic probabilities.
________________________________________
📉 Static Thinking in a Dynamic Market
Most traders operate with static probabilities — whether they realize it or not.
They assign a probability to a trade idea (let’s say, “this breakout has a 70% chance”) and treat that number as if it’s written in stone.
But markets don’t care about your numbers.
The moment new candles print, volatility shifts, or structure morphs — the probability landscape changes. What once looked like a clean setup can begin to deteriorate. Conversely, something that looked uncertain can start aligning into high-probability territory.
Yet many traders fail to adapt because they’re emotionally invested in the original plan.
They’ve already “decided” what the market should do, so they stop listening to what the market is actually doing.
________________________________________
🧠 Dynamic Probabilities Require Dynamic Thinking
To trade dynamically, you must be able to update your internal odds in real time.
This doesn’t mean constantly second-guessing or overanalyzing — it means refining your bias based on evolving context:
• A strong breakout followed by weak continuation? → probability drops.
• Price holding above broken resistance with clean structure? → probability increases.
• Choppy pullback into support with fading volume? → potential reversal builds.
It’s like playing poker: you might start with a good hand, but if the flop goes against you, your odds change.
If you ignore that and keep betting like you’ve got the nuts, you’re not being bold — you’re being blind.
________________________________________
📍 Back to the Gold Trade
In the Gold trade, the initial short was based on structure: broken support turned resistance.
The entry was mechanical, the reaction was clean. All good.
But then:
• Price came back fast into the same zone.
• Sellers failed to defend it decisively.
• The second leg down was sluggish, overlapping, and lacked momentum.
• Compression began to form.
That’s when the probability of continued downside collapsed — and the probability of a reversal increased.
The market had changed. So did my bias.
That’s dynamic probability in action — not because of a feeling, but because of evolving evidence.
________________________________________
🧘♂️ The Psychological Trap
Many traders intellectually accept the idea of being flexible — but emotionally, they cling to certainty.
They fear being “inconsistent” more than they fear being wrong.
But in a dynamic environment, consistency of thinking is not about repeating the same action — it’s about consistently reacting to what’s real.
True consistency is not mechanical repetition. It’s mental adaptability grounded in logic.
________________________________________
🧠 Takeaway
If you want to trade professionally, you must upgrade your mindset from fixed-probability execution to fluid-probability reasoning.
That doesn’t mean chaos. It means structured flexibility.
Your edge isn’t just in spotting patterns — it’s in knowing when those patterns are breaking down.
And acting accordingly, before your PnL does it for you.
Disclosure: I am part of TradeNation's Influencer program and receive a monthly fee for using their TradingView charts in my analyses and educational articles.
Gold Under Pressure – Temporary Pullback or Start of a DowntrendHello everyone, great to see you again.
Today, let’s focus on the bearish factors surrounding gold. At the time of writing, gold is trading around 3,331 USD, down 50 pips on the day, continuing its downward correction since the end of last week.
Within just a few days, gold has plunged from its peak of 3,433 USD—losing nearly 100 USD per ounce.
This sharp drop is largely driven by profit-taking and market anticipation ahead of key economic data next week, including U.S. interest rate decisions, inflation, and job reports.
This week is packed with critical updates: growth figures, inflation stats, employment numbers, and monetary policy decisions from major central banks—all of which could significantly impact gold’s next move.
According to a recent survey, 36% of analysts expect gold to fall further, while retail investors remain optimistic about a rebound.
For now, the market is clearly in a correction phase. Caution is advised.
What do you think—will gold bounce back or continue to drop?

Gold’s Biggest Day of 2025: Collapse or New High Incoming?🟡 Gold Pre-FOMC Update | Patience Paid Off
In my previous analysis released on Monday, we highlighted the significance of the 3310 key red level on gold. I mentioned that if we got a daily candle close below this zone, it could trigger further downside.
That scenario didn’t play out — price closed above 3310, and that’s exactly why we stayed out of any short positions. No guessing, no forcing. Just patience.
On the flip side, I also said we need a daily close above 3350 to even consider going long. And as you can see, for the past two days, price has been ranging tightly between 3310 and 3330 — with relatively low trading volume across the board.
After 9 years of optimizing this strategy, one core principle remains unchanged:
🛡️ Capital protection and maximum risk control always come first.
And I can confidently say — those filters are working beautifully. I hope you’re benefiting from this approach too.
Now technically speaking, everything is lining up for a bullish DXY and bearish gold —
But tonight’s FOMC meeting and Powell vs. Trump drama will be the final trigger.
Let’s watch closely. Smart trading is patient trading. 🧠⚖️
🔁 This analysis will be updated whenever necessary.
Disclaimer:This is not financial advice. Just my personal opinion.

GOLD Bullish Today , Long Scalping Entry Valid To Get 150 Pips !Here is My 15 Mins Gold Chart , and here is my opinion , we finally above 3296.00 and we have a 30 Mins Candle closure above it , so i`m waiting the price to go back and retest this res and new support and give me a good bullish price action to can enter a buy trade and we can targeting 100 to 150 pips .
Reasons To Enter :
1- New Support Created
2- Bullish Price Action
3- Bigger T.F Giving Good Bullish P.A .

XAUUSD August 2025 Monthly OutlookWelcome to August — and welcome to the top of the macro ladder. Gold is not just rising. It’s rewriting structure.
🔸 Macro & Fundamentals
Gold opens August with a fresh impulsive breakout above $3360, fuelled by a weaker USD, rising global risk sentiment, and continued speculative positioning from institutional buyers. The upcoming Jackson Hole meeting and shifting Federal Reserve expectations create the perfect climate for volatility. All eyes are now on the premium structure top — but will gold expand beyond it or retrace to refill?
🔸 Monthly Trend & Bias (HTF Overview)
🔹 Structure: Clean bullish BOS, continuation leg in progress
🔹 Last CHoCH: April 2023 → Confirmed full trend shift bullish
🔹 Current Monthly Candle: Explosive push into supply with top wick rejection beginning to show
🔹 Bias: Still bullish but in extreme premium — watch for cooling/rebalancing
🔸 EMA Structure
| EMA Type | Status | Signal |
| ----------- | -------------- | ------------------------------------- |
| EMA 5 / 21 | Strong Bullish | Dynamic expansion, steep angle upward
| EMA 50 | Below | Clean breakout from range
| EMA 100/200 | Far below | Long-term uptrend deeply intact
🔸 Key HTF Levels (Wick-to-Wick Mapping)
Zone Type Price Range Confluences
🔴 Premium Supply 3350 – 3439 Monthly FVG + Wick exhaustion + RSI 80+
🔵 Bullish Imbalance 3180 – 3270 Monthly FVG + old BOS + EMA5 baseline
🔵 Mid-Level Support 2920 – 3000 Monthly OB + FVG + structure base
🔵 Deep Demand 2670 – 2780 HTF equilibrium zone + RSI support
✅ The current candle has pierced into the final wick supply, but with clear signs of loss in momentum.
⚠️ If 3439 breaks cleanly, next expansion zone opens toward 3505 → 3610 (Fibonacci projection). Otherwise, expect cooling to 3270–3180 first.
🔸 Fibonacci Context
🔻 Swing Low: 1810
🔺 Swing High: 3439
🎯 Current price ($3363) sits just below the 100% Fibonacci projection, with the 1.272 and 1.618 extensions at 3610 and 3740.
This confirms we are in a macro premium, and any long positions from here forward must be built only on strong LTF confirmation or clean pullbacks into value.
🔸 August Scenarios
🟢 Scenario 1 – Breakout + Price Discovery
If bulls break 3439 with strong volume and close:
New leg toward 3505 → 3610 opens
Watch for LTF continuation on H4–D1 with bullish OB reentry
Only valid if 3350 holds as new support
🔻 Scenario 2 – Rejection + Healthy Pullback
If price holds below 3439 and monthly wick exhausts:
Clean retracement toward 3270 → 3180 expected
EMA5/21 rebalancing will support bullish structure
Deeper rejection could retest 3070 zone if volatility spikes
🔸 Conclusion & Action Plan
We open August fully inside the last monthly supply zone. Trend is still bullish, but RSI, FVGs, and EMA distance warn us: this is not the time to chase — it’s time to wait for structure to speak.
📌 Key pivot = 3439.
Above it → Expansion.
Below it → Retracement.
Let August unfold — but stay sharp. The next big move will be born from this compression.
—
What’s your take — are we just getting started or about to cool off?
Drop your thoughts, chart it out, and stay ready for what August brings. ⚔️
—
❤️ Like if you enjoy clean, actionable updates🚀🚀🚀
🔁 Share with traders who love structure over noise
With clarity, confidence, and control,
GoldFxMinds
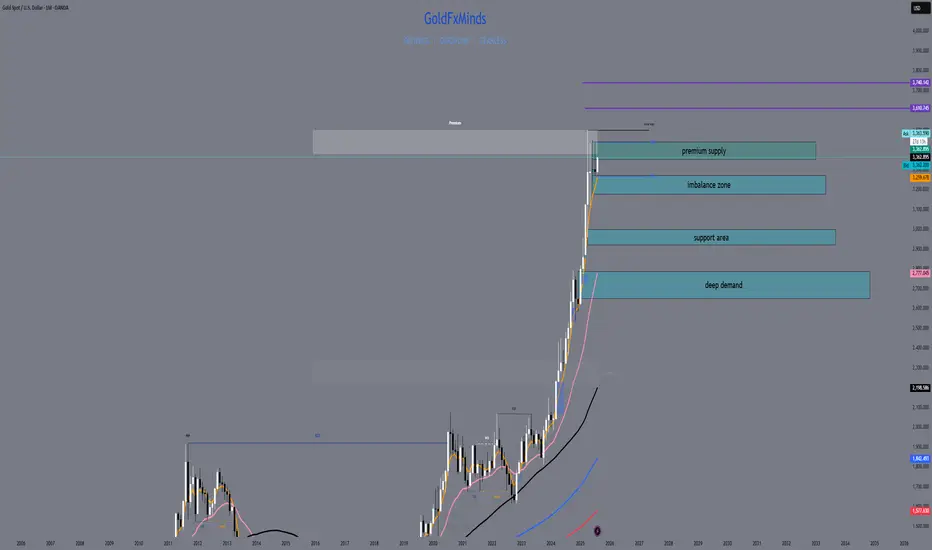
GOLD prep work to ATH retap has started. seed at 3270!First thing first.
Diagram above is in reverse metrics (USDXAU)
--------
GOLD, has been met with some well deserved respite on price growth after a series of parabolic highs this past few weeks. And this healthy trims are warranted in the grand scheme of things -- to sustain its upward trajectory. A price rest is definitely welcomed.
Now based on our latest daily metrics, gold is showing some low key hints of shift -- it may not be visible to 99% of traders -- but it is there now to magnify.
Diagram above is in reverse metrics (USDXAU). It is currently showing some pressure expansion for bears and hinting of prep work to reverse.
This is a precursor of a massive structure change-- for that elusive upside continuation.
On the daily metrics, we got some hop signals here as well from -- first one in a while. Price baselines detaching itself from the descending trend line. There maybe something here now. A good zone to seed on the most discounted bargain levels -- with safety.
Spotted at 3260.
Interim mid target: ATH at 3500
Long term. 4k++
Trade safely.
TAYOR.
