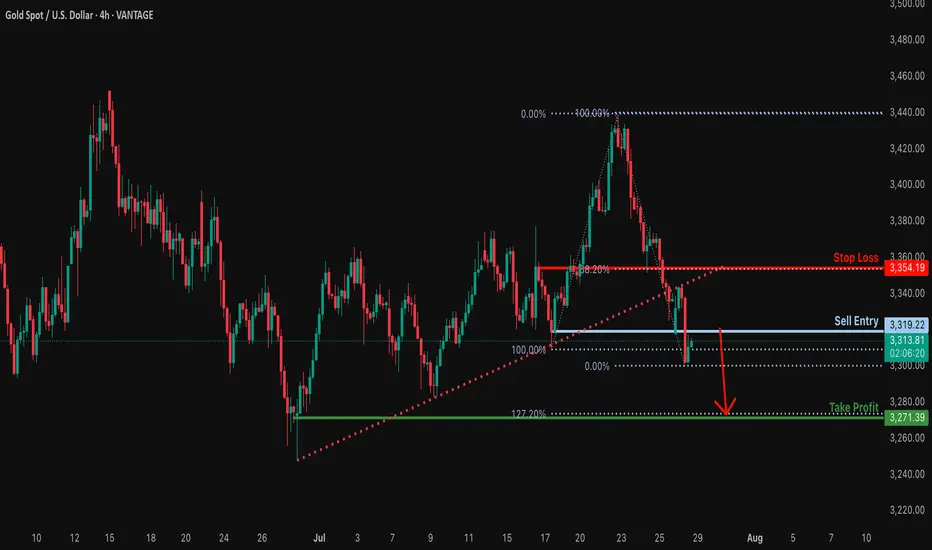
Bearish reversal?XAU/USD is rising towards the resistance level, which serves as a pullback resistance and could drop from this level to our take-profit target.
Entry: 3,319.22
Why we like it:
There is a pullback resistance.
Stop loss: 3,354.19
Why we like it:
There is a pullback resistance that aligns with the 38.2% Fibonacci retracement.
Take profit: 3,271.39
Why we like it:
There is a swing low support that lines up with the 127.2% Fibonacci extension.
Enjoying your TradingView experience? Review us!
Please be advised that the information presented on TradingView is provided to Vantage (‘Vantage Global Limited’, ‘we’) by a third-party provider (‘Everest Fortune Group’). Please be reminded that you are solely responsible for the trading decisions on your account. There is a very high degree of risk involved in trading. Any information and/or content is intended entirely for research, educational and informational purposes only and does not constitute investment or consultation advice or investment strategy. The information is not tailored to the investment needs of any specific person and therefore does not involve a consideration of any of the investment objectives, financial situation or needs of any viewer that may receive it. Kindly also note that past performance is not a reliable indicator of future results. Actual results may differ materially from those anticipated in forward-looking or past performance statements. We assume no liability as to the accuracy or completeness of any of the information and/or content provided herein and the Company cannot be held responsible for any omission, mistake nor for any loss or damage including without limitation to any loss of profit which may arise from reliance on any information supplied by Everest Fortune Group.
GOLDCFD trade ideas
GOLD 1H: Fibo speaks louder than words - $3365 in focusGold is testing the upper zone near $3362–3365, which is just above the 0.5 Fibonacci level ($3353) from the previous impulse. The price has already bounced from the top of the channel, indicating potential exhaustion of the current upward move.
Technicals:
- MA50 and MA200 are below the price — bullish trend intact
- RSI is cooling down from overbought territory
- Fibo 0.5 ($3353) was breached, but no clear confirmation yet
- Channel resistance remains unbroken
Plan:
- If price rejects $3365, targets are $3340 and $3314
- If price holds above $3365, next move could be toward $3377+
- EMA structure supports further upside, but caution is needed at this zone
Gold isn’t shouting - it’s whispering key levels. Listen closely.

XAUDUSD SELL LIMITSymbol: XAU/USD
Timeframe: 15 Minutes (15m)
Trade Direction: Short (Sell)
Exact Entry Price:
3,295.254
Entry Rationale: This point is located within the FVG (Fair Value Gap) and at the 78.0% Fibonacci level (Optimal Trade Entry - OTE zone), which has a high potential for a price reaction and attracting sell orders.
Exact Stop Loss:
3,305.953
Stop Loss Rationale: This price is set slightly above the high of the bearish Order Block and also above the Swing High at 3,302.658 to protect the trade from a potential liquidity grab (Stop Hunt).
Exact Take Profit (TP1):
3,270.916
Take Profit Rationale: This target is set at the recent low. This area acts as a sell-side liquidity pool and is the next logical target for the price after pulling back to the supply zone.

GOLD BUY In the XAU/USD 2025 Forecast, FXStreet analyst Eren Sengezer suggests Gold’s 2025 outlook depends on Federal Reserve (Fed) policy, Donald Trump’s decisions and geopolitics. A bearish scenario could unfold if geopolitical tensions ease, inflation remains persistent and United States-China trade tensions weaken China’s economy, reducing Gold demand. A hawkish Fed could also pressure prices.
On the bullish side, continued global policy easing, a recovering Chinese economy or escalating geopolitical conflicts could boost safe-haven flows into Gold, supporting its resilience and pushing prices higher.
Gold's technical outlook suggests weakening bullish momentum, with the RSI at its lowest since February and XAU/USD. Key support lies at $2,530-$2,500, with further declines potentially targeting $2,400 and $2,300. On the upside, resistance at $2,900 could limit gains, with additional barriers at $3,000-$3,020 and $3,130 if Gold attempts a new record high.
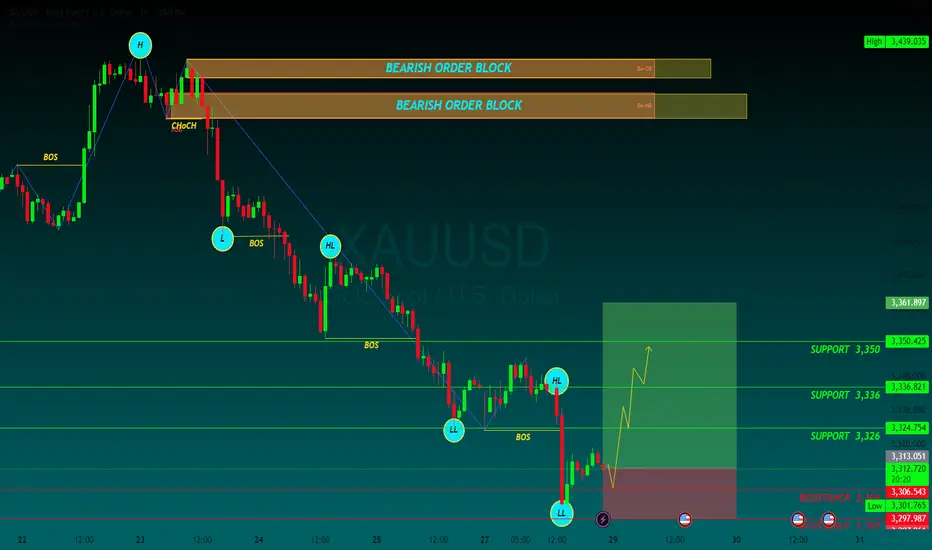
SUPPORT 3,326
SUPPORT 3,336
SUPPORT 3,350
RESISTANCE 3,306
RESISTANCE 3297
Gold: dropped on trade deals The safe-haven asset had its ups and downs during the previous week. The week started with an uptrend, where the price of gold reached its highest weekly level at $3.430, on trade tariff tensions. However, the deal made between the US and Japan, pushed the price toward lower grounds, ending the week at $3.340. In addition, Friday's drop was supported by announced tariffs negotiations between the US and EU in Scotland during the weekend.
The RSI dropped below the level of 50 on Friday, ending the week at the level of 48. The MA50 slowed down its divergence from MA200, however, the potential cross is still far away. Still, weekly lows of the price of gold found support at MA50 levels.
The week ahead brings several currently very important US macro data, including JOLTs, PCE, NFP and Unemployment data. In addition, the FOMC meeting will be held where the market will receive the latest Fed's view on economic developments in the country and future expectations. Also, further news on trade tariff agreements, especially regarding ongoing negotiations between the EU and the US in Scotland, might make an impact on investors sentiment for safe-haven assets. As per current charts, the price of gold might revert a bit to the upside, after a drop during the last three days of the previous week. In this sense, the resistance level at $3,4K might be tested. On the opposite side, the situation on charts is a little bit tricky. Namely, there is a line which perfectly connects all lows from February this year. Friday's closing was exactly at this line, which again adds to the probability of a short reversal. However, if, in any case, the price of gold breaks this longer term trend, then it will indicate that the longer path to the downside is in store for gold.

Excellent Profit on my Selling ordersAs discussed throughout my Friday's session commentary: "My position: I am Highly satisfied with recent results and will take early weekend break (no need to Trade more). If however you decide to Trade today, Sell every High's on Gold / no Buying until Monday's session (my practical suggestion)."
I have successfully re-Sold Gold from #3,338.80 with set of Selling orders, first batch I have closed around #3,327.80 Support for the fractal and second batch on #3,320.80 / another Support in extension / Highly satisfied with my Profits. I was aware that if Gold invalidates #3,318.80 Support / #3,310.80 extension can follow my Profit was already great to allow myself to Risk more which can backfire anytime.
Technical analysis: Not a bad start of the Trading week overall as the Price-action followed yesterday's session Gravestone Doji reversal formation into series of Bearish Hourly 4 chart’s candles, Gold is settling for a new Higher Low’s within former Hourly 4 chart’s Descending Channel. Despite this, the Weekly (#1W) candle remains on a (# -1.83%) and mostly Bearish values on my instruments. Daily chart continues to pile heavy Selling pressure on Gold so Technically my Short positions will see their value. The current Price-action is exactly on the Higher Low’s Upper zone as there is significantly more potential on the downside and as a results I do expect #3,300.80 psychological benchmark test as current decline is directly correlated with uptrend extension on DX (# +1.03%) and will most likely close the week in green values.
My position: I will continue re-Sells starting with #3,332.80 Resistance and my continuation will be re-Sell every High's on Gold unless Gold closes the market above #3,352.80 benchmark.

GOLD - Near Current Resistance? holding or not??#GOLD... so market perfectly holds our expected bottom and bounced back and now market just near to his current Resistance region.
that is around 3328 to 3332
keep close that region because if market hold it in that case we can see again drop towards our ultimate support 3310
NOTE: we will go for cut n reverse above 3332 on confirmation.
good luck
trade wisely
NFP ON DECK TODAY Gold is currently holding the Range of 3275-3310.
What's possible scanarios we have?
we have NFP data on deck today, expect potential volatility.
Until the release, gold may continue to range between 3275 and 3315.
This trade is totally unexpected how can gold react on numbers.
•If the H4 & D1 chart breaks below 3270, we could see a further drop toward the 3250 zone.
• Ifthe H4 & D1 chart flips above 3310, we could see a further Upside climb the 3335 -3345 zone.
Stay alert. Key levels in play.
#XAUUSD

XAUUSD Weekly Outlook | $3,285 Key Level and Structure SetupHere’s my outlook on gold (XAUUSD) for the week of August 4–9, 2025.
Last week’s move was shaped by strong early dollar momentum, a 3% U.S. GDP report midweek, and Friday’s sentiment shift after the surprise tariff announcement.
Price is now sitting near the $3,380 supply zone, a structure that’s been in play since April. I highlight:
✅The key demand zone ($3,245–$3,285)
✅The broken descending trendline is now acting as support
✅Potential reaction around $3,360 early in the week
✅$3,285 remains my key level going forward. If ever price comes close, I’m watching for signs of strength or breakdown there to guide my setups.
I’ll update my thoughts in the comments as price action unfolds.
Disclaimer:
Based on experience and what I see on the charts, this is my take. It’s not financial advice—always do your research and consult a licensed advisor before trading.

XAUUSD SELL Don’t Miss This MoveAnalyzing market structure and liquidity using Price Action and Smart Money Concepts. Focuse
d on key supply/demand zones and institutional order flow


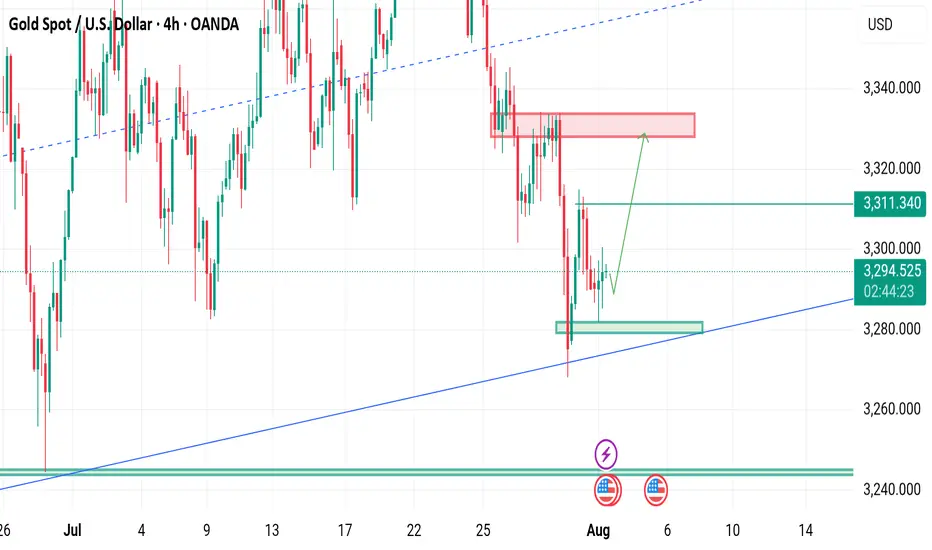
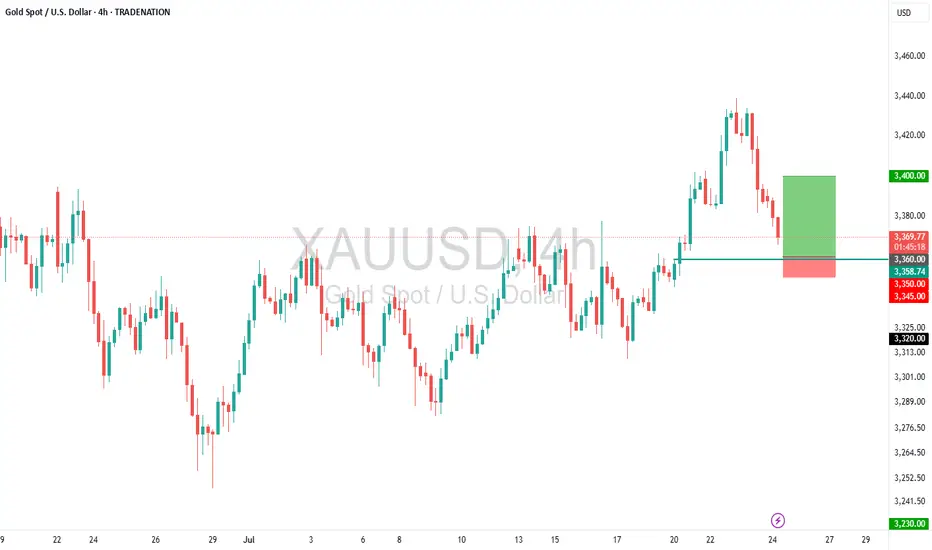
Gold (XAUUSD) – Buy the Dip Toward Key SupportTrade Idea
Type: Buy Limit
Entry: 3360.00
Target: 3400.00
Stop Loss: 3350.00
Duration: Intraday
Expires: 25/07/2025 06:00
Technical Overview
The primary trend remains bullish, supported by recent price structure and sentiment.
Price is correcting lower, and is approaching Fibonacci retracement support at 3360.00.
A Buy Limit at 3360.00 aligns with bespoke support and offers a low-risk entry opportunity.
The target at 3400.00 is modest but achievable within the current intraday cycle
Upcoming Events to Watch
24/07/2025 at 14:45 – S&P Global Manufacturing & Services PMIs (US) could add volatility and act as a catalyst for a reversal from support.
Key Technical Levels
Resistance: 3400.00 / 3420.00 / 3435.00
Support: 3360.00 / 3340.00 / 3320.00
Disclosure: I am part of Trade Nation's Influencer program and receive a monthly fee for using their TradingView charts in my analysis.
XauusdThe market structure is bearish, but there is a possibility of a price increase to remove liquidity from traders.

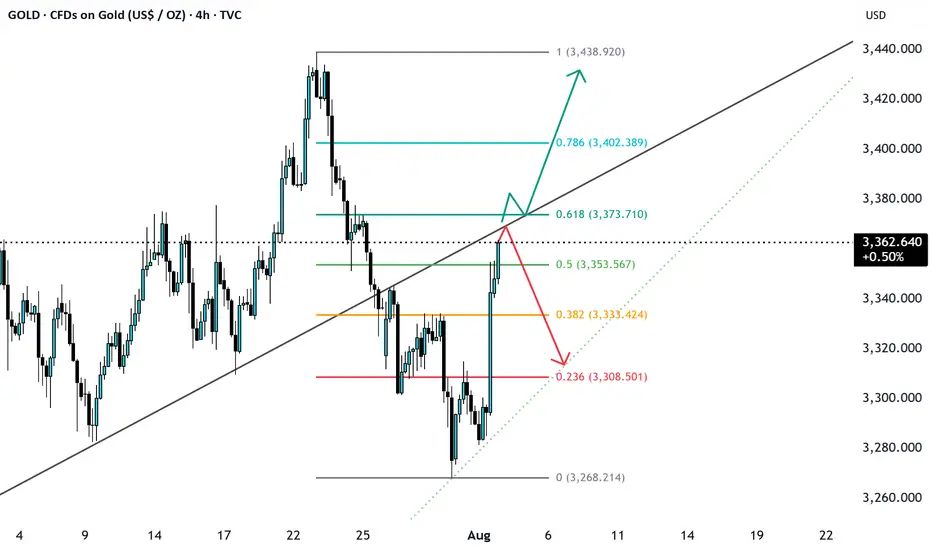
Gold at major resistance and at fib 0.618 level breakout ? Gold after breaking the support, now again reached the support level which will be its resistance now, will it break it or get rejected form here. Enter the long only on breakout and retest till then its bearish trend.
Gold Slips After Powell Speech Below 3320 Bearish Pressure BuildGOLD Overview
Market Context:
Gold declined from the 3333 level, as anticipated in yesterday’s analysis, ahead of Fed Chair Powell’s speech. Powell reiterated that it is still too early for rate cuts, citing persistently high inflation, which supported the U.S. dollar and pressured gold.
Technical Outlook:
As long as gold trades below the 3320–3310 zone, the bearish momentum is expected to continue, with the next target at 3285. A confirmed break and stability below 3285 could open the way toward 3255.
To regain bullish traction, the price must stabilize above 3320.
Support Levels: 3285 • 3255
Resistance Levels: 3333 • 3349

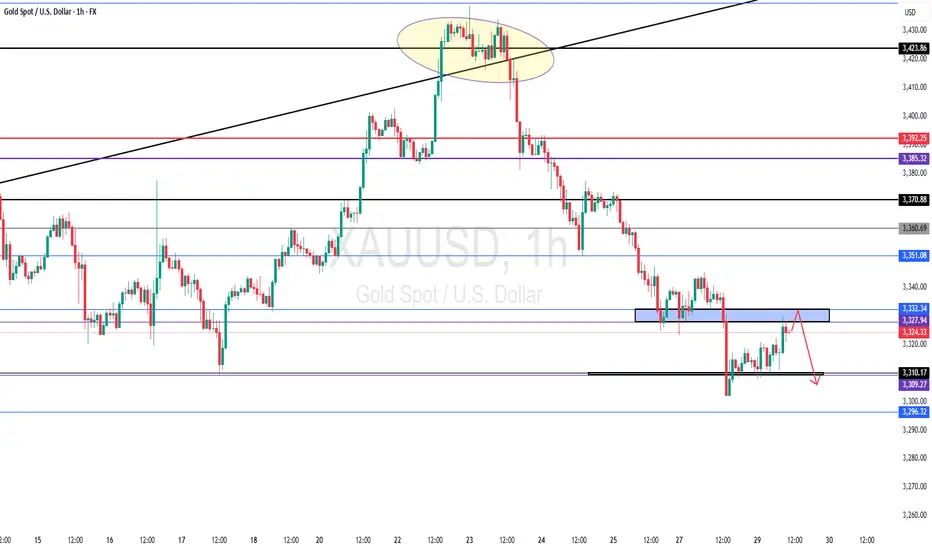
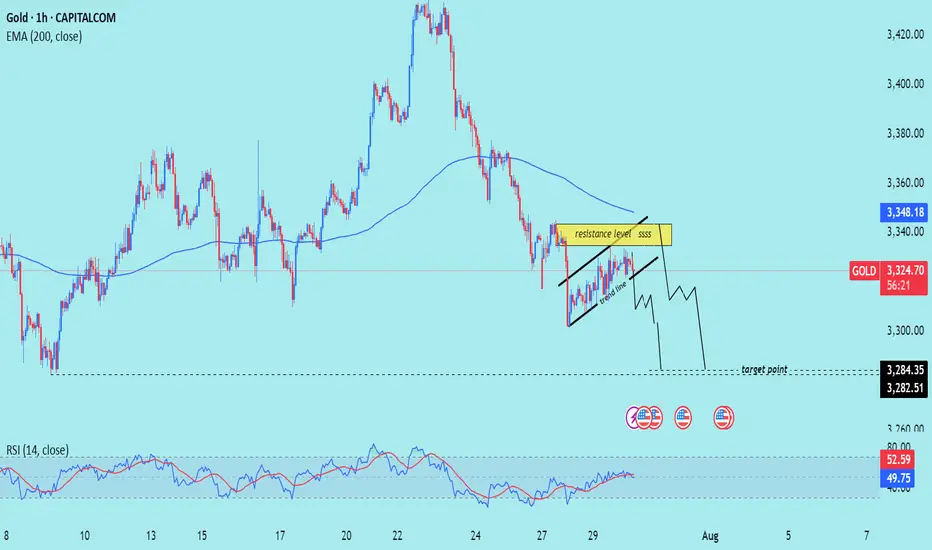
XAU/USD) Bearish Trend Read The captionSMC Trading point update
Technical analysis of Gold (XAU/USD) on the 1-hour timeframe, using a combination of trend lines, EMA, RSI, and price structure.
---
Technical Breakdown:
1. Price Structure:
Gold is forming a rising channel (black trend lines) within a short-term uptrend, but this is happening below the 200 EMA, which generally indicates bearish momentum.
A resistance zone is highlighted near the top of the channel, suggesting sellers might defend this level.
2. Key Level:
Resistance Level: Around 3,330–3,335 zone.
Target Point: Price is expected to break down from the channel and reach support levels near 3,284.35 and 3,282.51.
3. Moving Average (EMA 200):
Current price is below the 200 EMA (3,348.42), reinforcing a bearish bias.
4. RSI (14):
RSI is near 52.58, indicating neutral-to-slightly-overbought territory. No strong divergence is visible, but RSI is not confirming a bullish trend either.
5. Projection (Hand-drawn Path):
The drawn path shows a potential breakdown from the channel with a bearish impulse targeting lower support zones.
Mr SMC Trading point
---
Trade Idea Summary:
Bias: Bearish
Confirmation Needed: Break below channel support
Entry Zone: Near the resistance of the rising channel (~3,330–3,335)
Target Zone: 3,284.35 – 3,282.51
Invalidation: Sustained break above 3,348 (above EMA 200)
plesse support boost 🚀 this analysis)
Continued recovery, positive after NFP news✍️ NOVA hello everyone, Let's comment on gold price next week from 08/04/2025 - 08/8/2025
⭐️GOLDEN INFORMATION:
Gold prices surged over 1.5% on Friday, climbing toward $3,350, as a weaker-than-expected U.S. Nonfarm Payrolls (NFP) report signaled a faster-than-anticipated slowdown in the labor market. Heightened geopolitical tensions between the U.S. and Russia further boosted safe-haven demand for the precious metal.
Following the disappointing July jobs data, markets began pricing in a potential interest rate cut by the Federal Reserve. While the Unemployment Rate held relatively steady, signs of labor market softness supported recent comments from Fed officials Michelle Bowman and Christopher Waller, who advocated for a 25-basis-point rate cut at the July 29–30 meeting.
Additional data added to the cautious sentiment: the ISM’s July report confirmed that U.S. manufacturing activity remains in contraction territory, while consumer confidence took a hit, according to the University of Michigan’s latest survey.
⭐️Personal comments NOVA:
Gold prices continue to be positively affected after last week's NFP news, market expectations of an early rate cut are rising
🔥 Technically:
Based on the resistance and support areas of the gold price according to the H4 frame, NOVA identifies the important key areas as follows:
Resistance: $3384, $3434
Support: $3331, $3307, $3268
🔥 NOTE:
Note: Nova wishes traders to manage their capital well
- take the number of lots that match your capital
- Takeprofit equal to 4-6% of capital account
- Stoplose equal to 2-3% of capital account
- The winner is the one who sticks with the market the longest

Market Expectations for Gold (XAU/USD)Gold is currently in a very critical zone, and in my view, it has room to rise toward the 3339–3345 level.
Once that zone is touched, I expect another drop to follow.

XAUUSD: Market Analysis and Strategy for July 31stGold Technical Analysis:
Daily chart resistance: 3351, support: 3250
4-hour chart resistance: 3335, support: 3270
1-hour chart resistance: 3315, support: 3290.
Gold was trading sideways between 3320 and 3333 yesterday before the New York market. During the US trading session, the release of US ADP employment figures and PCE price data was bearish for gold, causing it to plummet below Monday's low of 3301. The Federal Reserve held interest rates steady, and Powell's hawkish speech sent gold plummeting to around $3268.
Affected by the news, gold prices fell rapidly yesterday, reaching a low near the lower Bollinger band on the daily chart. It rebounded in the Asian session today, reaching a high near 3315. Selling is recommended in the sideways range between 3310 and 3320. The US PCE data will be released in the New York market, so avoid the news release period.
BUY: near 3290
SELL: near 3270

GOLD Forming Bullish Pattern Read DescriptionGold is showing bullish momentum after a weaker-than-expected NFP report, which undermines the USD strength and increases demand for safe-haven assets like gold. With softer labor data, the market is now pricing in potential Fed rate cuts in the coming months, supporting upside pressure on gold.
Technical Analysis:
Price has respected the support zone and is now forming a bullish structure. If price holds above 3362, bullish momentum is expected to continue a Next targeting 3400 and 3419 – Strong resistance zone from recent highs
You May find more details in the chart.
Trade wisely best of luck Buddies.
Ps: Support with like and comments for better analysis.

XAUUSD Short1. Market Structure Overview
The overall market structure on this 15-minute chart is bearish. A clear Break of Structure (BOS) occurred at $3,307.765, confirming that previous support failed and sellers are in control. After the BOS, price formed a lower high near $3,328, maintaining bearish momentum and setting the stage for potential continuation downward.
2. Supply & Demand Zones
The chart reveals two notable supply zones where sellers have been active. The first is a minor zone just above the current price, which has already triggered a rejection and shows signs of short-term bearish control. The second, positioned higher, marks the origin of a strong sell-off and represents a significant resistance level. On the demand side, the closest support zone lies just beneath the current price, but it appears weak due to prior tests. A stronger demand zone is located further down, where price previously saw an aggressive bullish reaction, indicating solid buyer interest. If bearish momentum continues, price may drop even lower into a deeper liquidity pocket—an area likely to attract strong institutional buying.
3. Price Action within the Current Region
Price is currently hovering around $3,325, inside a narrow range between the minor supply and weak local demand. After rejecting the upper supply zone, price is showing bearish intent. If the market maintains this rejection pattern, a drop toward the $3,293–$3,301 demand area is likely. This zone is expected to offer a bounce or at least temporary reaction due to the strong response seen there previously.
4. Trade Bias & Plan
The active bias is bearish. Short opportunities are favored while price remains below $3,328. Ideal short entries are from the rejection of the minor supply zone, targeting $3,301 and possibly $3,293. A clear break and hold above $3,329 would invalidate the short bias and shift focus toward higher liquidity levels. Until then, structure supports downside continuation.
5. Momentum & Confirmation
Momentum is currently favoring sellers. The lower highs and strong rejections near supply reinforce the bearish bias. Confirmation for continuation comes from bearish engulfing candles and sharp rejections from supply zones. A clean break below the nearest demand zone would further validate the move toward deeper targets.

XAUUSD OUTLOOK BEARISH MOVE POSSIBLE 4/8/2025 XAUUSD Bearish Trade
Sell: $3363 → Hit: $3345
+180 pips secured – next target: $3335
Clean move, no noise
#XAUUSD #IntradaySell #GoldTrade
