XAUUSD OUTLOOK BEARISH MOVE POSSIBLE 4/8/2025 XAUUSD Bearish Trade
Sell: $3363 → Hit: $3345
+180 pips secured – next target: $3335
Clean move, no noise
#XAUUSD #IntradaySell #GoldTrade
GOLDCFD trade ideas

XAUUSD Short1. Market Structure Overview
The overall market structure on this 15-minute chart is bearish. A clear Break of Structure (BOS) occurred at $3,307.765, confirming that previous support failed and sellers are in control. After the BOS, price formed a lower high near $3,328, maintaining bearish momentum and setting the stage for potential continuation downward.
2. Supply & Demand Zones
The chart reveals two notable supply zones where sellers have been active. The first is a minor zone just above the current price, which has already triggered a rejection and shows signs of short-term bearish control. The second, positioned higher, marks the origin of a strong sell-off and represents a significant resistance level. On the demand side, the closest support zone lies just beneath the current price, but it appears weak due to prior tests. A stronger demand zone is located further down, where price previously saw an aggressive bullish reaction, indicating solid buyer interest. If bearish momentum continues, price may drop even lower into a deeper liquidity pocket—an area likely to attract strong institutional buying.
3. Price Action within the Current Region
Price is currently hovering around $3,325, inside a narrow range between the minor supply and weak local demand. After rejecting the upper supply zone, price is showing bearish intent. If the market maintains this rejection pattern, a drop toward the $3,293–$3,301 demand area is likely. This zone is expected to offer a bounce or at least temporary reaction due to the strong response seen there previously.
4. Trade Bias & Plan
The active bias is bearish. Short opportunities are favored while price remains below $3,328. Ideal short entries are from the rejection of the minor supply zone, targeting $3,301 and possibly $3,293. A clear break and hold above $3,329 would invalidate the short bias and shift focus toward higher liquidity levels. Until then, structure supports downside continuation.
5. Momentum & Confirmation
Momentum is currently favoring sellers. The lower highs and strong rejections near supply reinforce the bearish bias. Confirmation for continuation comes from bearish engulfing candles and sharp rejections from supply zones. A clean break below the nearest demand zone would further validate the move toward deeper targets.

Bullish Momentum Ahead? XAAUSD Price to Watch!The market just closed above 3,353 , which is our BOS and RBS level. It was previously a resistance, then became support, and now it's being tested as resistance again. Looking at how gold moved last week, it came really close to the major resistance area I had marked. Unfortunately, it didn’t quite reach my pending order, which was set just a bit lower.
After reviewing the price action, I noticed that gold reacted to an order block before making its move upward. Luckily, we managed to catch a nice HnS sell setup & the golden zone fibo I had marked earlier, using my trusted golden Fibonacci levels. They’ve consistently delivered reliable entries.
Looking ahead to the upcoming week, I’ll be using the same golden fibo setup. The market is showing a clean pattern, and I’ve already mapped out a solid entry zone. The zone is fairly wide, but with proper risk management and entry layering, there’s definitely good potential for profit .
Let’s see how things play out next week. That’s all from me for now. If you found this helpful, feel free to like and follow for more analysis.

DAILY SCALPING PLAN | CLINTON SMC STYLE✅ XAU/USD - DAILY SCALPING PLAN | CLINTON SMC STYLE
📆 Date: August 1st, 2025
📍 Strategy: Smart Money Concepts (SMC)
🔑 Focus: Liquidity Sweep | Order Block | BOS | Premium/Discount Model
🔍 Market Overview
Gold (XAU/USD) is currently in a manipulation phase after a strong move down from a premium supply zone. The market has swept key liquidity and is preparing for a high-probability move in both directions based on Smart Money footprints.
Current structure suggests:
Bullish intent forming from a discount demand zone.
Liquidity resting above recent highs – perfect for short-term scalps and intraday swings.
🟢 BUY SETUP – DISCOUNT DEMAND REACTION
🎯 Entry: 3275
🛡️ Stop Loss: 3268
🎯 Take Profits:
TP1: 3285
TP2: 3295
TP3: 3305
TP4: 3315
TP5: 3325
TP6: 3335
Reasoning:
This is a clean bullish OB resting beneath a CHoCH and BOS zone. Price may wick into this area as Smart Money reloads after sweeping early long positions. If held, expect sharp upside expansion toward previous liquidity highs.
🔴 SELL SETUP – PREMIUM SUPPLY REJECTION
🎯 Entry: 3356
🛡️ Stop Loss: 3362
🎯 Take Profits:
TP1: 3350
TP2: 3345
TP3: 3340
TP4: 3330
TP5: 3320
Reasoning:
This level is a key supply block where price previously distributed. If price expands into this zone, it’s likely to act as a liquidity magnet for Smart Money to offload longs and enter short-term shorts. Expect reaction.
🧠 SMC Insights
Internal BOS & CHoCH signal early signs of accumulation.
Price respects the premium vs. discount framework with clear liquidity targets.
SMC traders understand that price doesn’t move randomly – it targets liquidity, mitigates OBs, and respects structure.
🔔 Note:
Always wait for clear confirmation (rejection wick, engulfing pattern, or M15 structure shift) before execution. Entries without confirmation are riskier in current volatility.
📌 Follow @ClintonScalper for daily SMC scalping plans & deep institutional insight.
🔁 Like, comment & share if you find this helpful!
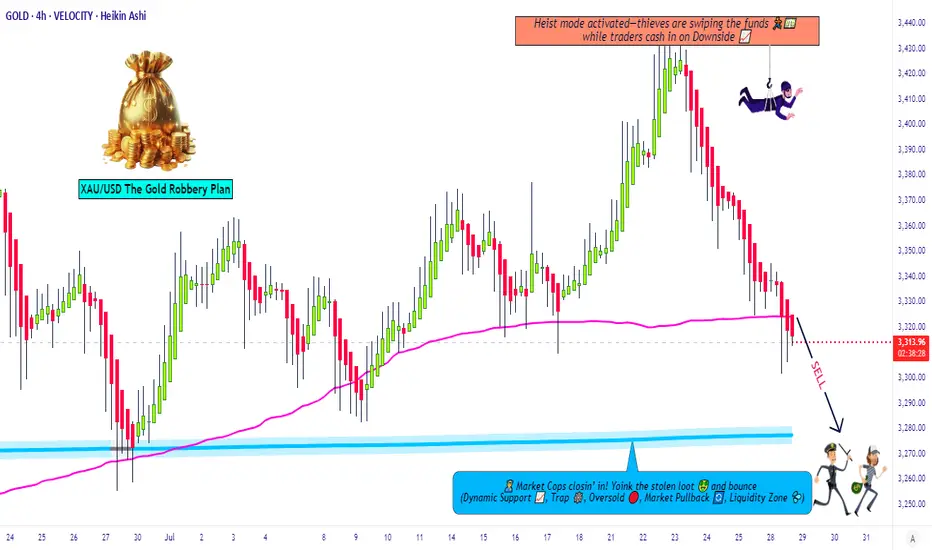
Gold Robbery Blueprint: Smart Bears on the Move Now!💣 XAU/USD GOLD HEIST PLAN: Robbery Begins at Resistance Zone! 🔐💰
🌟Hi! Hola! Ola! Bonjour! Hallo! Marhaba!🌟
Dear Money Makers & Market Robbers, 🕵️♂️💸🚀
Welcome to another strategic strike by Thief Trading Style™—where smart analysis meets bold execution. We're targeting XAU/USD (Gold) in this scalping/day-trade opportunity, primed with fundamentals, technicals, and pure robbery logic.
🔍 THE GAME PLAN
We're looking at a neutral zone turning bearish, and here’s how the robbery unfolds:
🔑 ENTRY POINTS
🎯 “Vault wide open” signal!
Initiate short orders at current price zones or set layered SELL LIMITS near swing highs on 15M/30M charts. We're running a DCA-style pullback entry for max loot.
🕵️♀️ Entry isn't about one shot—it's about precision raids.
🛑 STOP LOSS: THE ALARM SYSTEM
Set SL just above the nearest swing high (4H timeframe preferred).
Use candle wick tips as your defense line (Example: 3350.00).
Adjust SL based on risk appetite and number of orders stacked.
🎯 TARGET: THE GETAWAY PLAN
💸 First Vault: 3280.00
💨 Or escape earlier if price action signals reversal. Protect your gains. Professional thieves don't get greedy.
📊 WHY WE’RE ROBBING HERE
This level is a high-risk barricade zone—police aka "market makers" are strong here.
We spotted consolidation, oversold signals, trend reversal setups, and a bullish trap disguised as support. A perfect time to strike. 🧠🔍
📰 FUNDAMENTAL & SENTIMENTAL CHECKPOINTS
🔎 Stay updated with:
Global news drivers
Macro & Intermarket analysis
COT reports & future trend targets
👉 Check the 🔗🔗🔗
⚠️ TRADING ALERT - STAY SAFE DURING NEWS BOMBS!
Avoid entries during major economic data releases.
Use trailing SL to protect running profits.
Monitor volatility spikes & price anomalies.
💖 JOIN THE CREW, BOOST THE HEIST!
If this plan adds value to your trades, hit that Boost Button 💥
Support the Robberhood and help grow the gang of smart money snipers 🕶️💼💣
Every boost = more ammo for next mission. Let's rob the market—not each other. 🚀🤑
📌 Remember: Market is fluid. Stay sharp, adapt quick, and trade like a shadow.
Catch you soon in the next grand heist 🎭💼
#XAUUSD #GoldTrade #ScalpingStrategy #DayTrading #ThiefTrader #RobTheMarket #BoostForMore #NoChaseNoCase
Selling activated ▪️I'm expecting selling at 3345-3348 from my zones although I took a small risk of sell at 3342
And my Targets will be 3333-3324
▪️Secondly if H4 candle closing below 3250 I will not sell till next stability
This trade is based on liquidity sweeps
#XAUUSD
Gold next move (Read Description). Hello, Traders.
As we achieved more than 400 pips on last trade, Now I’m back with new idea for next move.
As you can see the gold is dropping since last few days.
Now the trend is bearish according Higher Time Frames and Bullish trend in Lower Time Frames, We will have to follow the Higher Time Frames to find the next move.
The market is creating the trend line buy according to H1,M30 and also respecting the trend line.
Keep in mind the trend is bearish, the gold will drop.
If the price doesn't breaks the 3347, then next move will be around 3284. If the price breaks the 3347 then gold will fly, trend will be change.
Kindly share your ideas and drop positive comments, Thanks.

Excellent re-Sell opportunities from #3,332.80 ResistanceAs discussed throughout my yesterday's session commentary: "My position: I will continue re-Sells starting with #3,332.80 Resistance and my continuation will be re-Sell every High's on Gold unless Gold closes the market above #3,352.80 benchmark."
Firstly I have Sold Gold on #3,321.80 with my set of Selling orders and in addition I have added Sells at #3,318.80 / closing all on #3,312.80 / first line of wall of Supports ahead of #3,300.80 benchmark. Then I have planned to re-Sell strong on #3,332.80 with Double Lot and closed my order on #3,322.80 (#3,332.80 - #3,322.80) which delivered excellent results. I am making spectacular Profits from my key reversal zones.
Technical analysis: Gold is Trading within my predicted values however both sides are equally probable at the moment. Needless to mention, Price-action is on important Short-term crossroads. Since #3,300.80 psychological benchmark isn't invalidated even with DX on extended relief rally, now Bullish reversal is possible towards #3,342.80 first Resistance, then #3,352.80 mark Trading above the fractal. Also #3,320.80 - #3,332.80 Neutral Rectangle Trading is possible until I have a break-out.
My position: My break-out points on both sides are calculated and ready to be used for more Profits.

Gold establishes bullish wave. Wait for recovery point to BUY✏️ OANDA:XAUUSD Nonfarm announcement has shaped a new trend for gold price. completely broke the previous bearish wave structures and formed a new bullish trend with the break of wave 1 peak around 3315. Trading strategy next week only focuses on BUY signals. Maybe this bullish wave can make gold reach the all-time high.
📉 Key Levels
Support 3333-3315
Resistance 3373-3416
BUY zone: 3333 ; 3315 ( Strong support zone)
BUY DCA trigger Break resistance 3373
Target 3416
Leave your comments on the idea. I am happy to read your views.

GOLD OUTLOOKMy view on Gold ..
More likely to retrace to the bearish PRZ from where i'll be looking for Sell setup on the lower time frames

GOLD BUY M15 Gold (XAUUSD) 15-Min Chart Analysis – July 31, 2025
The chart shows a clear bullish structure after a confirmed Change of Character (ChoCH) and Break of Structure (BOS) on the lower time frame. Price has broken above previous resistance zones, indicating strong buying momentum.
Entry Zone:
Price is currently retesting a demand zone (highlighted in pink).
Ideal buy entry was taken after the bullish ChoCH.
Stop Loss:
SL: 3397, placed just below the demand zone for risk protection.
Targets / Resistance Levels:
1. First Resistance: 3308
2. Second Resistance: 3311
3. Third Resistance: 3316
4. Final Target: 3325
Bias:
Bullish, expecting higher highs as long as price holds above the demand zone.
Break and retest strategy is forming, suggesting continuation toward the final target.

Buying GoldBought gold from here. Support is 3,280 based on Timeframe. Targeting the highs of 3,452
Tight stoploss @ 3,298
Put-Call Ratio is bullish.
COT Data on gold for the past 2 weeks continued to be bullish.

XAUUSD OUTLOOK BEARISH MOVE POSSIBLE 4/8/2025🔻 XAUUSD – Short-Term Bearish Bias
Key resistance at 3363–3370
Below this zone, expecting 3335 / 3325
Breakout failed – now watching for downside
#GoldAnalysis #XAUUSD #BearishStructure

Gold short opportunityGold completed its mini bull flag target and re-entered a micro rising channel, a potentially bearish structure.
With price now testing a key supply zone, we’re watching for rejection to initiate a short, targeting the major demand zone below.

XAUUSD Technical Analysis – Strong Bullish Move Expected XAUUSD Technical Analysis – Strong Bullish Move Expected from Support Zone
Date: July 29, 2025
Chart Type: Price Action | Smart Money Concept (SMC) | Volume Profile
🧠 Educational Breakdown:
1. Strong Support Zone (Demand Area):
Price has entered a clearly marked strong support zone around $3,270 - $3,292.
This zone has previously acted as a major demand level, where buyers stepped in to reverse bearish pressure.
High volume node from the Volume Profile on the left confirms significant historical interest in this price region.
2. BOS – Break of Structure:
Multiple Break of Structures (BOS) throughout the uptrend confirm bullish market intent.
The recent decline appears corrective, not impulsive, suggesting a potential bullish continuation.
3. Bullish Fair Value Gap (FVG):
A Bullish FVG is visible just above current price, acting as a magnet for price action.
This imbalance is often targeted before further market movement, supporting the idea of an upcoming bullish move.
4. Liquidity Grab Setup:
Price dipped into the support area likely to sweep liquidity (stop losses) before a reversal.
This is a common Smart Money trap, where institutional players grab liquidity before moving the market in the intended direction.
5. Target Zone:
A clear target is set around $3,418, aligning with previous highs and potential Buy-Side Liquidity.
The projected move represents a clean higher high, following the higher low formed at the support zone.
Confirmation: Wait for bullish engulfing or displacement candle on lower timeframe (M15-H1).
Volume Support: Look for rising volume during the reversal to confirm smart money participation.
📘 Conclusion:
Gold (XAUUSD) is showing a textbook bullish reversal setup from a high-demand zone. With strong structural support, fair value gap targeting, and buy-side liquidity above, the setup favors bullish continuation toward $3,418.

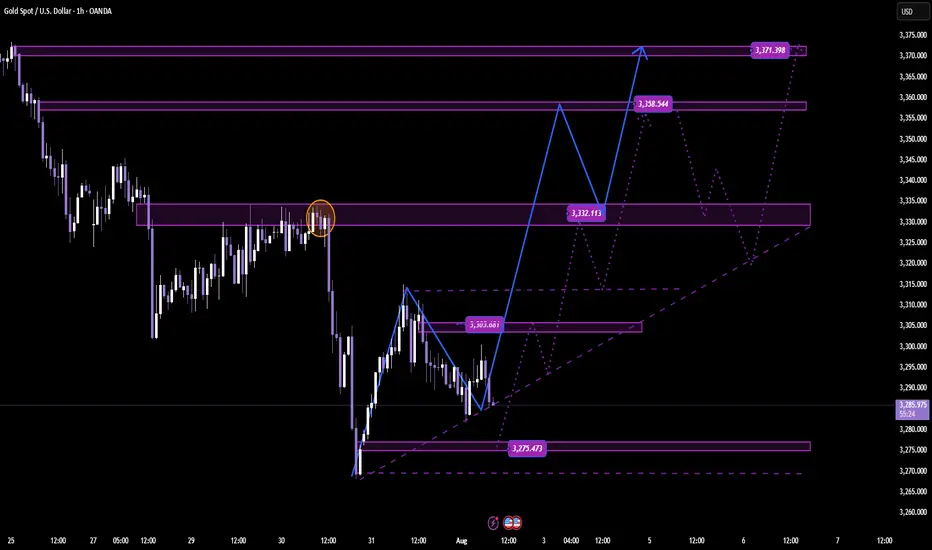
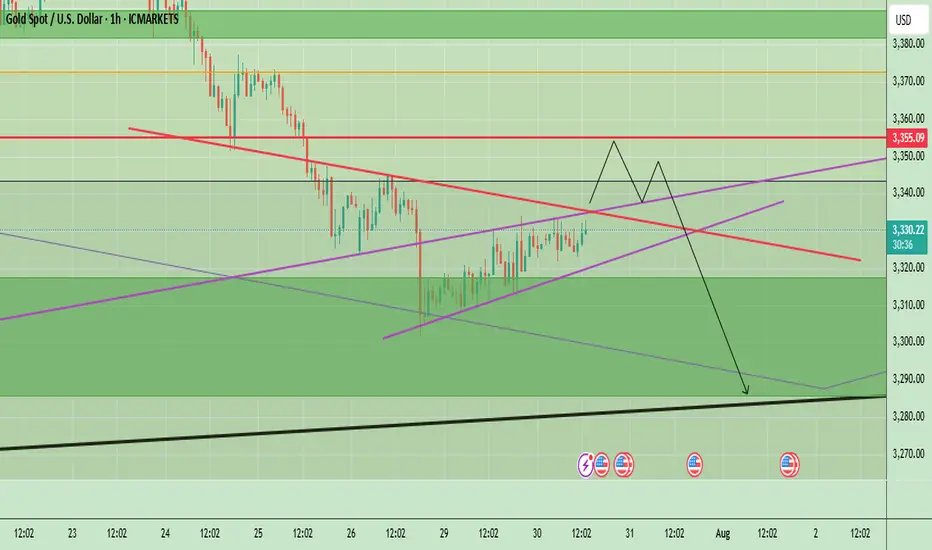
Gold Awaits Fed Rate Decision – Key Levels & Volatility AheadGold is currently trading near $3,332, showing a minor recovery after recent downward momentum. The price action on the 1-hour chart highlights a short-term ascending structure, which often acts as a corrective move rather than a strong bullish trend. The market previously saw significant selling pressure from above $3,355–$3,360, creating a short-term supply zone. Unless the price breaks and holds above this zone, the overall momentum remains bearish.
The chart also shows a projected price path where gold could push slightly higher toward $3,355, meet resistance, and potentially reverse downward again. Key support lies at $3,320, and if this breaks, we could see gold testing $3,290–$3,280 levels, aligning with the black trend line support. However, if bulls manage to break above $3,360, it would signal potential upside continuation toward $3,380–$3,400.
Key Points
- Key Resistance Levels: $3,355 and $3,360 (critical supply zone).
- Key Support Levels: $3,320 (short-term), followed by $3,290–$3,280 (major trendline support).
- Expected Short-Term Move: Possible push toward $3,355 → rejection → decline back toward $3,320 and possibly $3,290.
Bullish Breakout Scenario: A strong close above $3,360 could push price toward $3,380–$3,400.
Overall Bias: Bearish while trading below $3,360.
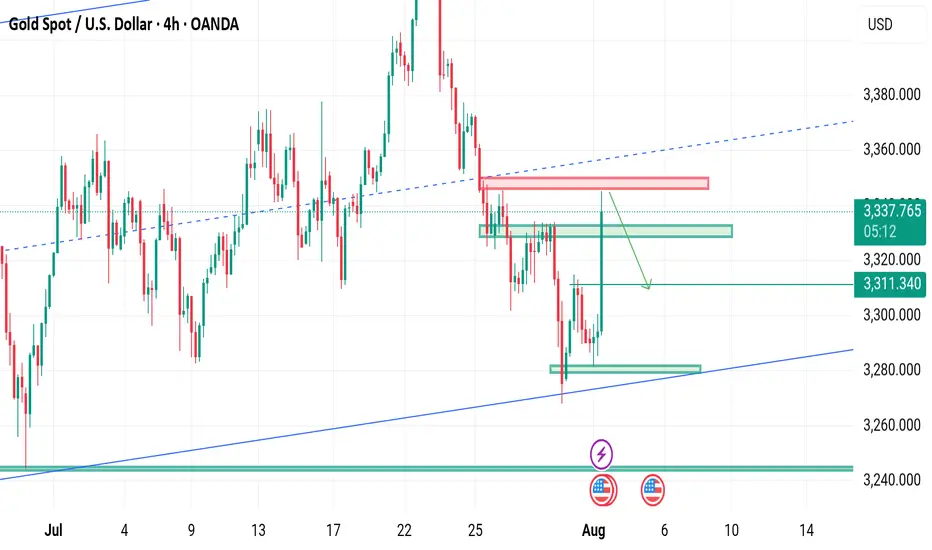
4hr Chart
Price remains under pressure below the descending trendline. A small pullback toward $3,345–$3,350 is possible, but as long as price stays under this resistance, the bias remains bearish with potential downside targets around $3,300–$3,280.
Key Levels:
- Resistance: $3,350 → $3,381 → $3,394
- Support: $3,324 → $3,281 → $3,254
Today’s FOMC interest rate decision is a key driver for Gold. Here’s the quick analysis:
- If Fed Hikes Rates or Maintains Hawkish Tone:
- Strong USD likely → Gold could face more selling pressure.
- Key support zones: $3,324 – $3,300, then $3,281 and $3,254.
- If Fed Pauses or Turns Dovish:
- Dollar weakens → Gold may bounce toward resistance zones.
- Upside levels: $3,355 – $3,360 and higher toward $3,381 – $3,394 (Fib levels).
Expect high volatility; $3,300 is a critical support to watch. A dovish Fed may give Gold short-term relief, but a hawkish stance could accelerate the downtrend.
Note
Please risk management in trading is a Key so use your money accordingly. If you like the idea then please like and boost. Thank you and Good Luck!
Gold 1H Intra-Day Chart 28.07.2025We saw a perfect move towards our $3,310 target, hitting our TP. What's next?
Option 1: Gold now moves higher into the $3,385 area, before we can determine the next major move.
Option 2: Gold drops lower towards $3,265 next.
Which scenario do you find more likely?

GOLD Bearish Breakout!
HI,Traders !
#GOLD is trading in a strong
Downtrend and the pair
Broke the key horizontal
Level around 3318.97 which
Reinforces our bearish
Bias and we will be
Expecting a further
Bearish move down !
Comment and subscribe to help us grow !

Sell xauusdGold recently breaks it's buy trend and retested it
Now looking for sell on h4 chart
This current level not much good for buyers

XAUUSD – Strong Bullish Reversal from Key Support XAUUSD – Strong Bullish Reversal from Key Support
Chart Summary:
Gold (XAUUSD) has shown a clear reaction from a strong support zone near 3260, suggesting bullish momentum is gaining strength. The chart highlights multiple key market structure elements and confirms the potential for a bullish move.
Technical Highlights:
🔻 Strong Support Zone (3260–3280):
Price tapped into a well-defined demand zone with historical significance, initiating a bullish response.
🔺 Resistance Zone (3460+):
A strong resistance level lies ahead. This area may act as a potential target for bulls.
🔁 Break of Structure (BOS):
Multiple BOS marks on the chart indicate trend shifts and liquidity grabs. Most recent BOS aligns with potential reversal.
💹 Bullish Fair Value Gap (FVG):
A bullish FVG near mid-structure confirms institutional interest and adds confluence to the upside move.
📈 Target: 3,366.984 USD
Marked as the next probable short-term liquidity target. If momentum sustains, price may approach resistance above this.
Price Expectation:
If the current bullish momentum holds above the strong support zone, we may see a rally towards 3,366–3,400 USD.
This move could be driven by:
Buy-side liquidity grab above prior highs
Breakout traders entering above BOS
Reaction to macroeconomic calendar (highlighted on the chart)
✅ Educational Takeaway:
This is a textbook example of:
Support-resistance flip
Liquidity concepts (Buy-Side Liquidity)
Fair Value Gaps usage
Volume Profile confluence

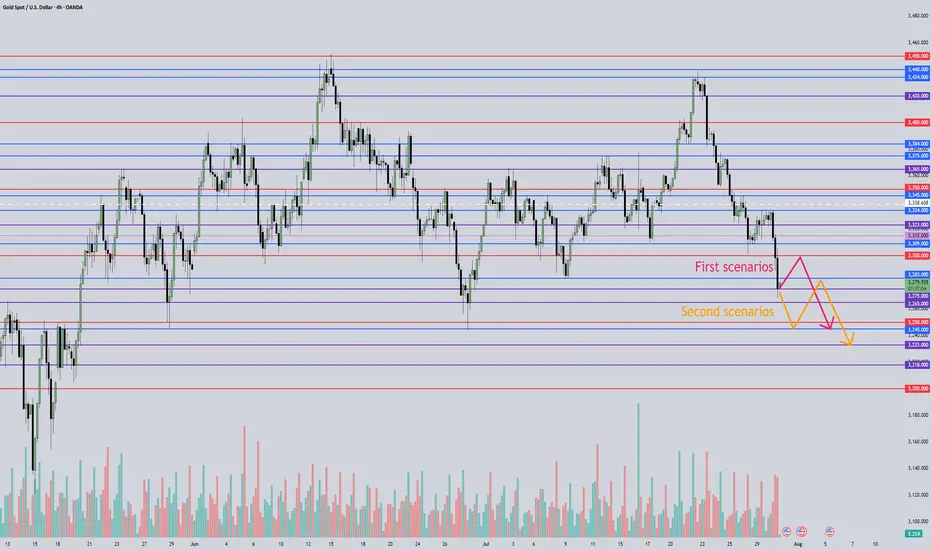
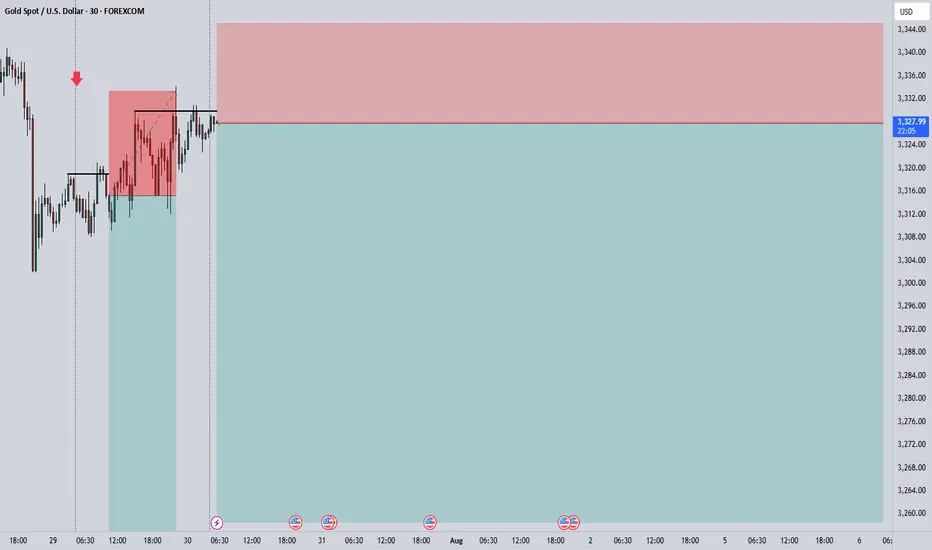
July 31, 2025 - XAUUSD GOLD Analysis and Potential OpportunitySummary:
The Fed held interest rates unchanged, and Powell’s remarks reduced the likelihood of a rate cut in September — this is fundamentally bearish for gold. Until new fundamental developments emerge, the strategy remains: sell on rallies into resistance.
After reviewing the 4H chart, I see two possible scenarios:
Price continues down to 3245, pulls back to 3283, then resumes the drop toward 3245 or even lower.
Price pulls back immediately toward 3300, then resumes the downtrend toward 3245.
These are ideal cases — I will still wait for clear confirmation before taking action.
🔍 Key Levels to Watch:
• 3323 – Resistance
• 3309 – Resistance
• 3300 – Psychological level
• 3283 – Key resistance
• 3268 – Short-term support
• 3260 – Support
• 3245 – Major support
• 3233 – Support
📈 Intraday Strategy:
• SELL if price breaks below 3268 → target 3265, then 3260, 3255, 3250
• BUY if price holds above 3283 → target 3289, then 3295, 3300, 3305
👉 If you find this helpful or traded using this plan, a like would mean a lot and keep me motivated. Thanks for the support!
Disclaimer: This is my personal view, not financial advice. Always use proper risk control.