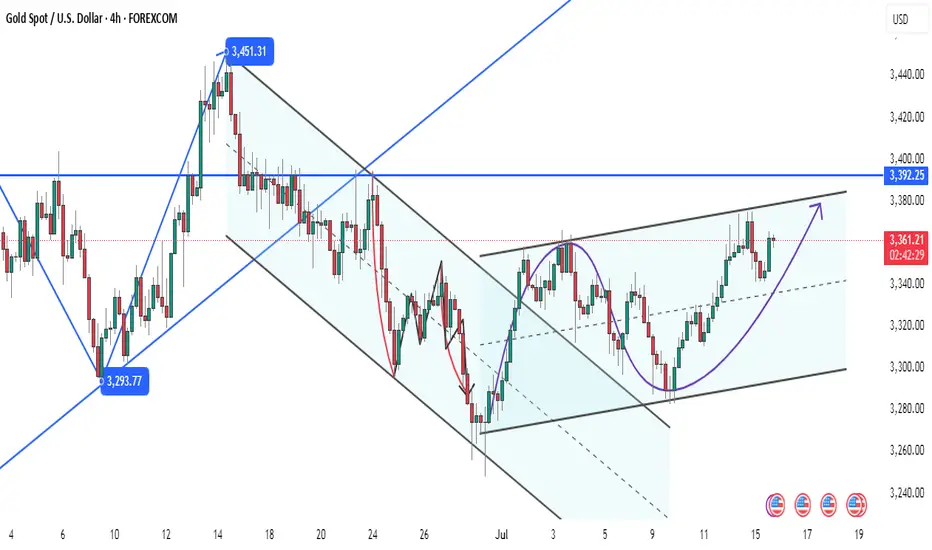
Latest Gold Price Update TodayGold prices today continue to maintain a short-term uptrend, driven by trade tensions and U.S. inflation data.
The weakening of the USD and the drop in U.S. Treasury yields have increased gold's appeal as a safe-haven asset. The trade tensions between the U.S. and the EU, along with new tariff measures, further boost the demand for gold.
Additionally, the U.S. PPI for June rose by 2.3%, lower than the forecast and May’s increase, suggesting that inflation could decrease in the future. The market expects the Fed to cut interest rates in September, weakening the USD and supporting gold's uptrend.
With factors like trade tensions, a weaker USD, and positive inflation data, gold prices may continue to rise. Investors need to closely monitor these factors to devise an appropriate strategy.
GOLDCFD trade ideas

Gold - 1 Hour Analysis (Long)After a series of dump , now we are seeing some bullish pattern. The most recent candle failed to close above 3375 , therefore I am anticipating the price will be targeting the SSL to continue higher.
I am anticipating that the price will move to the 4H OB , and I will be looking for bullish confirmation to enter the trade. Price may not reach to my target after mitigating the 4H OB , therefore manage the trade properly.
How I will take the trade?
If price is respecting the 4H OB , I will be taking multiple trades. For example , 1:2 or 1:3 along the way until it reach to my target. I will not be holding through the whole process.

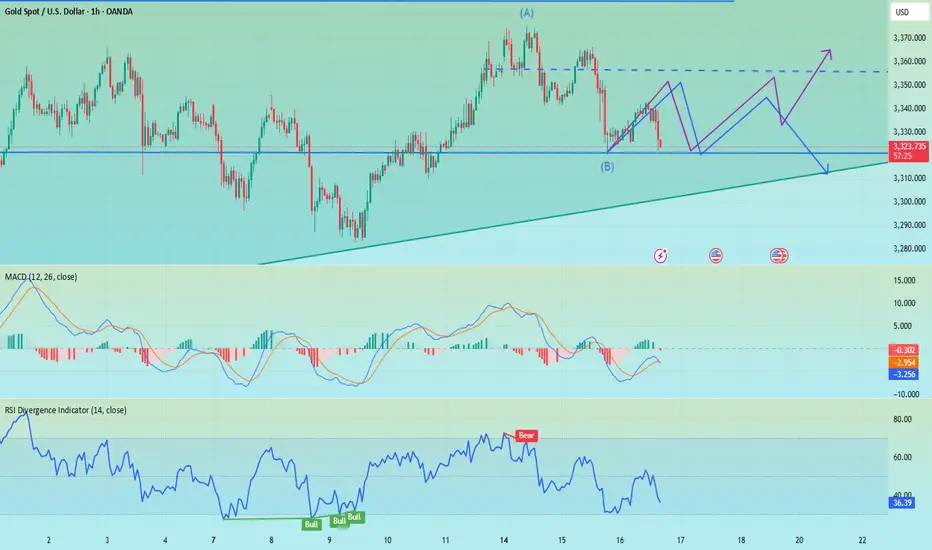
Analysis of 7.17 Gold Operation: Buy High and Sell LowYesterday, the trend of gold in the first half was quite regular. The rebound in the Japanese session was under pressure, and the European session continued to fall back to test the 3320 mark. The key here has been repeatedly emphasized yesterday. The gold market in the second half was more exciting. First, the news was released that Trump was ready to draft the dismissal of the Federal Reserve Chairman. Gold directly rose by 50 US dollars and broke through the recent high of 3375. Then he said that he had no intention of dismissing the Federal Reserve Chairman. Gold rushed up and fell back by 40 US dollars. The daily line finally closed with an inverted hammer pattern with a very long upper shadow line.
After the end of this pattern, today's market is still bearish. If the market is extremely weak, it will continue to fall below 3358. Pay attention to the attack and defense of the 3320 mark below. If it falls below, it will open the downward space to test the 3300 mark. During the day, we will temporarily set the small range of 3320-3358 to run, sell high and buy low, and retreat to 3325. One low long, defend yesterday's low, look up to 3335, 3342, 3358, and then reverse high.

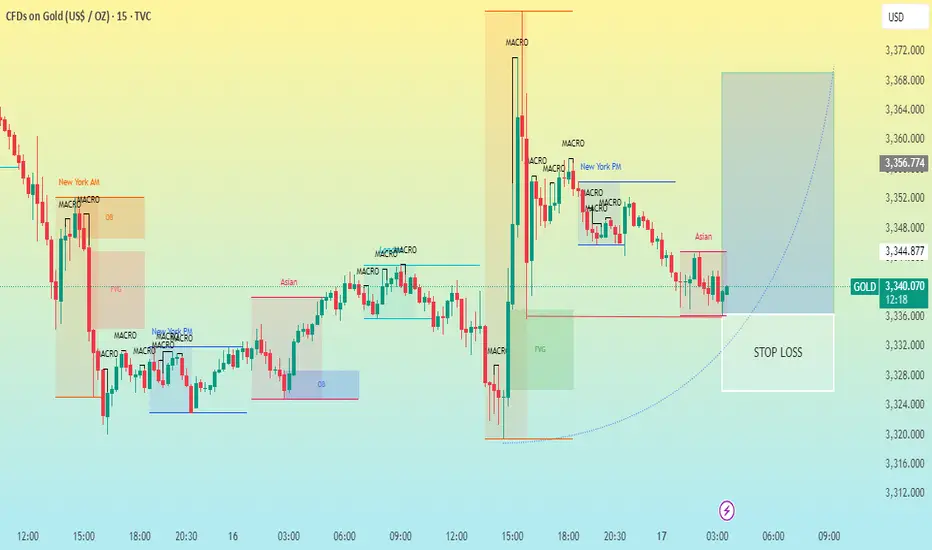
Gold (XAU/USD) 15-minute CHART PATTERNThis is a 15-minute chart of Gold (XAU/USD) with multiple trading concepts annotated. Here are the key elements:
Macro Levels: Several points are marked “MACRO,” likely denoting key market structure levels or significant order blocks.
Order Blocks (OB): Highlighted areas like the orange and blue boxes represent order blocks, potential zones where institutional buying or selling occurred.
Fair Value Gaps (FVG): The green and light red shaded areas signify imbalance zones in price action, where price may revisit to "fill" these gaps.
Sessions: "New York AM/PM" and "Asian" sessions are marked, showing session-based price behavior.
Stop Loss and Target Area: A clear buy setup is illustrated, with a stop-loss below the recent lows (around 3,330) and a projected upward price movement towards 3,360–3,370.
Interpretation:
This chart indicates a potential bullish setup from the current 3
XAUUSD H1 I Bearish Reversal Based on the H1 chart, the price is approaching our sell entry level at 3346.44, a pullback resistance.
Our take profit is set at 3308.43, an overlap support that aligns closely with the 78.6% Fib retracement.
The stop loss is set at 3375.07, a swing high resistance.
High Risk Investment Warning
Trading Forex/CFDs on margin carries a high level of risk and may not be suitable for all investors. Leverage can work against you.
Stratos Markets Limited (tradu.com ):
CFDs are complex instruments and come with a high risk of losing money rapidly due to leverage. 66% of retail investor accounts lose money when trading CFDs with this provider. You should consider whether you understand how CFDs work and whether you can afford to take the high risk of losing your money.
Stratos Europe Ltd (tradu.com ):
CFDs are complex instruments and come with a high risk of losing money rapidly due to leverage. 66% of retail investor accounts lose money when trading CFDs with this provider. You should consider whether you understand how CFDs work and whether you can afford to take the high risk of losing your money.
Stratos Global LLC (tradu.com ):
Losses can exceed deposits.
Please be advised that the information presented on TradingView is provided to Tradu (‘Company’, ‘we’) by a third-party provider (‘TFA Global Pte Ltd’). Please be reminded that you are solely responsible for the trading decisions on your account. There is a very high degree of risk involved in trading. Any information and/or content is intended entirely for research, educational and informational purposes only and does not constitute investment or consultation advice or investment strategy. The information is not tailored to the investment needs of any specific person and therefore does not involve a consideration of any of the investment objectives, financial situation or needs of any viewer that may receive it. Kindly also note that past performance is not a reliable indicator of future results. Actual results may differ materially from those anticipated in forward-looking or past performance statements. We assume no liability as to the accuracy or completeness of any of the information and/or content provided herein and the Company cannot be held responsible for any omission, mistake nor for any loss or damage including without limitation to any loss of profit which may arise from reliance on any information supplied by TFA Global Pte Ltd.
The speaker(s) is neither an employee, agent nor representative of Tradu and is therefore acting independently. The opinions given are their own, constitute general market commentary, and do not constitute the opinion or advice of Tradu or any form of personal or investment advice. Tradu neither endorses nor guarantees offerings of third-party speakers, nor is Tradu responsible for the content, veracity or opinions of third-party speakers, presenters or participants.

Gold trade short now 📉 Short Trade Signal – XAU/USD (15m Chart)
⚠️ Signal Type: Short
⏰ Timeframe: 15 minutes
📸 Chart Reference: Price consolidating after bullish impulse; resistance formed
🔽 Trade Details
Parameter Value
Entry (Sell) 3,345.00 (current level)
Stop Loss (SL) 3,368.00 (above recent high/resistance)
Take Profit (TP) 3,309.00 (demand zone / imbalance fill)

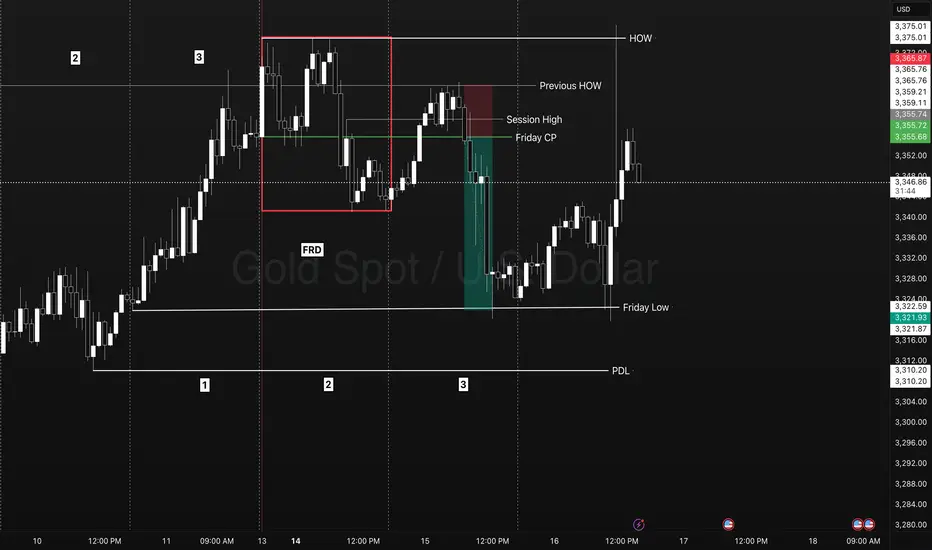
XAUSD - Using HOW levels for a break and retest!Identify what signal a market is showing you.
TYPES IOF SIGNAL DAYS
- First red/green day
- Dump/Pump
- Inside day
Frame the Trade play
- Reversal
- Continuation
Identify the Levels
- HOW/LOW
- Session High/LOW
- Friday Closing Price.
Trade Explanation
On the previous week FOREXCOM:XAUUSD triggered 3 days of breakout traders into the market closing in breakout. On Monday we have a FRD signal that sets up a next day trade opportunity. A retest of a previous weeks high gave us an indication of a retest/reversal trade on day 3 below Fridays closing price. Into the NY session this market quickly displaced back to Friday day 1 LOD level. Going into Tuesday day 2 we had the test of a weekly level and reversal above a session high closing below the Friday closing price. The break of a previous weeks high triggered more breakout traders into the market however it failed. We know day 2 typicall expands the range on Monday for a great parabolic trade setup right to as previous days low.
NO GUESSING, NO FOMO, NO FEAR, NO STRESS!
- Friday Closing Price (Entry)
- Previous HOW (Stop)
- PDL (Target)
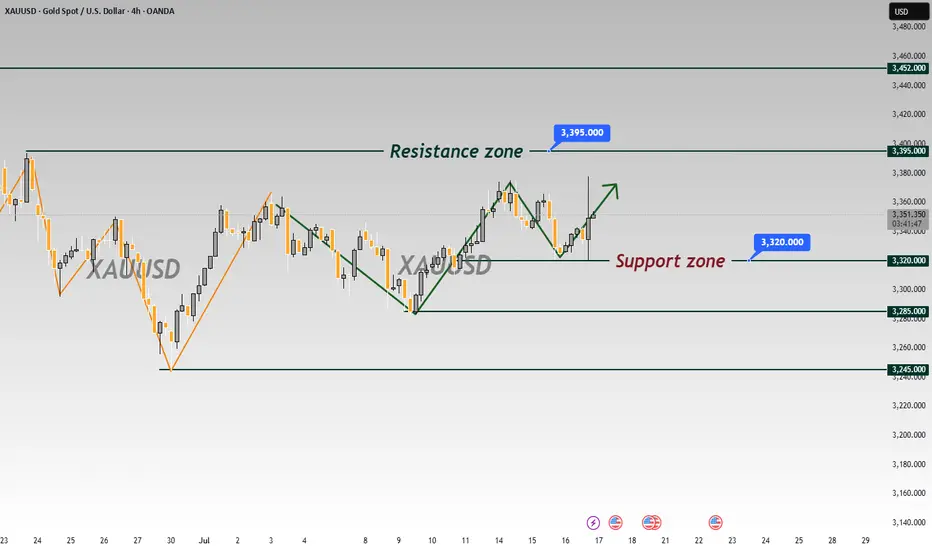
XAUUSD FALLING SOONGold now manages to leave behind the initial weakness and rapidly advances to the area of three-week peaks around the $3,380 mark per troy ounce as the US Dollar’s retracement gathers extra pace following another round of Trump-Powell effervescence.

Gold: Bull-Bear Swings & Today's Trade Tips + AnalysisAnalysis of Gold News Drivers:
During the U.S. session on Wednesday (July 16th), spot gold surged sharply and is currently trading around 3,370 🚀. Trump stated that tariff letters will soon be sent to small countries, with rates likely slightly above 10%, providing safe-haven support for gold prices 🛡️.
Gold prices fell 0.5% on Tuesday, closing at 3,324.68, barely holding above the 55-day moving average of 3,222 📉. Earlier, the U.S. June CPI increase hit its highest level since January, pushing the U.S. dollar index to a nearly three-week high, while U.S. Treasury yields also climbed to a six-week peak, pressuring gold prices ⚖️. The dollar index has risen for four consecutive trading days, hitting a high of 98.70 on Tuesday, the highest since June 23rd 🆙. A stronger dollar makes dollar-denominated gold more expensive for investors holding other currencies, thereby weighing on gold prices 💸.
However, the market largely interprets the dollar's recent rally as a technical adjustment rather than a reversal of the long-term trend 🔄. Despite short-term pullbacks in gold prices, market sentiment has not fully turned pessimistic 😐. While gold is currently in a consolidation range since mid-May, uncertainties surrounding tariff policies may offer support 🔀. Overall, the long-term outlook for gold remains optimistic, with sustained market focus on tariff issues expected to drive a rebound in gold prices in the future 📈
Accurate signals are updated every day 📈 If you encounter any problems during trading, these signals can serve as your reliable guide 🧭 Feel free to refer to them! I sincerely hope they'll be of great help to you 🌟 👇
Expecting Gold bullish Movement Gold (XAU/USD) on the 15-minute chart is showing signs of a bullish reversal after forming a potential double bottom pattern around the 3332 support zoneThis area has been tested multiple times indicating strong buying interest and a solid demand zone
The price action suggests a possible continuation of the bullish momentum, supported by the higher lows and projected upside trajectory. A breakout above the minor consolidation and neckline zone near 3346 could push price toward the identified target zone around 3370 which also aligns with a previous resistance level
Key Levels
Support 3332
Resistance Target Zone 3370
Entry Zone Current pullback near 3345 3346
Bullish Structure: Double bottom with higher low confirmation
If bullish momentum holds this setup offers a favorable risk to reward scenario aiming for a breakout toward the upper resistance zone

Pay attention to 3320, if it falls below, go long at 3310-3300The short order has been completed and profit has been realized. Now the 1H technical indicators show that there is still room for decline in the short term. Focus on the 3320 support. If it falls below 3320, the gold price is expected to reach the 3310-3300 area, which is also an ideal trading area for intraday long positions. There is nothing much to say. Follow the wolves and you will get meat. Currently, the brothers who follow me to trade have all made good gains.
OANDA:XAUUSD
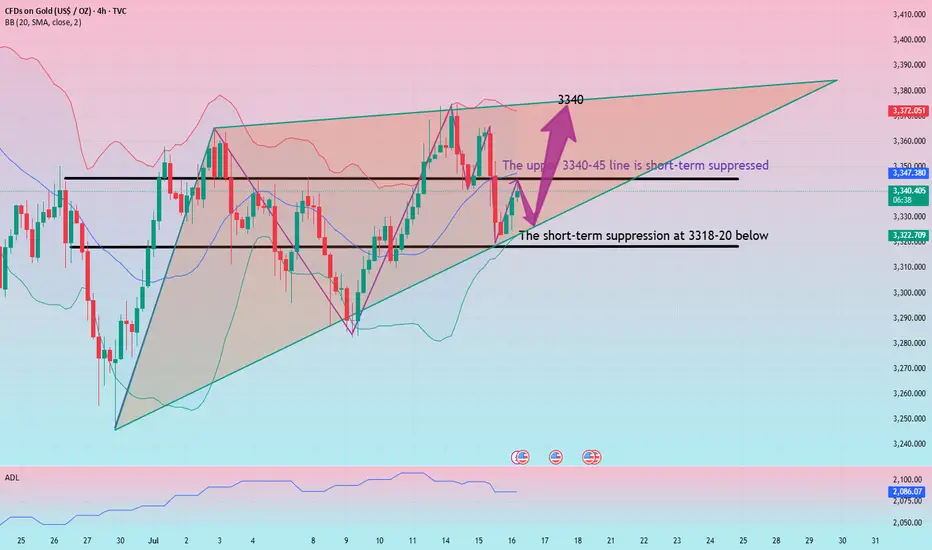
Gold adjustment is complete and continue to be long
Gold rebounded at 3322 today. Technically, it needs to rebound and repair when it falls back to 3318-25, so we can find opportunities to go long below to seize the profit space of the rebound. If your current gold operation is not ideal, I hope I can help you avoid detours in your investment. Welcome to communicate with us!
From the 4-hour analysis, the upper short-term pressure focuses on 3340-45, and the lower short-term support focuses on 3318-20. Relying on this range, the main tone of high-altitude low-multiple cycle participation remains unchanged during the day. In the middle position, watch more and move less, and follow orders cautiously, and wait patiently for key points to enter the market.
Gold operation strategy:
Gold falls back to 3318-25 and goes long, stop loss 3312, target 3340-45, and continue to hold if it breaks;
As risk aversion wavers, will gold rise or fall?
💡Message Strategy
After falling for two consecutive days, gold (XAU/USD) rebounded slightly in the Asian session on Wednesday, stabilizing above $3,320, attracting some bargain-hunting buyers. The market has paid close attention to the tariff policy that US President Trump continues to increase, and the rising risk aversion has become the core factor supporting gold prices.
The US CPI data for June showed that overall prices rose by 0.3% month-on-month, the largest increase in five months, and the core CPI rose to 2.9% year-on-year, both higher than expected. This has caused the market to worry that tariffs are gradually pushing up inflation, prompting the Federal Reserve to extend the high interest rate policy cycle.
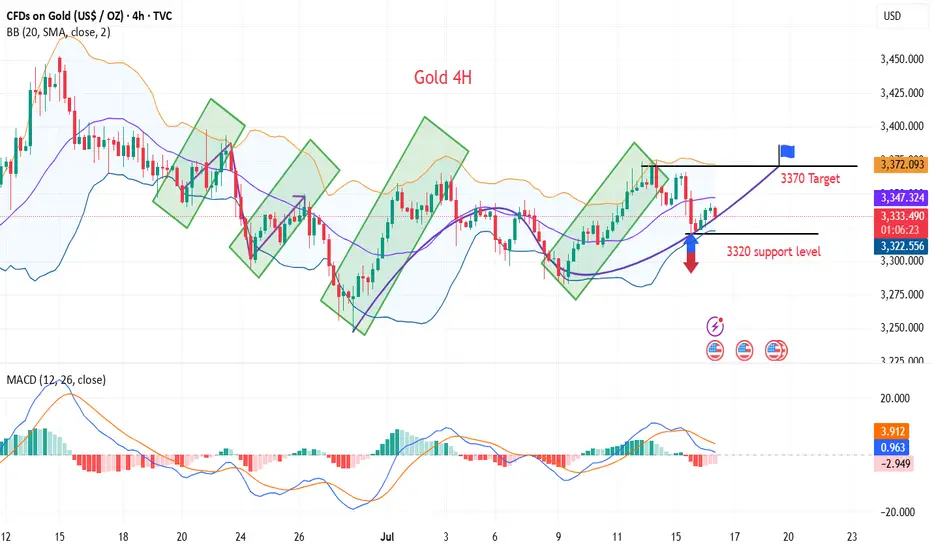
📊Technical aspects
The current trend of gold is constrained by both fundamentals and technical factors.
On the one hand, Trump's tariff policy has pushed up inflation expectations, triggering risk aversion and rethinking of the Fed's policy path, providing support for gold;
On the other hand, the Fed's tone of "maintaining high interest rates for longer" has limited the room for gold prices to rebound.
From the 4-hour chart, gold prices found support near the 100-period SMA (about $3,320) on Tuesday, stopping the decline from the three-week high. In the short term, if it can stand above the 3340-3345 resistance band, it may test the 3365-3370 area again, and the further target is the 3400-dollar round mark.
💰Strategy Package
Long Position:3320-3330,SL:3305,Target: 3365-3370
Gold (XAU/USD) Trading Analysis for July 16Support Zone: The market has found support around the 0.5 Fibonacci retracement level at 3,333.58. This could be a potential entry point for a long trade if the price bounces here.
Resistance Zone: The price action is approaching the 3,345.18 level, with a strong resistance around that zone. If the price breaks above this resistance, we could see further upward movement.
Price Action: We can observe an initial bullish movement followed by a correction. The price is currently in an uptrend, forming a series of higher lows and higher highs.
Fibonacci Levels: The 0.5 level at 3,333.58 has already acted as a support zone, and if the price retraces back here, this could be a good opportunity to enter long positions. The 0.618 level at 3,336.32 serves as a key resistance point. If price breaks above this level, it could indicate a continuation of the bullish trend.
Bullish Scenario (Long Entry): If the price retraces back to the 3,333.58 area (0.5 Fibonacci level) and shows signs of support (such as bullish candlestick patterns), consider entering long with a target at 3,345.18.
Bearish Scenario (Short Entry): If the price fails to break above 3,345.18 and forms a reversal pattern, you could consider shorting with a target near 3,320.
Risk Management:
Stop Loss: Place a stop loss just below 3,330, allowing for a small margin of error in case the price breaks through the support level.
Take Profit: Consider setting a take-profit at 3,345.18 for short-term moves or look for further price action if you're aiming for a longer-term trend.
Reminder: Always monitor the price action closely and adjust stop losses accordingly. The market is subject to volatility, especially during high-impact news events, so make sure to stay updated.

GOLD Is Going Down! Short!
Please, check our technical outlook for GOLD.
Time Frame: 2h
Current Trend: Bearish
Sentiment: Overbought (based on 7-period RSI)
Forecast: Bearish
The price is testing a key resistance 3,363.11.
Taking into consideration the current market trend & overbought RSI, chances will be high to see a bearish movement to the downside at least to 3,342.15 level.
P.S
Please, note that an oversold/overbought condition can last for a long time, and therefore being oversold/overbought doesn't mean a price rally will come soon, or at all.
Disclosure: I am part of Trade Nation's Influencer program and receive a monthly fee for using their TradingView charts in my analysis.
Like and subscribe and comment my ideas if you enjoy them!

Gold is Moving Sideways – A Potential Triangle Formation?Gold is currently trading in a sideways pattern, potentially forming a triangle consolidation. This type of setup often precedes a strong breakout. At the moment, price action is showing hesitation near key resistance. Traders should wait for a confirmed breakout above the upper boundary of the triangle to validate a bullish continuation.
Patience is key—wait for the breakout before taking action.

check the trendIt is expected that a trend change will form within the current support area and we will witness the beginning of the upward trend.
If the price breaks through the support zone, the continuation of the correction is likely.
If the price breaks through the support levels, the continuation of the downtrend is likely.

BUY XAUUSD 16.7.2025Trend Resumption at H1: BUY at M15
Type of order: Limit order
Reason:
- The price brokeout the sub key of M15, confirming the uptrend into main key M15.
Note:
- Management of money carefully at the price of sub key M15 (3335)
Set up entry:
- Entry buy at 3325
- SL at 3319
- TP1: 3335
- TP2: 3347
Trading Method: Price action (No indicator, only trend and candles)

Gold has bounced back after tapping into the Fair Value Gap.📈 Gold Market Daily Outlook 💰
Gold has bounced back after tapping into the Fair Value Gap (FVG) and clearing liquidity below recent lows.
🔥 Price is now heading into a key bearish FVG zone on the 4H chart.
📊 Key Level to Watch:
If $3339 breaks with strong bullish momentum, we could see a further push towards $3350 and beyond.
⚠️ Reminder:
This is not financial advice — always DYOR (Do Your Own Research)!

XAUUSDXAUUSD Updated in 15M :
The gold signal is marked on the chart based on the latest price changes and the supply and demand in the market. These points include the entry point, stop loss, and take profit

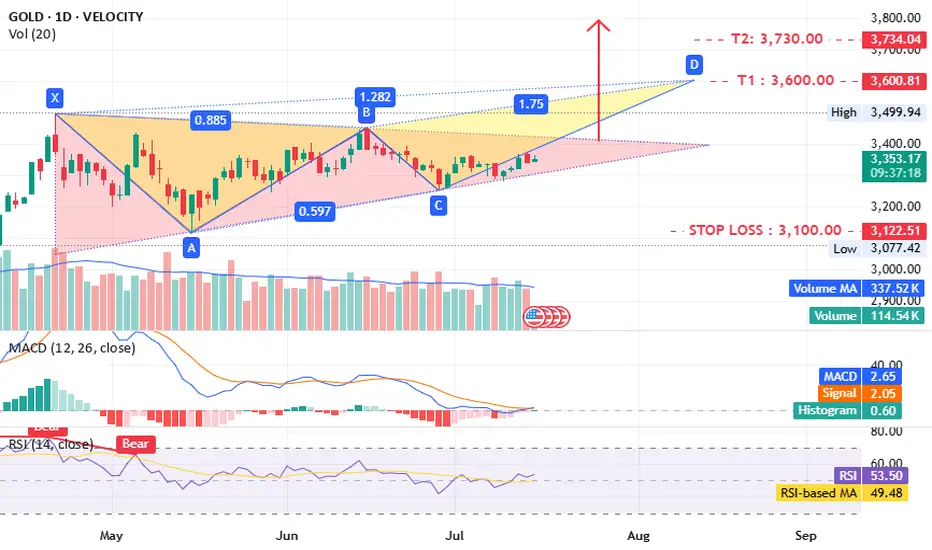
Gold what is next ?!!TVC:GOLD timeframe 1 day
is forming a potential triangle pattern, which could lead to a bearish setup.
The MACD and RSI indicators are positive, supporting this outlook. A close above 3400 would further confirm the idea.
Targets:
- T1: 3600
- T2: 3730–3800
Stop loss: 3100
Support: 3300–3260
Consider opening a long position now, with confirmation above 3400.
Disclaimer: This is not investment advice, only an analysis based on chart data. Consult your account manager before making any decisions. Good luck.
Sell Idea: Gold @ 3370Gold has surged to 3370, but momentum is waning with overbought RSI and bearish divergence. Recent economic data suggests easing inflation, reducing safe-haven demand. Expect a pullback to 3348 or lower.
Trade Setup:
• Entry: 3370
• Stop Loss: 3377
• Take Profit: 3348
• Risk-Reward: 1:3.7

Upward opportunity in the bull-bear tug-of-war of goldUpward opportunity in the bull-bear tug-of-war of gold
Current price: $3,360/ounce, yesterday's roller coaster market of $3,375-3,343
▶ Key driving factors
Bullish factors:
🔥 Trump tariff bomb: 30% tariff on EU/Mexico from August 1 (EU 21 billion euro counter-list to be issued)
🌪️ Geopolitical risks escalate: The United States issued a 50-day ultimatum to Russia, and NATO accelerated the arming of Ukraine
📉 Potential weakness of the US dollar: Market expectations for the Fed's September rate cut remain at 72%
Negative pressure:
💵 US dollar rebound: US dollar index hit 98.14 (three-week high)
📈 US Treasury yields: 10-year rose to 4.447% (four-week high)
▶ Technical key framework (bullish perspective)
Trend structure:
• The daily line stands firm on the short-term moving average, and the 3325-30 area forms a bullish defense line
• Breaking through 3375 will open up the space of 3400-3450
• The 4-hour chart maintains an upward channel, and 3340-45 constitutes the first support of the day
Trading strategy:
① Aggressive long: light position at the current price of 3345 to try long, increase position at 3330, stop loss below 3317, target 3365-75
② Breakthrough trading: large volume breakthrough 3375 to chase long, stop loss 3360, target 3400
③ Hedge protection: buy 3300 put options to hedge against black swan risks
"Every callback caused by the trade war is a better entry point for bulls - this time will be no exception." - A senior gold trader
▶ Today's focus
⏰ 20:30 US June CPI data (expected to be 2.7% year-on-year)
• If the actual ≤2.5%: gold may go straight to 3400
• If the actual value is ≥3.0%, it may test the support of 3320
Personal opinion: In the context of the increasing tension in the trade war, the current support area of 3340-45 is very attractive. Although it is constrained by the rebound of the US dollar in the short term, the safe-haven property of gold will eventually prevail - it is recommended to arrange long orders on dips and wait for the CPI data to trigger the market.