XAUUSD Outlook – From Bias to Execution Previous day closed bearish, leading to a sell bias, On the 1H, I then identified a familiar chart pattern, a rising wedge, On the 45M, I then looked for a possible entry and exit zone.
GOLDCFD trade ideas

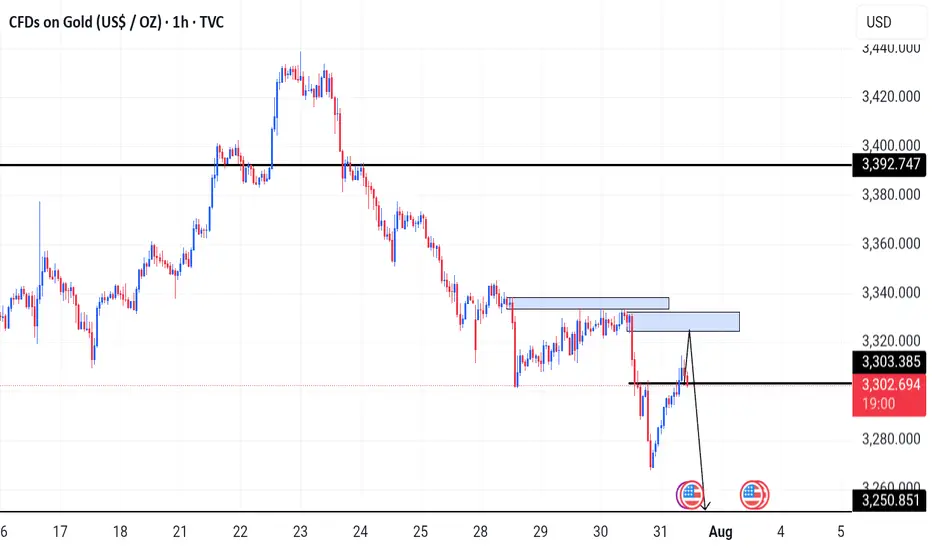
GoldTVC:GOLD price overall is bearish and looks like during NFP tomorrow it does looks like it's bout to be drop all the way down. But what are your ideas guys let me know on the comment session
GOLD USDHI GUYS.
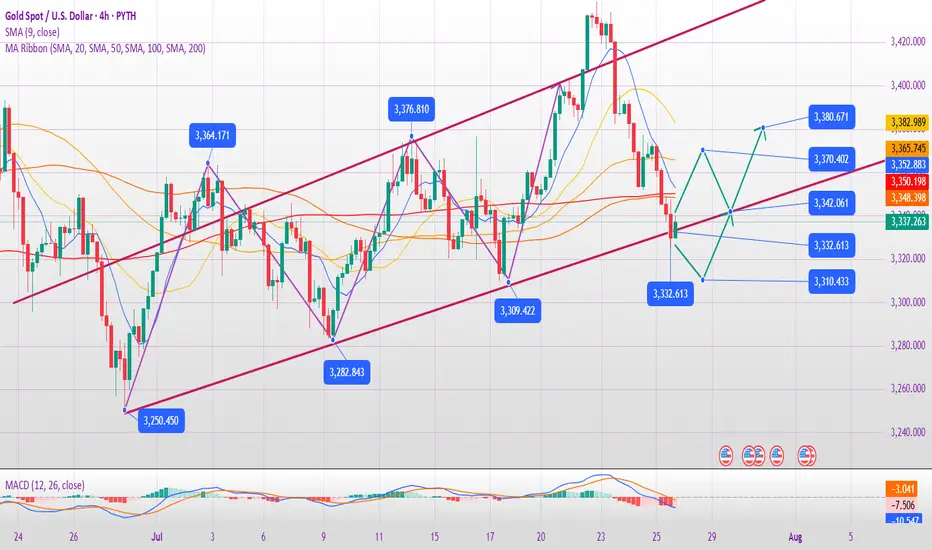
here we have daily path.
i expect pullback, retest to form double top h4, h2, h1 at number 3,
then we sell to clear numer 3 downwards.
currently its a buy . details on h4 chart

GOLD (XAUUSD) Wave analysis Weekly - 30/7/2025 (Scenario 1)GOLD (XAUUSD) Wave analysis Weekly - 30/7/2025 (Scenario 1)

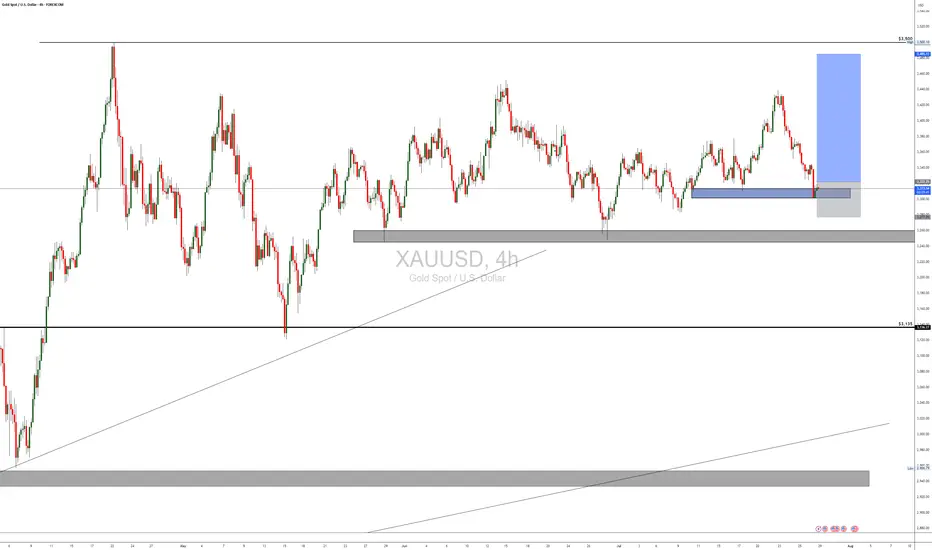
XAUUSD ideaWe are waiting for our asset to reach our action zone, and based on the reaction, we’ll decide on our next moves.ALWAYS WAIT FOR A CONFIRMATION TO SEE IF THE PRICE VALIDATES THE ZONE.and you what is your vision of the EURUSD its interests me! i wait you in the commentary

GOLD: Next Move Is Down! Short!
My dear friends,
Today we will analyse GOLD together☺️
The market is at an inflection zone and price has now reached an area around 3,328.24 where previous reversals or breakouts have occurred.And a price reaction that we are seeing on multiple timeframes here could signal the next move down so we can enter on confirmation, and target the next key level of 3,318.05..Stop-loss is recommended beyond the inflection zone.
❤️Sending you lots of Love and Hugs❤️

gold ranginggold is currently ranging underneath the broke of daily trendline.
possible falling wedge formation.
trade out of the wedge.

XAUUSD M45 Outlook XAUUSD
Liquidity grabbed ✅
Break of Structure & ChoCh confirmed ✅
Price taps into premium OB zone 🧠
Entry from refined supply zone 🎯
Risk:Reward 🔥
SL: 3348
TP: 3290
If this plays out, it's textbook Smart Money 👑
Risk managed. Emotions off. Let the market speak.

Gold Buy SetupHi everyone
Hope you all had a good trading week so far, this is our buy setup we looking to see for Wednesday
Let us know in the comments what you think.

Gold prices under pressure: $3,330-3,350Gold prices under pressure: $3,330-3,350
Upward momentum: Gold could break through $3,330 if the Federal Reserve hints at a September rate cut or the EU economy deteriorates.
Downside risks: Gold could fall below $3,300 if strong US economic data (such as GDP and PCE figures) are released.
Optimistic scenario: If the Fed cuts rates in September and global stagflation risks increase, gold could reach $3,400.
Pessimistic scenario: If the US economy experiences a soft landing, rising real interest rates could push gold prices down to $3,200.
Key Technical Levels:
Support: $3,300
Resistance: $3,330/$3,350
Aggressive Strategy:
Sell Price: $3,325-$3,330
Stop Loss: $3,335
Target Price: $3,310
Conservative Strategy:
Sell Price: $3,340-$3,350
Stop Loss: $3,355
Target Price: $3,330-$3,310
Bottom Picking Strategy:
Buy Price: $3,300-$3,310
Stop Loss: $3,290
Target Price: Above $3,350/$3,400

XAUUSD - BUY to SELL CONT.DI'm in on the BUY, waiting patiently to take the SELL only with confirmation

Gold setupGold us just broken to the downside from the previous uptrend and now we expect the prices to continue pushing towards the downside. the prices are likely to reject from the the current order block but if not, they will probably do on the smaller upper order block as you can see via the analysis

BUY TRADE SETUP ON XAUUSDA Quick Trade setup on Gold for Gold traders who are crazy about Gold!
Swing Trade.
Check it out!
Analysis and strategy of gold market on July 28:
Core influencing factors
Risk aversion cools down: Despite frequent geopolitical risk events, market panic has not significantly increased, weakening gold safe-haven buying.
US dollar strengthens: US economic data supports the continuous rise of the US dollar, and funds flow back to US dollar assets, suppressing the attractiveness of gold.
ETF holdings outflow: Short-term risk appetite has rebounded, and gold ETFs have seen a slight outflow of funds, reflecting the cautious attitude of the market.
Key events focus:
US-EU and US-China trade negotiations: If progress is optimistic, gold prices may fall to the $3,300/ounce mark.
Federal Reserve resolution: Pay attention to policy independence (affected by Trump's pressure) and interest rate guidance.
Non-farm data: Released on Friday, if the employment data is strong, it may strengthen the US dollar to further suppress gold.
Key technical points
Weekly level:
Watershed $3,325: If it is held, it will maintain high-level fluctuations, and if it is lost, it will open up downward space.
Support area: If the daily support is broken, the weekly support may be tested (reference 3300-3310).
Daily level:
Key support: The current daily support is facing the risk of breaking down, and we need to be alert to the acceleration of short positions.
4-hour level:
Resistance 3388 US dollars (middle track): Before the rebound is not broken, the short-term is short.
Weak signal: The price continues to run below 3363, and the rebound is weak.
Hourly chart:
Strong and weak boundary 3363 US dollars: Maintain weakness before breaking, and avoid bottom-fishing against the trend in the negative market.
Operation strategy suggestions
Short-term direction: Short-selling on rebound is the main, supplemented by light-weight buying at key support levels.
Short-term selling opportunities:
Ideal entry: 3370-3375 area (below the 4-hour middle track), stop loss above 3380.
Target: 3320-3310, if it breaks down, look at 3300.
Opportunities to buy long orders in the short term:
Participate cautiously: If the support of 3320-3310 stabilizes, combine the K-line signal to hold a light long position, and stop loss below 3300.
Quick in and out: You can exit the market when it rebounds to 3340-3350.
Risk warning:
Before the Fed’s decision: Avoid heavy positions, and be wary of unexpected hawkish policies that cause volatility.
Non-agricultural data: If the data exceeds expectations, it will be bearish for gold.
Summary: Gold is short-term technically bearish, but be wary of event-driven reversals. Trading requires strict stop losses and flexible response to data and policy risks.
Gold 1H Intra-Day Chart 24.07.2025We saw a perfect rejection from our $3,437 zone and a drop into our first TP of $3,380. What's next?
Option 1: Gold keeps dropping lower into $3,360.
Option 2: Gold buyers hold around $3,380 & push price back up.
Which scenario do you find more likely?

Daily chart gapThis gap will be closed in a week or two. I am gonna hold buy from now. At least set TP at 3400. We'll see if it goes as planned.

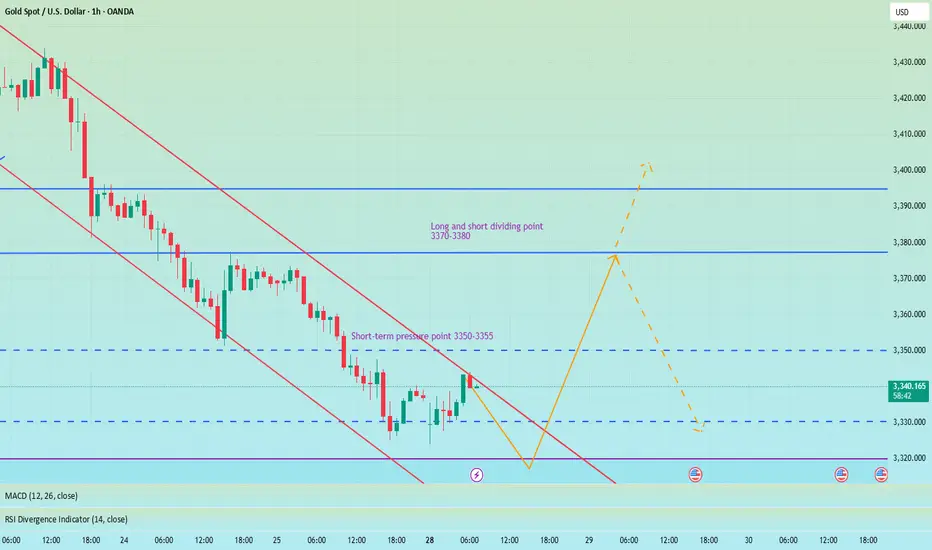
Pay attention to 3350 gains and lossesGood morning, bros. This morning gold again tested last week's low near 3325. From the chart, gold may continue to rise this week, with tariffs approaching, the Fed's interest rate cut, and NFP data imminent. The current strength and weakness are at 3350-3355. If it can effectively break through and stand above, it is expected to continue to test the previous high point, which is also the long-short dividing point of 3370-3380.
From the daily chart, there is not much change in the operational range of gold in the short term, and the change in the 4H chart is more obvious. After the decline in the early trading, it is now rebounding. There is a possibility of closing positive at the low. If it is directly positive on Monday, then it will bottom out directly at the beginning of the week. If it refreshes the low on Monday, the low point of 3285 will be seen below. Therefore, today's market focuses on the continuity of long and short. Of course, according to the current changes, the biggest possibility is to continue to rebound at the low point, pay attention to the support of 3310-3300 below, and pay attention to the gains and losses of the high point of 3355 above.
GOLD (XAUUSD)GOLD Market Outlook........
📍 Price broke daily trendline and is now retesting it.
📍 You marked a Break of Structure (BOS) — suggesting a shift in direction.
📍 Price is in a consolidation zone (range) with possible accumulation.
What to Expect:
- If price breaks above the range, expect a bullish push upward to the next supply level.
- If it rejects the upper box, it may return to fill imbalance or test previous lows again.
What You Should Do:
1. Wait for breakout confirmation from the consolidation zone.
2. For buys: Enter on a clear break and retest of the upper range box.
3. For sells: If price rejects the top and breaks back below, look for short entries toward support.

Long XAUUSD 2RXAUUSD finish doing the correction now looking toward long. I will consider taking Long on XAUUSD. Vamos !

XAUUSD REBOUNDED FROM CURRENT TRENDLINE. WHAT'S NEXT?XAUUSD REBOUNDED FROM CURRENT TRENDLINE. WHAT'S NEXT?
Gold had successfully rebounded from the trendline, still showing mid-term bullish trend despite recent news on U.S. - E.U. and U.S. - Japan trade deals. Currently price is attempting to hold above the EMA20 on 1-h chart timeframe.
If this occurs and the asset develops another short-term bullish impulse, we may expect the price to reach 3,360.00 resistance level with further possible impulse towards 3,400.00 level.

XAUUSDPrice action trading is a methodology where traders make decisions based on the interpretation of actual price movements on a chart, rather than relying primarily on lagging indicators. It involves observing and analyzing candlestick patterns, trend lines, support and resistance levels, and volume to identify potential trading opportunities and manage risk. The focus is on understanding the story the market is telling through its price behavior.

XAUUSD - Scalping ideaPrice is stuck in a range between 3348.90 and 3324.87.
📌 Looking for a clean breakout to take action:
Buy above 3348.90 → Targeting 3354.09
Sell below 3324.87 → Targeting 3319.15
Not interested in any trades inside the range only jumping in once we break out and close outside either level. Waiting for confirmation to avoid getting chopped up.
Let’s see where it goes. 📉📈
No rush, just reacting.

Gold under pressure as USD strengthensGold is facing significant selling pressure as the US dollar regains momentum. Currently, XAU/USD is trading near $3,337, down over $31 from the session high, and pressing directly against the ascending trendline.
The stronger USD is making gold—an asset that yields no interest—less attractive to investors. If this dollar strength continues, the likelihood of a trendline break and further downside is very high.
On the economic front, U.S. jobless claims have fallen to their lowest level in three months, signaling a resilient labor market despite sluggish hiring. This stable jobs data is expected to support the Fed’s decision to hold interest rates steady at 4.25–4.50% in the upcoming policy meeting, even amid rising inflation pressure driven by President Donald Trump’s tariff policies.
At this moment, sellers are in control. Traders should closely watch upcoming support zones and trading volume to spot reasonable entry points.
Good luck!
