GOLDCFD trade ideas

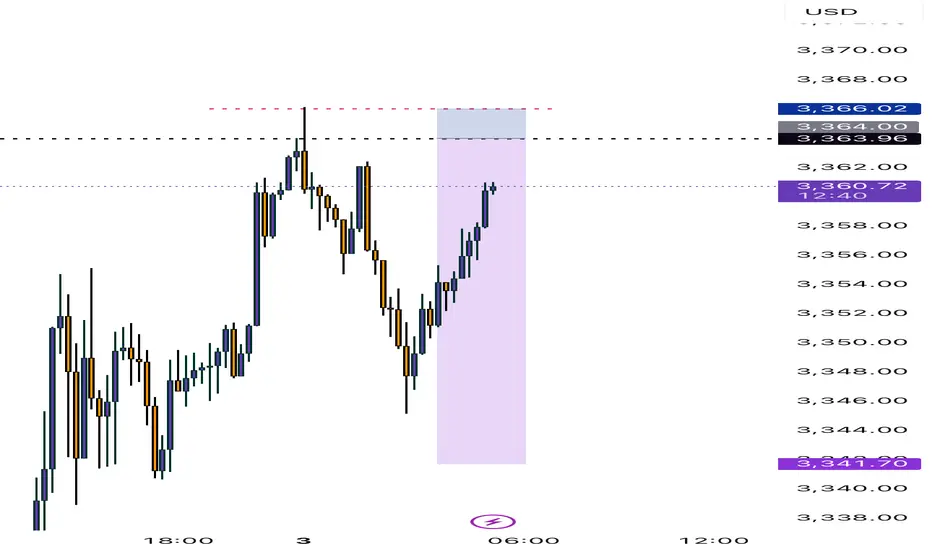
Technical indicators are bullish across the boardInfluenced by the NFP data, gold prices rose strongly, fully recovering last week's losses. The current gold market has broken the previous bull-bear equilibrium and remains in a strong upward trend. We are currently bullish but will not chase the rise. We will wait for gold to fall back and stabilize before trying to go long. Gold is currently in a sideways consolidation. If gold touches the upper short-term resistance of 3365-3370 again in the European session and encounters resistance and pressure, you can consider shorting with a light position and waiting for a pullback. If the gold price breaks up strongly, pay attention to the key suppression level above 3375-3385.
As the price of gold continues to rise, the support has moved up. Pay attention to the short-term support of 3345-3330 below. If it retreats and stabilizes, you can consider going long. Independent traders must strictly implement trading plans, and those who are not sure about the market must set stop-loss orders.
OANDA:XAUUSD

04/08/25 Gold Swing LevelsBack to Gold but with daily swing levels.
Monday 04/08/25 levels are marked; depending on if market opens with a gap, price should continue upwards.
Trade parameters
Entry on 5 min chart
Sl: 30-50pips
TP: 2-4x SL

Gold Holds the Trendline - Eyes on the Range HighGold remains range-bound but is climbing off the range low with strong bullish momentum. Price is respecting the trendline and could stage a move toward the top of the range. A minor pullback may offer the best entry opportunity before momentum takes it higher. This setup favors buying the dip as long as the trendline holds.

GOLD - WAVE 5 BULLISH TO $3,680As I said on our last update, this 'Gold Bullish Scenario' remains valid as price has still failed to close below $3,245 (Wave 2) low.
As long as Gold remains above Wave 2 high ($3,245), this Gold bullish bias remains an option. As traders we always have to be prepared to adapt to different market conditions.

ATH - Not in my watch for nowAs mentioned in my last post, Gold won't be pushing to break ATH unless there's an unusual catalyst that attracts it. Range bound trading is still the play, especially as we're coming into August. Save your ammunition for the Fall season, reduce your position and trade conservatively to build your equity safely. The USD has some room leg room to push higher in the short term that should hinder the yellow metal to go full bore.

Bullish
Description
Hi traders
I think after the fake break that happened last week at 3280, we should be ready to move higher with a target of 3430-3450 and if the fundamentals are impressive, even a break of the previous high.
Of course, the resistance zone of 3385-3405 is in the way of the price.
I hope that the analysis I am providing is accurate and effective.
Possible positions this week
A:Suitable prices for BUY positions
1)3345-3340
2)3174-3150
B:Suitable prices for SELL positions
1)3385-3405(Of course, with approval from the market and the type of candles)
This is just an analysis and everyone is responsible for their own work.
Hoping for a good and profitable week.

gold on third pattern breakout#XAUUSD have multiple test the third pattern, now price forming needs to breakout the 3308 before any further movement.
Buy entry 3301.4, TP 3308-3323.
Below 3291 holds a very strong bearish continuation, if breakout price will fall till 3269

XAUUSD Gold Trading Strategy August 1, 2025
Yesterday's trading session, gold prices recovered to the 3315 area and then continued to decrease to the 3281 area. Currently, gold prices are fluctuating quite unpredictably due to the impact of tariff news and investor confidence.
Basic news: The Federal Reserve FED continues to maintain the federal funds benchmark interest rate in the range of 4.25% - 4.50%, in line with policy since 2025. Chairman Powell did not give any signal about the next interest rate cut on September 16 - 17.
Technical analysis: After falling sharply to the 3269 area, gold prices are showing signs of recovery. In the current downtrend channel, there has been a higher bottom than the bottom at H1. We can see that if the bullish pattern at H1 is confirmed, combined with the reversal candlestick appearing at H4, the possibility of gold bouncing back to reach the resistance area of 3330, even 3350 is completely possible. In the weekend trading session, we will wait at the support zones to trade.
Important price zones today: 3280 - 3285 and 3269 - 3274.
Today's trading trend: BUY.
Recommended orders:
Plan 1: BUY XAUUSD zone 3283 - 3285
SL 3280
TP 3288 - 3300 - 3310 - 3330.
Plan 2: BUY XAUSD zone 3269 - 3271
SL 3266
TP 3274 - 3284 - 3300 - 3320.
Wish you a safe, favorable and profitable trading day.🥰🥰🥰🥰🥰

XAU/USD 01 August 2025 Intraday AnalysisH4 Analysis:
-> Swing: Bullish.
-> Internal: Bullish.
You will note that price has targeted weak internal high on three separate occasions which has now formed a triple top, this is a bearish reversal pattern and proving this zone is a strong supply level. This is in-line with HTF bearish pullback phase.
Remainder of analysis and bias remains the same as analysis dated 23 April 2025.
Price has now printed a bearish CHoCH according to my analysis yesterday.
Price is now trading within an established internal range.
Intraday Expectation:
Price to trade down to either discount of internal 50% EQ, or H4 demand zone before targeting weak internal high priced at 3,500.200.
Note:
The Federal Reserve’s sustained dovish stance, coupled with ongoing geopolitical uncertainties, is likely to prolong heightened volatility in the gold market. Given this elevated risk environment, traders should exercise caution and recalibrate risk management strategies to navigate potential price fluctuations effectively.
Additionally, gold pricing remains sensitive to broader macroeconomic developments, including policy decisions under President Trump. Shifts in geopolitical strategy and economic directives could further amplify uncertainty, contributing to market repricing dynamics.
H4 Chart:
M15 Analysis:
-> Swing: Bullish.
-> Internal: Bullish.
H4 Timeframe - Price has failed to target weak internal high, therefore, it would not be unrealistic if price printed a bearish iBOS.
The remainder of my analysis shall remain the same as analysis dated 13 June 2025, apart from target price.
As per my analysis dated 22 May 2025 whereby I mentioned price can be seen to be reacting at discount of 50% EQ on H4 timeframe, therefore, it is a viable alternative that price could potentially print a bullish iBOS on M15 timeframe despite internal structure being bearish.
Price has printed a bullish iBOS followed by a bearish CHoCH, which indicates, but does not confirm, bearish pullback phase initiation. I will however continue to monitor, with respect to depth of pullback.
Intraday Expectation:
Price to continue bearish, react at either M15 supply zone, or discount of 50% internal EQ before targeting weak internal high priced at 3,451.375.
Note:
Gold remains highly volatile amid the Federal Reserve's continued dovish stance, persistent and escalating geopolitical uncertainties. Traders should implement robust risk management strategies and remain vigilant, as price swings may become more pronounced in this elevated volatility environment.
Additionally, President Trump’s recent tariff announcements are expected to further amplify market turbulence, potentially triggering sharp price fluctuations and whipsaws.
M15 Chart:

Interest rates unchanged, sticking to my bearish idea.Look at my other posts and you''ll understand as to why, I was telling everyone to sell. There was a small sellers trap, we pushed up, at that moment I already had closed my positions. Now we go down to the other key levels. I'm done till the end of August. Will still post my setups, but won't take any trades. Stay safe and keep your funds safe. Hella Love!


Gold intraday downside
Gold intraday: down trend, short position below 3335 with target 3296 and 3278. Long position 3274-3280.

XAU/USD 29 July 2025 Intraday AnalysisH4 Analysis:
-> Swing: Bullish.
-> Internal: Bullish.
You will note that price has targeted weak internal high on three separate occasions which has now formed a triple top, this is a bearish reversal pattern and proving this zone is a strong supply level. This is in-line with HTF bearish pullback phase.
Remainder of analysis and bias remains the same as analysis dated 23 April 2025.
Price has now printed a bearish CHoCH according to my analysis yesterday.
Price is now trading within an established internal range.
Intraday Expectation:
Price to trade down to either discount of internal 50% EQ, or H4 demand zone before targeting weak internal high priced at 3,500.200.
Note:
The Federal Reserve’s sustained dovish stance, coupled with ongoing geopolitical uncertainties, is likely to prolong heightened volatility in the gold market. Given this elevated risk environment, traders should exercise caution and recalibrate risk management strategies to navigate potential price fluctuations effectively.
Additionally, gold pricing remains sensitive to broader macroeconomic developments, including policy decisions under President Trump. Shifts in geopolitical strategy and economic directives could further amplify uncertainty, contributing to market repricing dynamics.
H4 Chart:
M15 Analysis:
-> Swing: Bullish.
-> Internal: Bullish.
H4 Timeframe - Price has failed to target weak internal high, therefore, it would not be unrealistic if price printed a bearish iBOS.
The remainder of my analysis shall remain the same as analysis dated 13 June 2025, apart from target price.
As per my analysis dated 22 May 2025 whereby I mentioned price can be seen to be reacting at discount of 50% EQ on H4 timeframe, therefore, it is a viable alternative that price could potentially print a bullish iBOS on M15 timeframe despite internal structure being bearish.
Price has printed a bullish iBOS followed by a bearish CHoCH, which indicates, but does not confirm, bearish pullback phase initiation. I will however continue to monitor, with respect to depth of pullback.
Intraday Expectation:
Price to continue bearish, react at either M15 supply zone, or discount of 50% internal EQ before targeting weak internal high priced at 3,451.375.
Note:
Gold remains highly volatile amid the Federal Reserve's continued dovish stance, persistent and escalating geopolitical uncertainties. Traders should implement robust risk management strategies and remain vigilant, as price swings may become more pronounced in this elevated volatility environment.
Additionally, President Trump’s recent tariff announcements are expected to further amplify market turbulence, potentially triggering sharp price fluctuations and whipsaws.
M15 Chart:


Gold 1H Intra-Day Chart 24.07.2025We saw a perfect rejection from our $3,437 zone and a drop into our first TP of $3,380. What's next?
Option 1: Gold keeps dropping lower into $3,360.
Option 2: Gold buyers hold around $3,380 & push price back up.
Which scenario do you find more likely?

BOS into Downtrend I think price is going down to the higher level support to sweep liquidity and go back to continue into the uptrend

3300 may fall below, possibly setting a new low#XAUUSD
From the daily chart perspective, gold has a tendency to form a converging triangle, and observing the technical indicators of the daily chart, the downward trend may have just begun📉.
So, how should we plan for the evening?📊 Now there are certainly many outside buyers who will continue to increase their positions and try to recover their losses💰. So, should we continue to be long?📈 My opinion is to wait and see.👀 If the daily chart does not fall below 3300 points, it will consolidate between 3300 and 3350 points in the future. If it falls below 3300 points, we will next focus on the support level of 3295-3285 points, and then consider whether to go long🤔.
If you are more aggressive, you can consider going long near 3305 points and exit after earning $10-20. All opinions have been informed and everyone can choose to adopt them according to their own circumstances.😄

Gold price final game: 3300Gold price final game: 3300
Today's gold price is on the verge of collapse, but the direction divergence still exists, with long and short intertwined.
Pay attention to the 3300 support.
The entire triangle convergence and oscillation pattern has been broken, and the important support platform before 3330 points has been broken.
Regardless of how the policy is announced,
shorting is inevitable.
Next, the bulls will enter the final bottom-picking stage:
Buy: 3300-3310
Stop loss: 3290
Target: 3330-3340+
Technical analysis:
Short-term support level: 3300
Short-term resistance level: 3330-3345
Market sentiment: The gold market sentiment presents a pattern of long and short intertwined and weak volatility.
In the short term, pay attention to the $3300 support level and the Fed's interest rate cut policy signal.
If the Fed turns to interest rate cuts or geopolitical conflicts escalate, gold may resume its upward trend.
Daily operation suggestions:
Long-term thinking: Bottom-picking thinking: Bottom-picking range: 3300-3310
Stop loss: 3290
Target: 3330-3345+
Short-term thinking: Trend-following thinking: High-altitude range: 3320-3330
Stop loss: 3345
Target: 3300-3280-3250
Final game of gold price: 3300
Today's gold price is on the verge of collapse, but the direction divergence still exists, and long and short positions are intertwined.
Pay attention to the 3300 support.
The entire triangle convergence and oscillation pattern has been broken, and the important support platform before 3330 points has been broken.
Regardless of how the policy is announced,
shorting is inevitable.
Next, the bulls will enter the final bottom-picking stage:
Buy: 3300-3310
Stop loss: 3290
Target: 3330-3340+
Technical analysis:
Short-term support: 3300
Short-term resistance: 3330-3345
Market sentiment: The gold market sentiment shows a pattern of mixed long and short positions and weak volatility.
In the short term, pay attention to the $3,300 support level and the Fed's interest rate cut policy signal.
If the Fed turns to interest rate cuts or geopolitical conflicts escalate, gold may resume its upward trend.
Daily operation suggestions:
Long-term thinking: bottom-picking thinking: bottom-picking range: 3300-3310
Stop loss: 3290
Target: 3330-3345+
Short-term thinking: trend-following thinking: high-altitude range: 3320-3330
Stop loss: 3345
Target: 3300-3280-3250
Report - 28 jully, 2025Executive Summary
In a historic move to defuse transatlantic trade tensions, the United States and the European Union have struck a landmark agreement imposing a 15% blanket tariff on EU goods. The deal, brokered between President Trump and EC President Ursula von der Leyen, includes sweeping European commitments to increase purchases of American energy and military equipment—amounting to more than $1.35 trillion. This not only averts a trade war but realigns fiscal, defense, and industrial policy across the Atlantic. Meanwhile, Germany will escape EU sanction for deficit overruns due to elevated defense spending, and China has intensified its diplomatic push to lead AI governance, openly challenging U.S. technological hegemony.
These developments unfold amid a broader recalibration of global capital flows, with Chinese investors pouring record funds into Hong Kong equities, Brazil doubling down on BRICS despite tariff threats, and private equity investors increasingly opting for liquidity over continuation vehicles. All these signals point to a shifting world order, where economic fragmentation, tech rivalry, and military investment dominate the strategic calculus.
Market Reactions
Markets have reacted with cautious optimism. The resolution of the US-EU dispute has removed one of the most immediate risks to global trade, stabilizing risk sentiment. Equities across developed markets are firmer, while defense, energy, and industrial stocks in the U.S. have caught a fresh bid. European auto and export sectors remain under scrutiny given the tariff imposition, despite the broader stability.
The dollar softened slightly on expectations that the trade deal will reduce the likelihood of retaliatory disruptions, even as tensions over chip tariffs and Brazil’s alignment with BRICS persist. Gold briefly rallied but then settled as inflation expectations were tempered by diplomatic de-escalation. Oil prices remain subdued as demand signals remain weak despite energy reordering.
Fiscal and Political Implications
The US-EU agreement marks a major geopolitical win for Trump. The EU's commitment to spend $750 billion on U.S. energy and $600 billion on military procurement illustrates a fundamental pivot in the bloc’s external policy alignment. Politically, this underscores Washington’s ability to extract economic concessions under threat of tariffs—further validating Trump’s unilateralist negotiation style.
Germany’s exemption from EU deficit procedures further highlights Brussels’ strategic flexibility in an era where defense is taking precedence over fiscal austerity. Berlin will be allowed to run a deficit of 3.3% of GDP in 2025, thanks to a “national escape clause” invoked to cover expanded defense spending. This sets a precedent for other member states to follow suit, potentially unleashing a wave of fiscally supported rearmament across the EU.
Meanwhile, China's unveiling of a 13-point AI governance plan signals an emerging regulatory bifurcation in global technology. The push for a UN-backed AI governance body—and the positioning of its open-source models for Global South collaboration—challenges U.S. regulatory primacy and may spark a new front in the AI cold war.
Strategic Forecasts
The medium-term outlook is increasingly defined by strategic spending, tech sovereignty, and the weaponization of trade. The U.S. will likely continue to deploy tariffs not just for balance-of-trade concerns, but also to enforce strategic compliance. This tactic will carry mixed implications for global markets: inflationary near-term, but ultimately supportive of U.S. industrial and defense equities.
Europe’s gradual pivot toward U.S. alignment will create internal friction, especially among member states hesitant to cede strategic autonomy. At the same time, China’s AI diplomacy and Brazil’s defiance of U.S. tariffs will continue to fragment global consensus, creating an increasingly multipolar and protectionist macro environment.
Continued uncertainty around the Federal Reserve’s independence—as Trump ramps up pressure on Powell—will contribute to short-term volatility in bond and currency markets. The likelihood of delayed rate cuts or a politically forced pivot is increasing.
Risks and Opportunities
Risks include renewed tariff escalations, especially targeting tech, chips, and Brazil. Europe’s fiscal leniency could spook bond markets if perceived as unsustainable. In private equity, continuation vehicle fatigue risks forcing markdowns across illiquid portfolios.
Opportunities emerge in defense, energy, and AI-linked equities. The U.S. stands to benefit from a surge in industrial demand, while Chinese tech firms could capitalize on regulatory arbitrage in emerging markets. Open-source AI adoption will favor hardware and semiconductor exporters, particularly in Asia.
Asset Impact Analysis
Gold (XAUUSD):
Gold showed initial strength on trade fears but retraced as the deal lowered immediate inflation risk. With Powell’s position under political threat and long-term fiscal expansion in play, the bullish bias remains intact. Expect gold to test $3,400 in Q3 if Fed guidance shifts dovishly. Near-term support lies at $3,300.
S&P 500 (SPX):
Markets welcomed the trade clarity and defense spending surge. Industrials, defense, and energy are clear beneficiaries, while tech gains from relaxed macro pressure. Continued pressure on Powell could add volatility.
Dow Jones (DJIA):
Dividend-heavy Dow components in defense and manufacturing are poised to outperform. Trade normalization and fiscal leniency in Europe favor global cyclicals.
USDJPY:
With Japanese inflation slightly below forecast and the BoJ still cautious, yen strength is capped. U.S. political drama may induce mild USD weakness but not enough to break 145 convincingly.
DXY (US Dollar Index):
The dollar may weaken modestly as tariff resolution reduces safe-haven demand and the Fed comes under pressure to cut. A break below 103.00 would confirm a bearish turn.
Crude Oil (WTI):
Oil remains stuck in a neutral range. Although the EU will buy more U.S. energy, weak demand signals and lackluster PMI data keep prices rangebound. A breakout above $72 requires more forceful geopolitical tension.

Gold under pressure as USD strengthensGold is facing significant selling pressure as the US dollar regains momentum. Currently, XAU/USD is trading near $3,337, down over $31 from the session high, and pressing directly against the ascending trendline.
The stronger USD is making gold—an asset that yields no interest—less attractive to investors. If this dollar strength continues, the likelihood of a trendline break and further downside is very high.
On the economic front, U.S. jobless claims have fallen to their lowest level in three months, signaling a resilient labor market despite sluggish hiring. This stable jobs data is expected to support the Fed’s decision to hold interest rates steady at 4.25–4.50% in the upcoming policy meeting, even amid rising inflation pressure driven by President Donald Trump’s tariff policies.
At this moment, sellers are in control. Traders should closely watch upcoming support zones and trading volume to spot reasonable entry points.
Good luck!

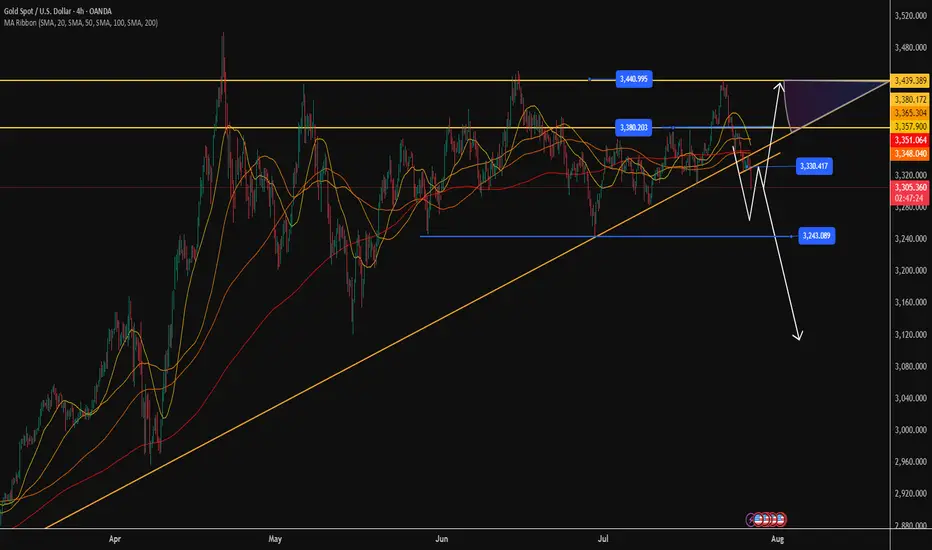
XAU/USD - Potential TargetsDear Friends in Trading,
How I see it,
Let me know if anything is unclear.
If Gold is attempting to achieve 4000, a proper correction is necessary.
Keynote:
The big red arrow/short below the range is what is supposed to happen,
but nobody will agree.
It's okay - I'm biased, I love to short!
I sincerely hope my point of view offers a valued insight
Thank you for taking the time study my analysis.
