XAUUSD 4Hour TF - July 27th, 2025XAUUSD 7/27/2025
XAUUSD 4 hour Neutral Idea
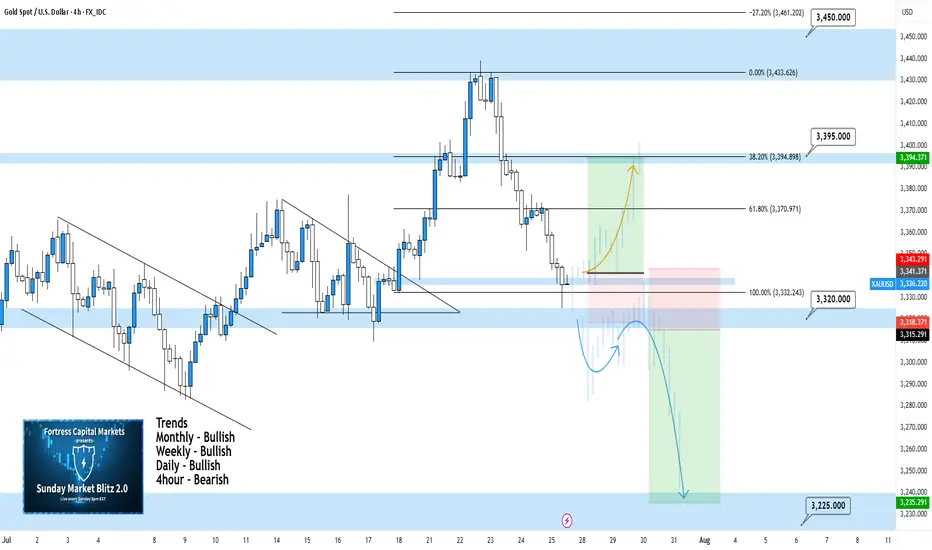
Monthly - Bullish
Weekly - Bullish
Daily - Bullish
4hour - Bearish
Last week we saw a perfect setup playout and then it retraced 100% to close out the week. This is looking more bearish on the 4Hour timeframe now but we need to see how price action reacts at the 3,320 support zone first.
Here are two potential scenarios we want to see for the week ahead.
Bullish Reversal - If we are to see gold as bullish again we would ideally like to see some consolidation at the current level followed by strong bullish conviction.
We need to see convincing price action before we can begin targeting higher. Consolidation + Bullish conviction will be our best chance at a long position.
Bearish Continuation - The 4hour sure looks bearish but will it sustain? Looking ahead into the week we want to see price action push below 3,320 with bearish structure below.
I would also like to see a pattern or a few hours to a day of consolidation below 3,320. If this happens we can begin to target lower toward major support levels like 3,225.
GOLDCFD trade ideas
Gold on the Move – Major Resistance Levels to Watch AheadThe current price action looks strong, and if the bullish momentum continues, we have three main target levels in mind.
The first target is $3,380. This is an important level we expect gold to reach soon if the trend continues upward.
If the price breaks above $3,380, the next target is $3,433. This level is likely to act as a strong resistance, meaning the price might slow down or pull back here. But if gold can push through it with strength, that’s a strong signal of continued upside.
After that, the third target is $3,495, which would mark a strong extension of the current bullish trend.
As long as gold stays above key support levels, we believe the bullish outlook remains valid, and these targets are possible in the coming days or weeks.

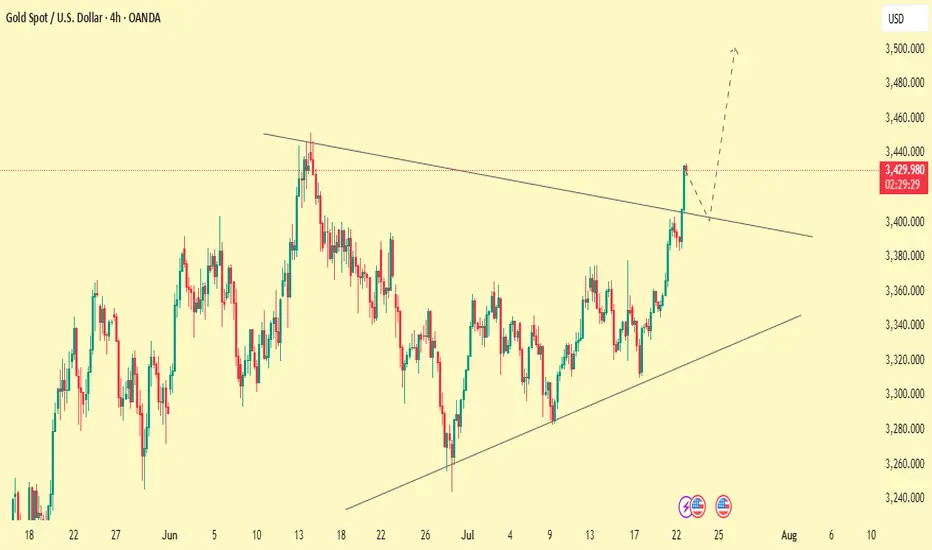
GOLD LONG LONGGold has broken the daily symmetric triangle. If we can get an FVG on daily chart today, tomorrow can give us a great chance, catching this big move on pullback. Look for inverse FVGs on m5 in this gap, if made.
Target: 3900

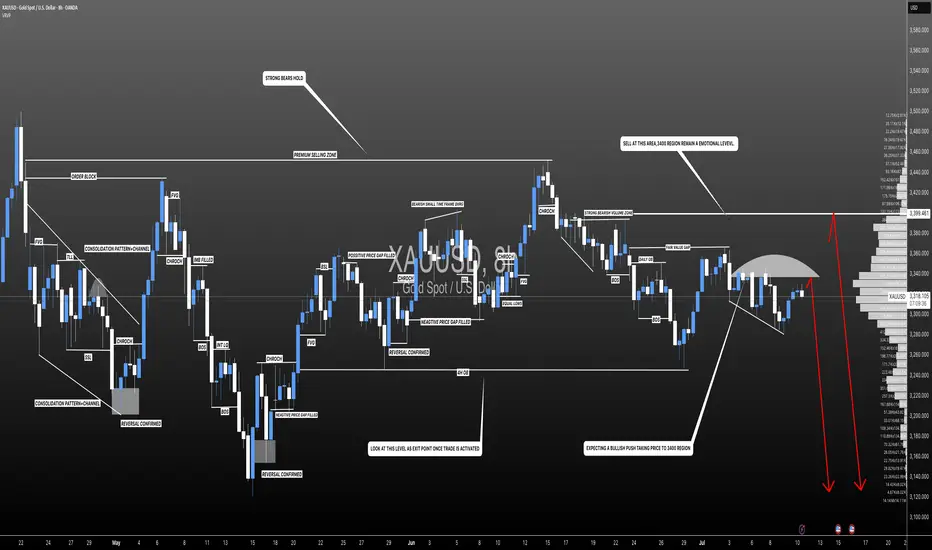
XAUUSD clean to dropXAUSD CLEAN TO DROP for the next 3 weeks
I will bee waiting for this set up and now all that we need is patience

XAUUSDGold is trading inside a rising wedge on the 4H chart — typically a bearish reversal pattern but often bullish during strong trends. Price consistently respects this zone during retracements, offering reliable bounce setups. Each Golden Pocket bounce aligns with a rising trendline, strengthening the support zone.
Price is hovering below upper wedge resistance — suggesting a possible pullback to the lower trendline. Another bounce at Golden Pocket + trendline could offer a long entry. A breakdown below trendline support could shift sentiment toward a deeper correction.
If You Fallow our analysis and enjoy from this analysis
GOLD MARKET ANALYSIS AND COMMENTARY - [Jul 28 - Aug 01]This week, OANDA:XAUUSD prices had a positive start, rising sharply from 3,345 USD/oz to 3,439 USD/oz because investors were concerned about the risk of financial market instability when US President Donald Trump continuously pressured the FED Chairman to reduce interest rates, and there were even rumors of the Fed chairman resigning.
However, the upward momentum in gold prices was not maintained when the US continuously reached trade agreements with partners such as Japan, Indonesia, Philippines..., cooling down the trade war. This caused gold prices to drop sharply for three consecutive trading sessions, at one point the gold price dropped to 3,325 USD/oz and closed at 3,336 USD/oz.
Trade war worries are starting to subside. Therefore, we continue to witness a shift of investment capital flows from gold to risky assets such as stocks..
Notably, this week is the fourth time gold prices broke the $3,400 threshold but did not stay above this level.
Next week, in addition to the FED meeting, the market will also receive information about US non-agricultural employment (NFP) data. If this index falls stronger than expected, it will further strengthen expectations that the FED will continue to keep interest rates at the current level in upcoming meetings, causing gold prices to drop even more sharply next week.
📌In terms of technical analysis, the three crows pattern (3 long red candles) appeared on the D1 chart, showing that sellers were still in control throughout the past 3 trading sessions without much buying power. This technical pattern often suggests that gold prices may be shifting from their recent upward trajectory into a more prolonged period of decline. This technical signal also quite coincides with the context of many fundamental factors, such as geopolitical conflicts, trade wars, low physical gold demand in the summer... no longer strongly supporting gold prices as before. However, according to many experts, if the gold price drops sharply, it will be a good opportunity to buy, because the gold price is forecast to still increase strongly in the long term.
On the H4 chart, gold price may continue to adjust down below the 3,285 USD/oz mark, before recovering again. Meanwhile, the 3,450 USD/oz area is still a strong resistance level for gold prices next week.
Notable technical levels are listed below.
Support: 3,310 – 3,300 – 3,292USD
Resistance: 3,350 – 3,371 – 3,400 – 3,430USD
SELL XAUUSD PRICE 3383 - 3381⚡️
↠↠ Stop Loss 3387
BUY XAUUSD PRICE 3316 - 3318⚡️
↠↠ Stop Loss 3312
Gold Bulls Back in Control as Trump Pressures Fed for Rate CutsHey Realistic Traders!
President Trump is ramping up pressure on the Fed to cut interest rates , saying the U.S. is falling behind countries with looser policies. As several Fed officials begin to shift their stance, expectations for rate cuts are growing. That’s putting pressure on the dollar and giving gold a fresh boost.
We’ll take a closer look at what this means for OANDA:XAUUSD (Gold) through technical analysis and explore its upside potential.
Technical Analysis
On the 4-hour chart, Gold has moved above the EMA-200, signaling a shift in momentum to the upside. Price has also broken out of a Descending Broadening Wedge (DBW) pattern, which often indicates the start of a bullish trend.
The breakout was confirmed by a Bullish Marubozu candle, reflecting strong buying pressure. To add further confirmation, the MACD has formed a bullish crossover, reinforcing the upward momentum.
Looking ahead, the first target is seen at 3417. If reached, a minor pullback toward the historical resistance zone (green area) may occur, with a potential continuation toward the second target at 3500.
This bullish outlook remains valid as long as the price stays above the stop-loss level at 3271 . A break below this level would invalidate the setup and shift the outlook back to neutral.
Support the channel by engaging with the content, using the rocket button, and sharing your opinions in the comments below.
Disclaimer: "Please note that this analysis is solely for educational purposes and should not be considered a recommendation to take a long or short position on XAUUSD.

XAUUSD:Swing Sell Is Highly Likely! Get ReadyWe expect a smooth drop in gold prices, with prices potentially dropping around the 3250 area. Use Accurate Risk Management.
Please like and comment!
Team Setupsfx_
XAUUSD: Bearish Bias SetupI am watching for a possible reversal in XAUUSD, predicting a rejection with a downside target around 3.300.
This downside target is reasonable based on this setup, as it is based on a previous bullish move, from which price could find support and bounce, or break below, and the downside momentum could start to continue down.
I am just sharing my thoughts on the chart, this is not financial advice. Always confirm your setup and manage your risk accordingly.

"XAU/USD Hits Major Demand – Is a Relief Rally Brewing?"🟡 XAU/USD (Gold) – Demand Zone Rejection in Play | Bullish Correction Ahead?
Timeframe: 30-Minute | Date: July 25, 2025
Created by: AllyPipsExpert
Indicators: Ichimoku Cloud, BOS (Break of Structure), Dynamic S/R, Trendlines
---
🔍 Technical Analysis & Key Insights:
🔸 1. Market Recap – Distribution & Downtrend Confirmation:
After the Break of Structure (BOS) near 3385, gold confirmed a bearish reversal following the distribution phase at the top resistance zone around 3445–3460.
Bearish momentum was sustained by a descending trendline, paired with a bearish Kumo (Ichimoku cloud) crossover.
🔸 2. Major Zone Tagged – Key Demand Area Tested:
Price has now reached the critical demand block at 3320–3340, a zone that previously initiated bullish impulse on July 18–19.
The current bullish projection (in blue) reflects potential short-term recovery or correction phase, following oversold conditions and historical support strength.
🔸 3. Bullish Reversal Potential – Short-Term Retracement?
The blue arrow reflects a likely bullish retracement toward 3360–3380, aligning with trendline retest and potential Kumo rejection.
Expect sellers to re-enter if price retests former BOS/imbalance zone, creating scalp or swing sell setups on confirmation.
---
🔧 Confluences & Technical Highlights:
Confluence Point Description
Demand Zone Strong previous accumulation at 3320–3340
BOS Retest Area Key liquidity level now acting as resistance
Ichimoku Cloud Price below cloud = bearish bias maintained
Descending Trendline Reinforces bearish structure unless broken
Price Action Rejection wick at demand + potential short squeeze
---
🎯 Trade Outlook:
🧭 Bias: Short-Term Bullish Rebound → Long-Term Bearish Continuation
🟩 Support: 3320 – 3340
🟥 Resistance: 3360 – 3385 (BOS & Trendline zone)
🔁 Scenario: Bounce → Retest → Continuation lower (unless breakout confirmed)
---
📘 Why This Chart Could Be Featured:
✅ Multi-layered Analysis: BOS, zones, cloud, price action, and psychological zones used together.
✅ Forward-Looking: Projects the next logical market reaction instead of just explaining the past.
✅ Clean, Structured, Educational: Layout and visuals guide the viewer through logical trade steps.
✅ Value-Packed: Provides actionable levels and flexible scenarios — helpful to traders of all levels.

Gold Continues Mild Uptrend – Watching for Reaction at $3351📊 Market Overview:
Gold maintained its bullish momentum during the Asian–European session, rising from $3330 to $3344. A slightly weaker USD and safe-haven demand supported prices. However, price is now approaching a key resistance zone, where technical rejection may occur in the U.S. session.
________________________________________
📉 Technical Analysis:
• Key near-term resistance: $3345 – $3351
• Stronger resistance (higher zone): $3360 – $3366 and $3374
• Nearest support: $3335 – $3332
• Stronger support (lower zone): $3322 – $3315
• EMA 09 (H1): Price is above EMA09 → confirms short-term uptrend
• Candlestick / Volume / Momentum:
• Price is consolidating in an ascending triangle
• A breakout above $3345 may target $3360+
• RSI remains below overbought; volume is stable → room for continuation
________________________________________
📌 Outlook:
If gold holds above $3335 and breaks above $3351, the uptrend could extend toward the $3366–$3374 zone. However, failure to break $3351 followed by a drop below $3332 could lead to a deeper pullback toward $3315.
💡 Recommended Trading Strategies:
BUY XAU/USD: $3318 – $3315
🎯 TP: 40/80/200 PIPS
❌ SL: $3321
SELL XAU/USD: $3360 – $3363
🎯 TP: 40/80/200 PIPS
❌ SL: $3357

XAU/USD | Get Ready for Another Bullrun, $3500 is Coming!By analyzing the gold chart on the 4-hour timeframe, we can see that on Friday, the price finally closed at $3350. After the market opened today, we saw an initial correction down to $3339 (exactly as expected), followed by another strong bullish wave, pushing gold above $3400 just moments ago. If the price stabilizes below $3398 within the next 4 hours, I expect a potential rejection toward $3388 and $3377. However, if gold holds above $3400, the next target will be $3409. Key demand zones are $3365–$3375, and levels $3355, $3344, and $3336.
Please support me with your likes and comments to motivate me to share more analysis with you and share your opinion about the possible trend of this chart with me !
Best Regards , Arman Shaban

Pending Orders Are Not Set in Stone – Context Still MattersIn a previous educational article, I explained why I almost never trade breakouts on Gold.
Too many fakeouts. Too many emotional traps.
Instead, I stick to what works:
• ✅ Buying dips
• ✅ Selling rallies
But even these entries — placed with pending orders — are not automatic.
Because in real trading, price is not just a number — it’s a narrative.
And if the story changes, so should the trade.
________________________________________
🎯 The Setup – Buy the Dip Around 3400
Let’s take a real example from yesterday.
In my analysis, I mentioned I would look to buy dips near 3400, a former resistance now acting as support.
Price dropped to 3405, just a few points above my pending buy at 3402.
We saw a clean initial bounce — confirming that short-term support was real.
But I missed the entry by 30 pips.
So far, so good.
But here’s the important part — what happened next changed everything.
________________________________________
🧠 The Rejection Shifted the Entire Story
The bounce from 3405 was immediately sold into at 3420, a newly formed short-term resistance (clearly visible on the 15-minute posted chart).
After that, price started falling again — heading back toward my pending order.
📌 At that point, I cancelled the order. Why?
Because the context had changed:
• Bulls had tried once — and failed at 3420
• Sellers were clearly active and waiting above
• A second drop into my level wouldn’t be a clean dip — it would be retest under pressure.
The market was no longer giving me a “buy the dip” setup.
It was showing me a failed recovery. That’s a very different trade.
________________________________________
💡 What If It Had Triggered?
Let’s imagine that price had hit 3402 first, triggering my order.
Then rebounded, failed at 3420, and started dropping again.
Even then, I wouldn’t hold blindly.
Once I saw the rejection at 3420, I would have understood:
The structure had shifted.
The bullish case is weakening.
Exit early — breakeven or small controlled loss.
________________________________________
🔁 Sequence > Level
This is the most important principle:
• ✅ First down, then up = healthy dip → shows buyers are still in control
• ❌ First up, then down = failed breakout → shows selling pressure is stronger
Two scenarios. Same price. Opposite meaning.
That’s why you should look for:
Not just where price goes — but how it gets there.
________________________________________
🔒 Pending Orders Are Conditional
Many traders treat pending orders like traps:
“Just let price come to my level, and I’m in.”, but you should refine a little
✅ Pending orders should be based on a conditional expectation
❌ Not a fixed belief that the zone must hold
If the market tells a different story, remove the order.
No ego. No drama. Just process.
________________________________________
📌 Final Thought
Trading isn’t just about catching a price.
It’s about understanding price behavior.
First down, then up = strength.
First up, then down = weakness.
Let the market show its hand — then decide if you want to play.
Disclosure: I am part of TradeNation's Influencer program and receive a monthly fee for using their TradingView charts in my analyses and educational articles.
XAUUSD position takenI have taken a trade in XAUUSD at 3340 ( Target : 3700, SL : 3296).
Why I have taken this trade ?
It has made an ascending triangle pattern .
It is near its support line.
If you build a fixed range volume profile you will find that
it is at Point Of Control.

XAUUSD – The assassin returnsGold is showing a weak reaction around the 3,375 zone — a previous supply area — with RSI dipping into oversold territory but failing to bounce significantly. The chart reveals layered FVG traps, hinting at a potential -1.5% drop toward 3,324 within the next 18 hours.
Bearish catalyst: The U.S. jobless claims have dropped to a 3-month low → labor market remains strong → Fed likely to keep interest rates high → stronger USD, weaker gold.
Preferred setup:
SELL if price gets rejected at 3,375
SL: 3,390
TP: 3,324 – 3,310


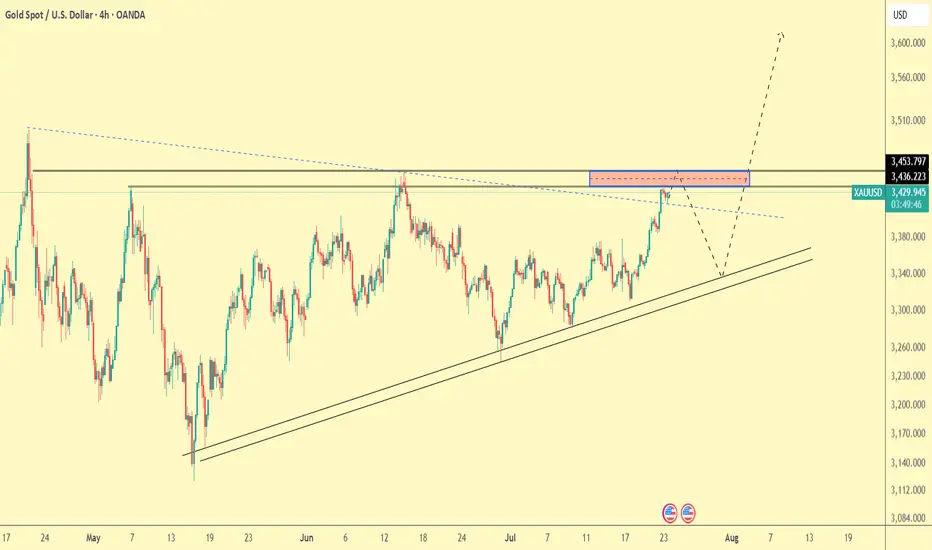
GOLD → Consolidation before the next jump to 3450?FX:XAUUSD continues to rally, with the price updating its local high to 3438 and moving into consolidation, possibly for another jump...
After hitting a five-week high of $3,438, traders are taking a break. Optimism is fuelled by Trump's statements about the largest deal with Japan and negotiations with Canada, but uncertainty about the details of the agreements and political instability in Japan are keeping caution in check. The market is waiting for further signals on trade and political issues, which remain key factors for gold.
Technically, the dollar continues to fall, which generally supports gold. But! Gold is approaching strong resistance at 3445-3450, where growth may be temporarily halted.
Resistance levels: 3433, 3446
Support levels: 3416, 3401, 3375
As part of a local correction, gold may test consolidation support or 0.5-0.7f before continuing to rise. There are quite a few orders in the 3433-3446 zone, and it will be difficult to break through this area to reach the target. Consolidation before this level may help the rise to continue.
Best regards, R. Linda!

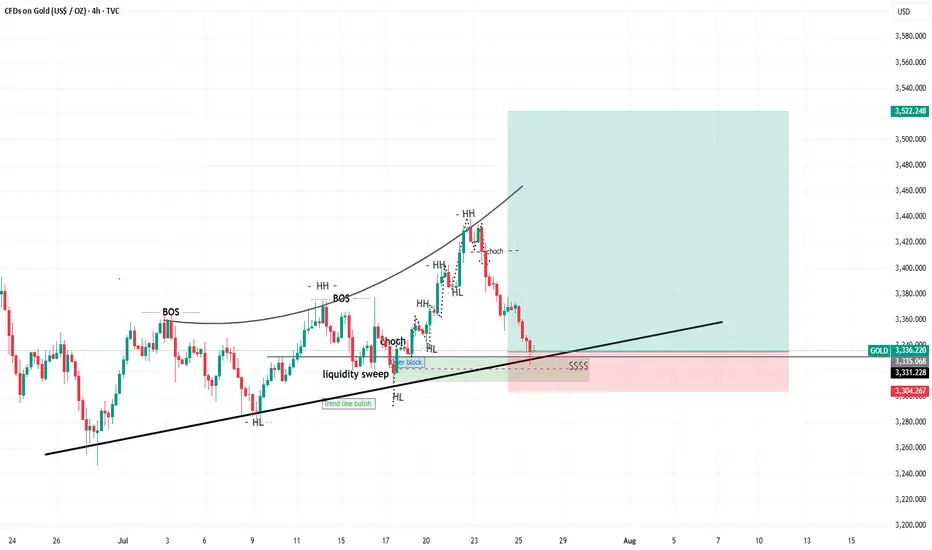
xauusd i think buy from here its not a bad ideatrend lines oder block fvg liquidity sweep choch higher high higher low.
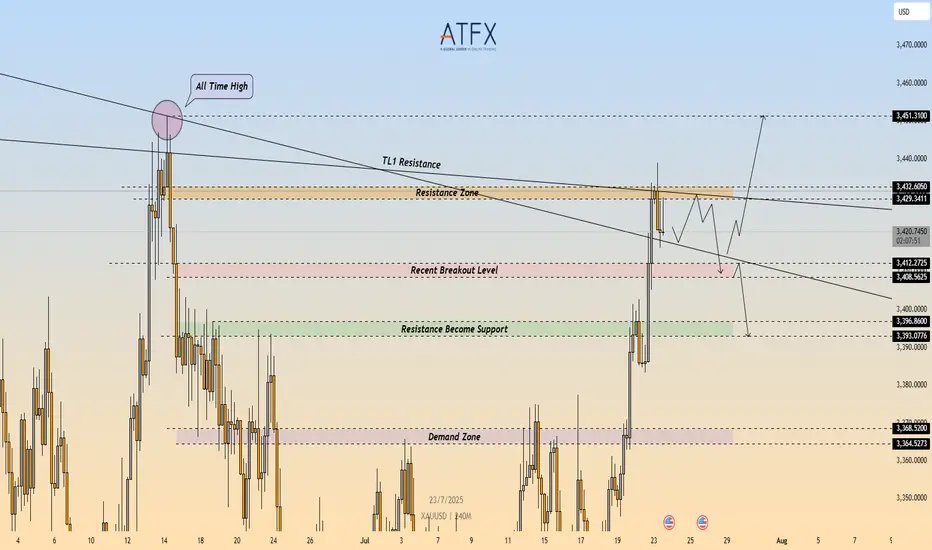
XAU/USD: Bearish Rejection at $3,432 – Short Setup in Play🔴 XAU/USD – Bearish Rejection at Key Resistance Zone ($3,432)
🔍 Technical Outlook
Gold (XAU/USD) failed to break through the $3,429–$3,432 resistance zone, which aligns with a descending trendline (TL1) and prior swing high. The rejection from this confluence zone is reinforcing bearish pressure, with price now carving out lower highs on the 4H timeframe.
A clean break below $3,412 would confirm bearish continuation and open the door toward the $3,400 area, followed by the demand zone at $3,368–$3,365.
🔻 Short Setup
Entry: 3,432
Stop Loss: 3,436
Take Profit 1: 3,412
Take Profit 2: 3,396
R\:R Ratio: ≈ 1 : 6.95
Invalidation: Close above 3,436
📌 Key Levels
Resistance: 3,429 – 3,432
Support 1: 3,412
Support 2: 3,368 – 3,365
Trendline: Long-term descending resistance acting as ceiling
📘 Summary
Gold remains capped beneath a critical resistance cluster. The rejection around $3,432 could trigger a deeper pullback toward $3,396, especially if sellers push price below $3,412. Bearish bias remains valid while price holds under the trendline.
📉 Bias: Bearish
📈 Confirmation Trigger: Break below $3,412
⚠️ Invalidation Level: Above $3,436
GOLD (XAUUSD): Bullish Move Ahead?!
I think that Gold is going to rise soon.
The price is now entering a strong demand area
based on a horizontal support and a rising trend line.
The price may pull back to 3376 level.
❤️Please, support my work with like, thank you!❤️
I am part of Trade Nation's Influencer program and receive a monthly fee for using their TradingView charts in my analysis.

XauusdThe price enters the supply zone and the possibility of the gold price falling to the specified range

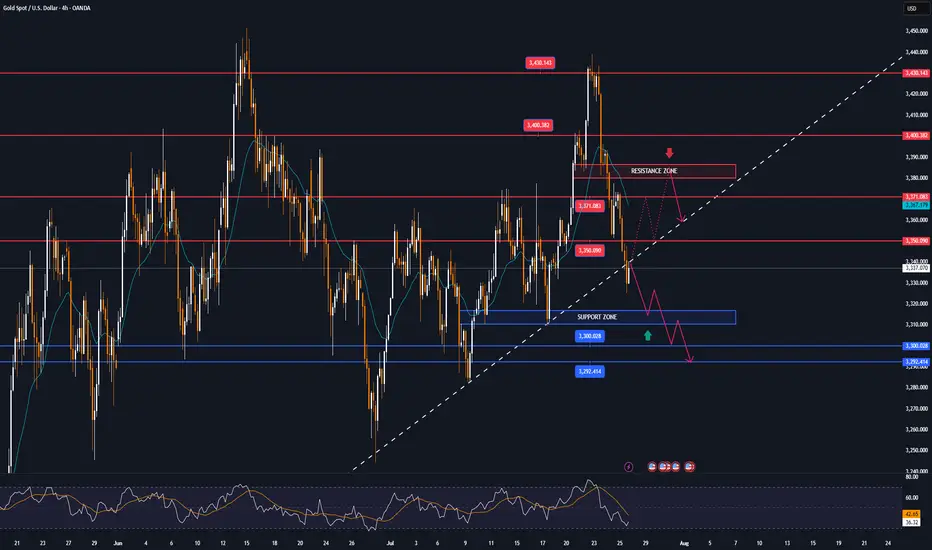
Gold Trade Plan 23/07/2025Dear Traders,
What we see on the chart is that the price is trying to reach the previous pivot around the 3450 area. I expect a correction from this level towards the 3370 area.
Regards,
Alireza!
XAU/USD) bullish the support Read The captionSMC Trading point update
Technical analysis of (XAU/USD) on the 4-hour timeframe, indicating a potential bounce from a key trendline support within a rising channel.
---
Analysis Summary
Pair: XAU/USD (Gold Spot vs. USD)
Timeframe: 4H
Current Price: 3,338.715
Bias: Bullish rebound within ascending channel
---
Key Technical Elements
1. Ascending Channel:
Price has been respecting a well-defined rising channel, bouncing between support and resistance levels.
2. Key Support Zone:
The yellow highlighted area marks a critical support level and lower boundary of the channel.
Also intersects with the trendline, strengthening the potential for a bounce.
3. 200 EMA (Dynamic Support):
The 200 EMA at 3,343.616 lies just below current price, acting as a dynamic support level.
4. RSI (14):
RSI is around 34.93, nearing the oversold zone, suggesting a buying opportunity may be near.
---
Target Points
First Target: 3,402.099
Second Target: 3,446.661
---
Trade Idea
Direction Entry Zone Stop-Loss Target Zones
Buy 3,330–3,345 Below 3,320 3,402 / 3,446
Mr SMC Trading point
---
Summary
Gold is currently testing a key support level and ascending trendline. If price holds above this area, we can expect a bullish rebound toward 3,400–3,446 levels, aligning with the upper channel resistance.
Please support boost 🚀 this analysis)
