XAUUSD: Market analysis and strategy for July 24.Gold technical analysis:
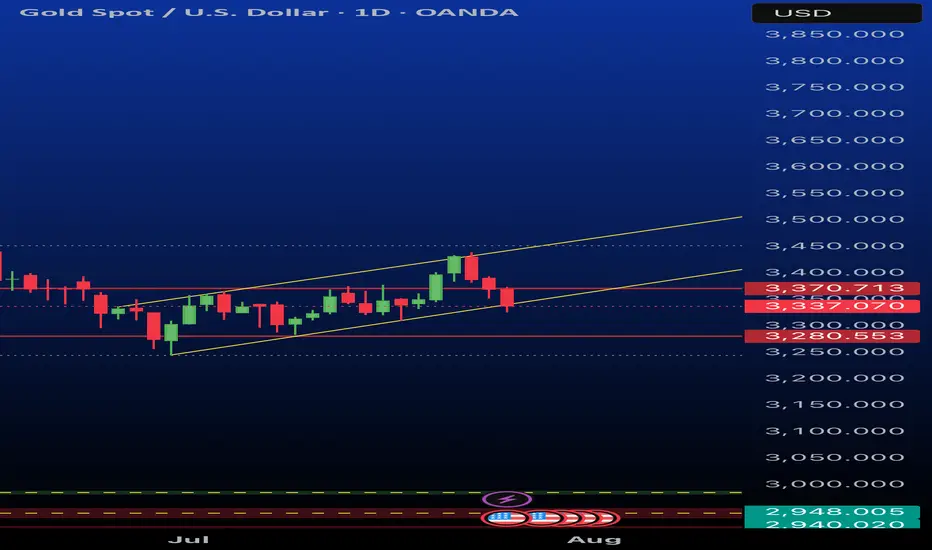
Daily chart resistance 3440, support 3310
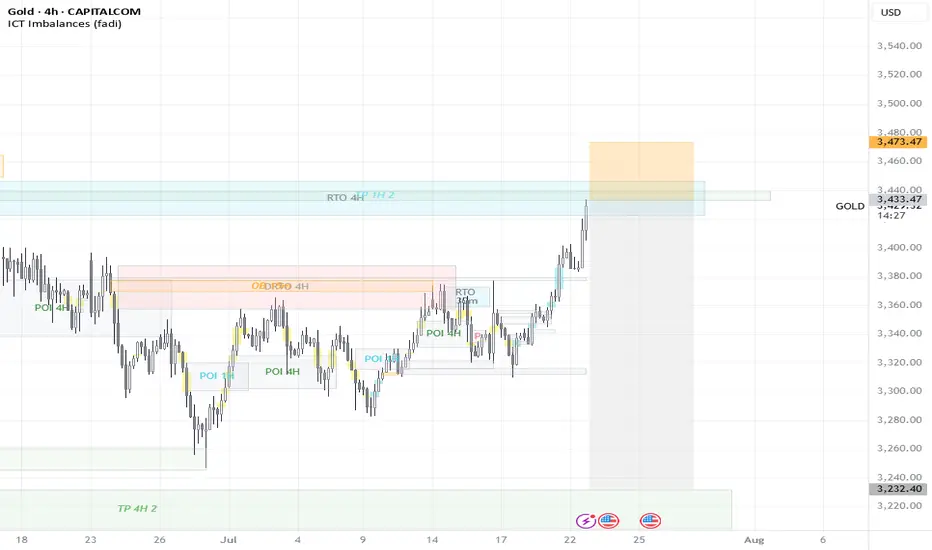
4-hour chart resistance 3390, support 3340
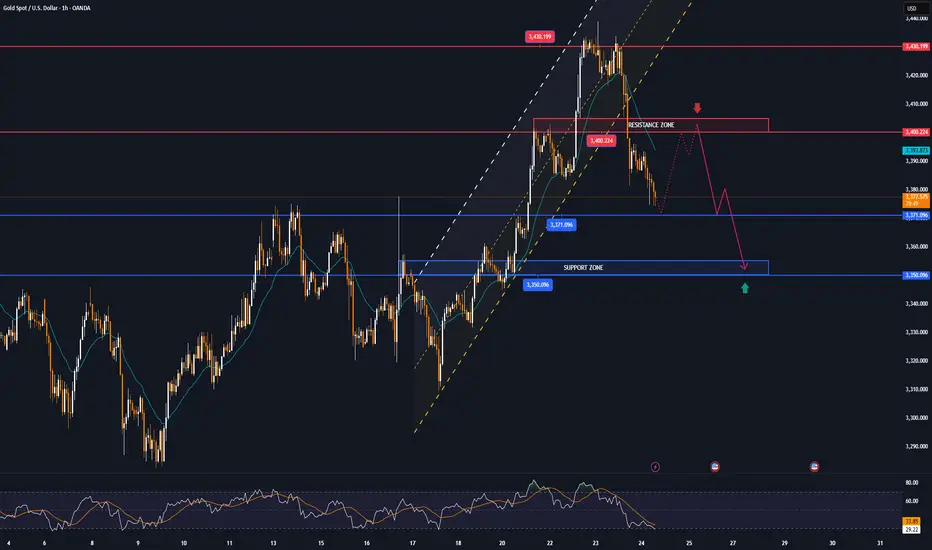
1-hour chart resistance 3375, support 3360.
Yesterday, according to news, the United States and the European Union were close to reaching a trade agreement, which led to the recent risk aversion sentiment to subside, and the bulls took profits. The gold price has fallen by nearly $80 from its peak.
From the current power comparison, the bears are temporarily dominant. Since yesterday, the candlestick chart of the 4-hour chart has completed 6 candles today (2 of which are sideways and 4 are falling sharply). It is expected that it will not rebound until today's NY market trading session.
Gold may reach 3359 or even 3340. At that time, we will observe the stabilization of the candlestick chart. Once the downward momentum is exhausted and it starts to close higher, we can buy. The upper pressure is 3380/3400.
Buy: 3359near
Buy: 3340near
Sell: 3380near
Sell: 3400near
GOLDCFD trade ideas

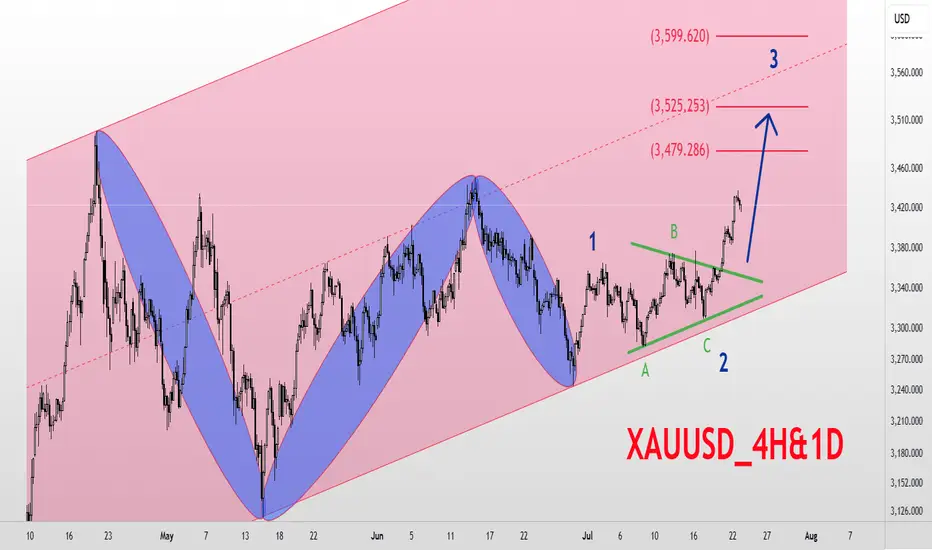
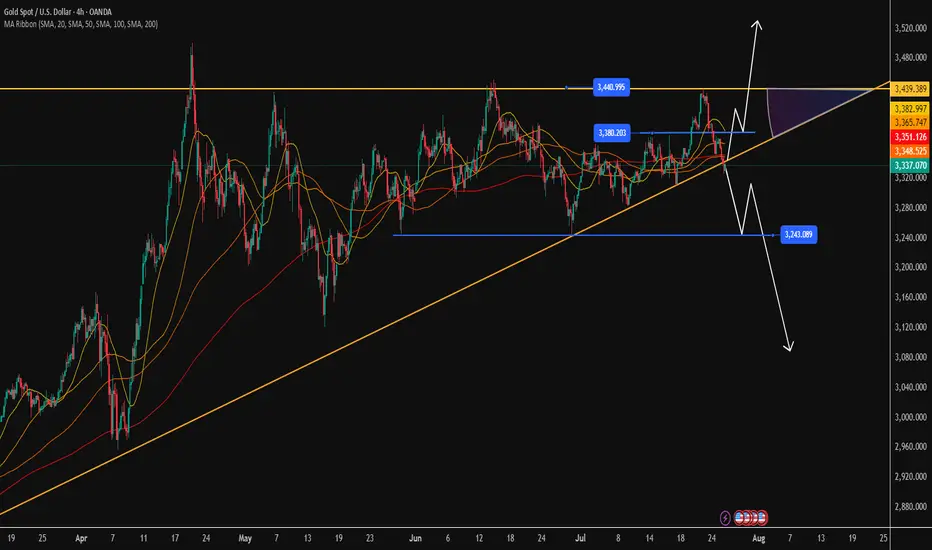
XAUUSD_4H&1D_BuyGold Analysis 4-hour and Daily Medium-term Time Frame Elliott Wave Analysis Style Gold is in a long-term ascending channel Based on Elliott Waves, the market is expected to have entered a new upward trend and has broken waves 1 and 2 and is currently in a large wave 3. The targets for wave 3 are $3480, $3525, and $3600, respectively. Good luck and wish everyone abundance and wealth 💚💚💚
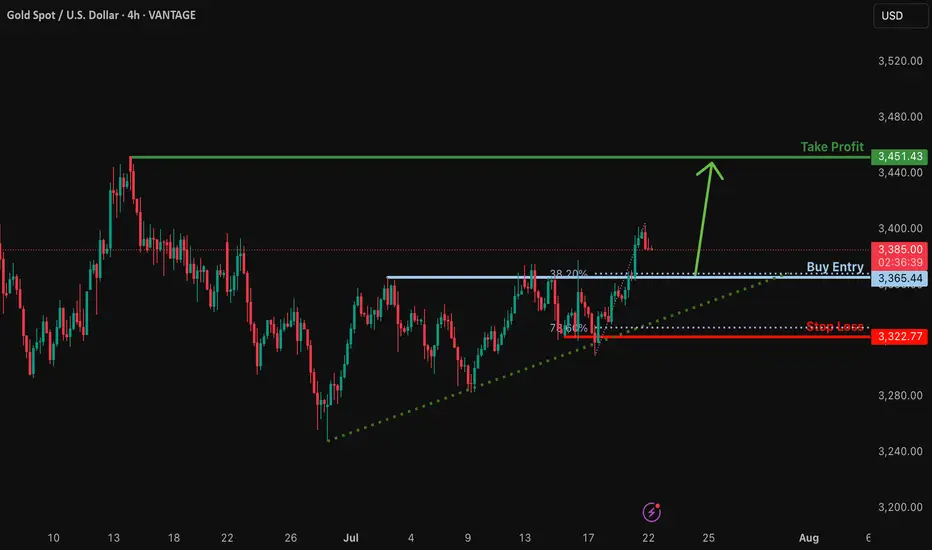
Bullish bounce off major support?The Gold (XAU/USD) is falling towards the support level which is a pullback support and could bounce from this level to our take profit.
Entry: 3,365.44
Why we like it:
There is a pullback support that lines up with the 38.2% Fibonacci retracement.
Stop loss: 3,322.77
Why we like it:
There is a pullback support that is slightly below the 78.6% Fibonacci retracement.
Take profit: 3,451.43
Why we like it:
There is a pullback resistance.
Enjoying your TradingView experience? Review us!
Please be advised that the information presented on TradingView is provided to Vantage (‘Vantage Global Limited’, ‘we’) by a third-party provider (‘Everest Fortune Group’). Please be reminded that you are solely responsible for the trading decisions on your account. There is a very high degree of risk involved in trading. Any information and/or content is intended entirely for research, educational and informational purposes only and does not constitute investment or consultation advice or investment strategy. The information is not tailored to the investment needs of any specific person and therefore does not involve a consideration of any of the investment objectives, financial situation or needs of any viewer that may receive it. Kindly also note that past performance is not a reliable indicator of future results. Actual results may differ materially from those anticipated in forward-looking or past performance statements. We assume no liability as to the accuracy or completeness of any of the information and/or content provided herein and the Company cannot be held responsible for any omission, mistake nor for any loss or damage including without limitation to any loss of profit which may arise from reliance on any information supplied by Everest Fortune Group.
XAUUSD Monthly Technical OutlookMarket Structure Overview:
• The chart reveals consistent Breaks of Structure (BOS) to the upside, confirming a strong bullish market trend.
• Price has successfully reclaimed and retested the strong resistance zone (~3390–3400), which now acts as new support.
• A series of higher highs and higher lows show clear bullish intent, supported by sustained bullish momentum after each correction.
⸻
📈 Volume & Price Action:
• The Volume Profile (VRVP) on the left shows strong historical accumulation near the current breakout zone.
• After the breakout from resistance, the price retested this zone—validating it as support—and is expected to continue its bullish leg toward $3,500, the next psychological and technical target.
⸻
📍 Key Levels:
• Support Zone: $3,375 – $3,390 (previous resistance turned support)
• Immediate Resistance: $3,425
• Target Level: $3,500 (Monthly High Projection)
⸻
📘 Educational Note:
• This setup aligns with classic market structure theory: BOS + Retest + Continuation.
• The pullback into the breakout zone is a textbook bullish continuation signal often used in institutional trading strategies.
• Traders watching this pattern should combine it with confirmation entries such as bullish engulfing candles, FVGs, or order block rejections for safer entries.
⸻
🎯 Projection:
• As long as the price holds above $3,375, the bullish scenario toward $3,500 remains valid.
• Expect possible consolidation or minor pullbacks before continuation.
⸻
📌 Disclaimer:
This analysis is for educational purposes only and does not constitute financial advice. Always do your own research before entering the market.

Still a chance for gold bulls?
💡Message Strategy
The gold market was volatile this week, and gold prices ultimately closed lower for the week.
Gold prices have failed to stabilize above $3,400 an ounce after a bullish breakout. The technical outlook highlights the recent indecision of gold bulls. Looking ahead to next week, the Fed's policy statement and US-China trade talks could trigger the next big move for gold.
These important factors may trigger the market next week
1. The Fed will announce its monetary policy decision after its policy meeting on July 29-30.
Before the Fed meeting, the U.S. Bureau of Economic Analysis will release its first estimate of annualized growth in gross domestic product (GDP) in the second quarter.
2. Next Friday, the U.S. Bureau of Labor Statistics will release the July employment report.
If the non-farm payrolls (NFP) increase by more than 100,000, it may indicate that the labor market is in good enough condition for the Fed to prioritize controlling inflation and support the dollar when making policies.
If the new non-farm payrolls data reaches or falls below 70,000, the dollar may find it difficult to find demand before the end of next week and help gold gain bullish momentum.
3. Market participants will be closely watching the headlines of the US-China negotiations.
If the two sides make further progress in trade and economic relations, risk flows may dominate the actions of financial markets, making it difficult for gold to find demand.
📊Technical aspects
The short-term technical outlook highlights the hesitation among gold buyers. The daily chart shows that the relative strength index (RSI) remains just below 50, and gold is struggling to move away from both the 20-day simple moving average (SMA) and the 50-day SMA after breaking above both levels earlier this week.
If the price of gold falls to the key support level of $3,310 and fails to break down (trend line support/Fibonacci 61.8% retracement level), it will force a large number of shorts to exit the market and may further test the $3,340 range (psychological level/Fibonacci 76.4% retracement level).
Combined with the current trend, the downward momentum of gold has weakened, and it is seeking support to restart the long position
💰Strategy Package
Long Position:3310-3320,SL:3290,Target: 3340

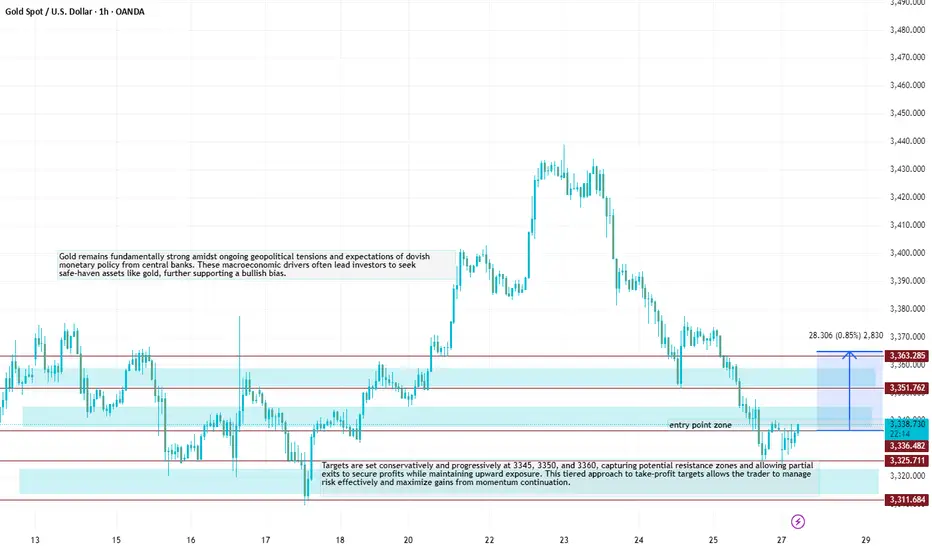
XAUUSDXAU/USD Trade Analysis – buy Setup
📍 Trade Idea: buy Gold (XAU/USD)
Entry Zone: 3338/3336
Stop Loss: 3326..00/Above key resistance zone)
Take Profit Levels:
🎯 TP1: 3345
🎯 TP2: 3350
🎯 TP3: 3360
Targets are set conservatively and progressively at 3345, 3350, and 3360, capturing potential resistance zones and allowing partial exits to secure profits while maintaining upward exposure. This tiered approach to take-profit targets allows the trader to manage risk effectively and maximize gains from momentum continuation.
Gold remains fundamentally strong amidst ongoing geopolitical tensions and expectations of dovish monetary policy from central banks. These macroeconomic drivers often lead investors to seek safe-haven assets like gold, further supporting a bullish bias.
XAUSD We expecting this week the gold will be bearish becouse of the braking trend line and I wish you guys will took advantage of this and thank me latter

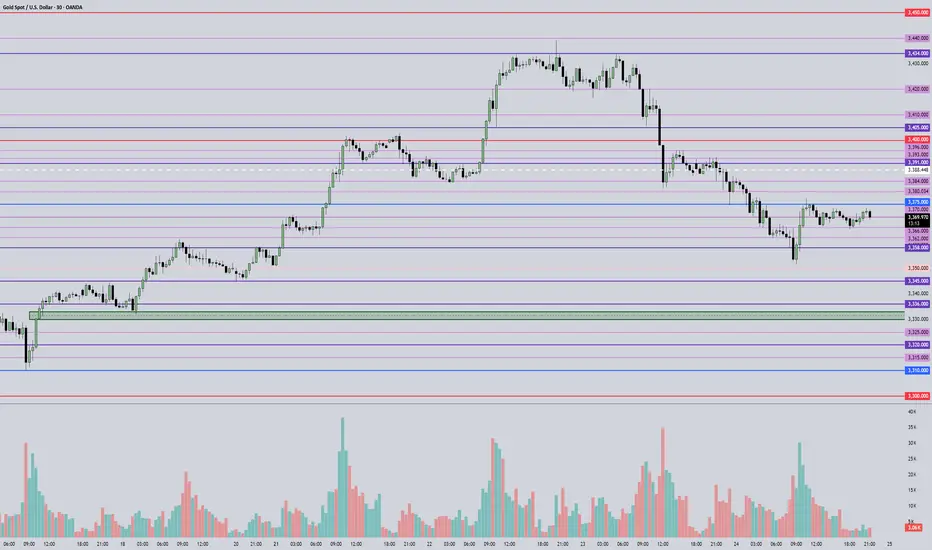
July 25, 2025 - XAUUSD GOLD Analysis and Potential OpportunitySummary:
The downtrend continues, with 3350 providing some support — though not strong enough to indicate a solid reversal. Watch for a retest of this level; if 3350 breaks, bearish momentum may resume. For now, price is ranging between 3365–3375. Continue to trade the range with a sell-high, buy-low mindset.
• Break below 3365 → look to short on pullbacks.
• Break above 3375 → switch to buying on dips.
🔍 Key Levels to Watch:
• 3434 – Resistance
• 3420 – Resistance
• 3405 – Key resistance
• 3400 – Psychological level
• 3384 – Resistance
• 3375 – Key resistance
• 3364 – Support
• 3358 – Support
• 3345 – Strong support
• 3336 – Support
• 3330 – Support
📈 Intraday Strategy:
• SELL if price breaks below 3365 → target 3362, then 3358, 3351, 3345
• BUY if price holds above 3375 → target 3380, then 3385, 3390, 3396
👉 If you find this helpful or traded using this plan, a like would mean a lot and keep me motivated. Thanks for the support!
Disclaimer: This is my personal view, not financial advice. Always use proper risk control.
XAUUSDHello Trader ❤
I expect the price to start growing from these two areas🚀
The stop of this scenario is also visible in the image above❌
I hope you make the most of it...

Current Gold Short tradeI'm currently trading gold short from 3430. I have taken partials and my SL are at BE.
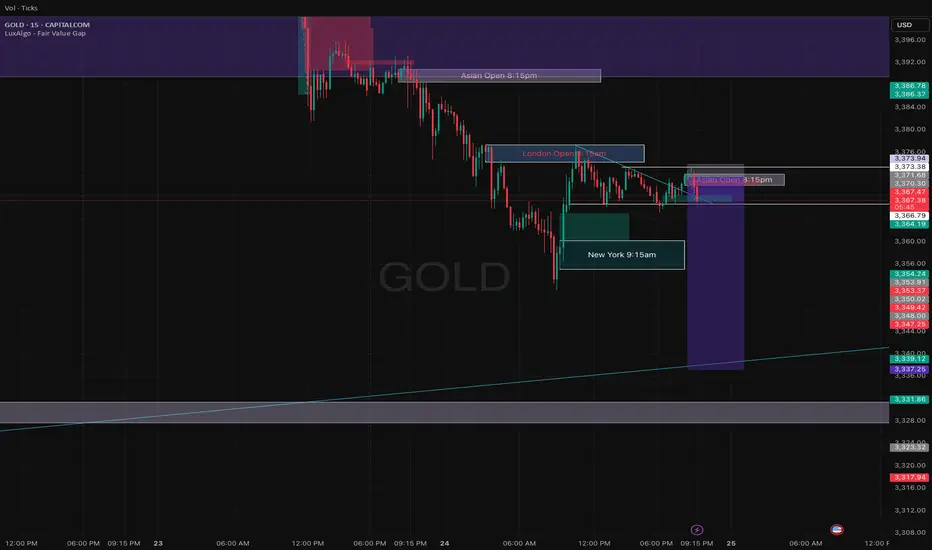
Here we have 2 scenarios at Support.
Heavy volume selloff means there’s fuel for more downside.
If price consolidates here and keeps making lower highs, or retests 3,376 from below and rejects, that’s a short re-entry/continuation signal.
Odds:
Much higher at the moment. The last impulse was violent, and buyers have not stepped up yet.
If 3,372 breaks—look to short the retest (classic SR flip) for a move to 3,348 and below.
If you see a slow grind sideways (chop), walk away and wait for the breakout from this zone.
3,376–3,372 Do not long unless reversal candle forms High risk to knife-catch
<3,372 Look for shorts on retest Downside opens up fast
3,389+ Bullish confirmation only Only chase if true reversal

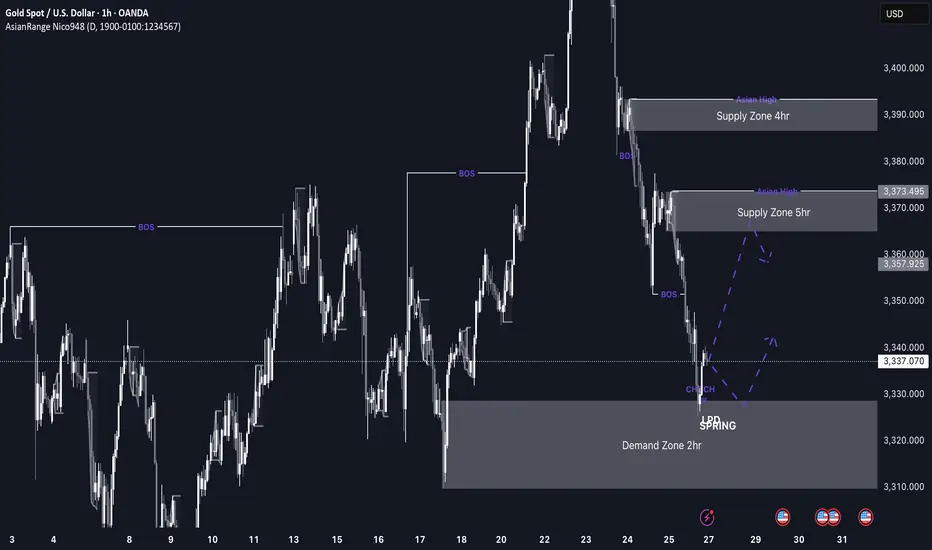
GOLD imminent possible buys up to 3,370 This week’s price action on GOLD is shaping up to be very interesting. After weeks of sustained bearish pressure, price has now entered a discounted 2hr demand zone sitting at a swing low, which makes it a high-probability area for a bullish reaction, especially as markets open.
If we do get the expected bullish reaction from this level, I’ll be watching the 3,370 region, where there’s a clean 5hr supply zone. If price reaches that level, I’ll be looking out for distribution and a potential short setup from there.
Confluences for GOLD Longs:
Price has been very bearish recently, so a retracement is expected
Currently sitting in a discounted 2hr demand zone
The overall long-term trend is still bullish
Early signs of accumulation and bullish reaction from this zone
P.S. If price fails to hold this current demand zone and breaks lower, then bearish momentum may continue. In that case, I’ll look for new long opportunities around 3,290 where a deeper demand zone exists.
Gold Outlook for Today Todays outlook for Gold - I really cant share my strategy, if you want it, just send me a message and I will, It very simple, I think trading is simple, we just over think and complicate things
Completion of rising wedge Gold is currently still holding rising channel along with the swing moves we were on buy at 3410 and my optimal target was 3425-3430 which is achieved now I'm expecting the reversal move!!
What's possible scanarios we have?
▪️I'm looking for sell opportunity from 3430-3435 area by following our structural strategy, also we have previous moves on Rising channel, market always respect its prevoius BOS and my Selling trade target will be 3405 then 3395 in extension.
▪️if H4 candle closing above 3435-3438 this Parallel moves will be invalid.

Gold prices are about to rebound?Gold prices are about to rebound?
Just on Saturday, Trump patted Powell on the shoulder, and those who understand understand.
Cut interest rates quickly!!!
Next week will usher in three major news, and global analysts regard next week as a life-or-death moment that determines the future direction of gold prices.
1: Will the Fed cut interest rates in September?
2: How will the tariff war on August 1 evolve?
3: Major non-agricultural data
The trend of gold prices next week is unpredictable, and every day is accompanied by the impact of policy news.
Volatility will become more and more stimulating.
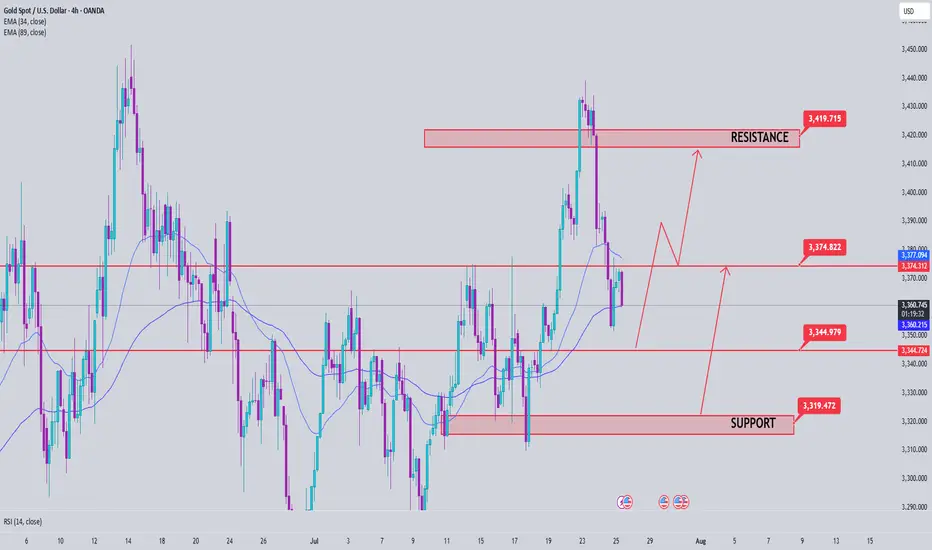
Technical aspect: Gold prices have completed the correction, and I think the bulls are about to counterattack.
As shown in Figure 4h
3330 is an important support level
3440 is a key top area
3360-3380 is a key middle pressure level
We will continue to adopt a low-price long strategy on Monday
Target: 3365-3380-3400-3440-3500+
I firmly believe that next week will be the beginning of a big bull market. Even if it is not, this should be the last chance for bulls to get off the train.
Short-term: $3380-3400 (this week's high resistance).
Medium-term: If it breaks through $3400, it will open the channel to $3500.
Gold operation strategy
Aggressive investors: Buy at the low point of the $3300-3330 range, with a target price of $3380.
Conservative investors: Wait for a breakthrough of $3360 before chasing more, and set the stop loss below 3300.
Conclusion: Gold prices are expected to rebound next week, and the expectation of a rate cut by the Federal Reserve is the core driving force.
Investors are advised to pay attention to non-agricultural data and geopolitical situation, and seize the opportunity to layout at low levels.
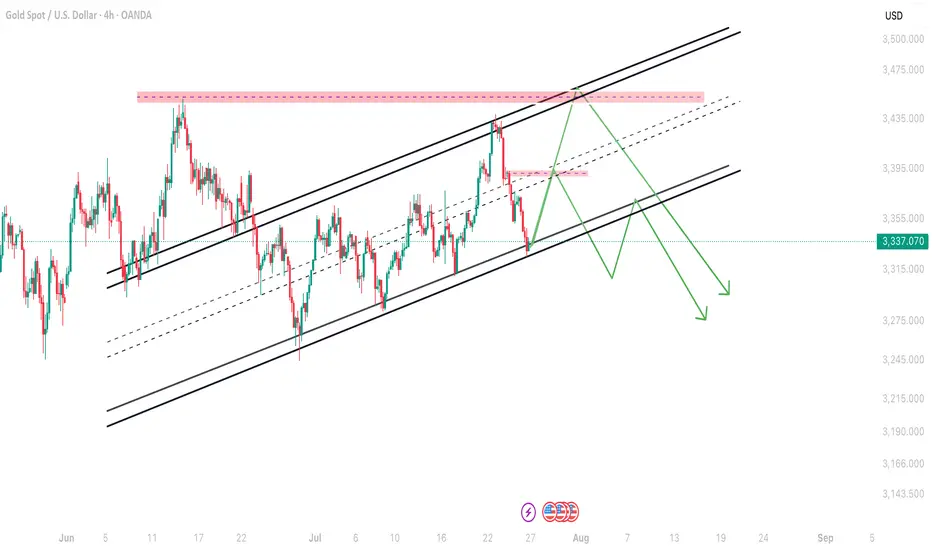
Gold 4H Channel structure modifiedAs you can see gold is moving in a channel in 4H time frame which is little modified as market goes on so according to me next move will be till protected order block i.e 3382-3388 and after that big fall expected and if any candle close above 3384 then 3451 is the next target for gold.
Gold channel Aka RangeJust Lookingg at this weeks price action I think gold will continue to trend in this range
XAUUSD Gold closed bearish and I’ll continue looking for sells. I’d prefer gold to retrace and create a LH and continue selling towards 3310. Last time price was around 3310, it had a massive bullish run so that’ll be the only area I’d sell to unless price breaks that support.

Gold Sell 4hGold ready to sell ... See 4 Hour timeframe to get entry with your own confirmations..get partial entries with your confirmations.. check the fundamental analysis too
Friday Analysis (25/7/2025)Today I explain the update of my position and some of the signs of another waterfall.

From 3,430 USD GOLD falls below 3,400 USD on optimistic newsOANDA:XAUUSD has suffered a sharp sell-off after rising sharply earlier in the week. Media reports said the United States and the European Union were getting closer to reaching a tariff deal, and the news weighed on safe-haven demand.
OANDA:XAUUSD fell below $3,400 an ounce on Wednesday, down more than 1.2%, following news that the United States and the European Union were close to signing a deal similar to the one Washington and Tokyo signed on Tuesday. It is now trading below that key base point.
The European Union and the United States are moving toward a trade deal that could see more EU goods hit with a 15 percent U.S. import tariff, two diplomats said. Earlier, U.S. President Donald Trump reached a trade deal with Japan that would cut auto tariffs to 15 percent.
Optimism about an imminent U.S.-EU trade deal overshadowed a decline in the U.S. dollar. The U.S. dollar index (DXY), which measures the greenback against a basket of six currencies, fell 0.05 percent on the day to 97.160.
U.S. Treasury yields rose, with the 10-year Treasury yield rising to 4.396%. U.S. real yields, calculated by subtracting inflation expectations from nominal yields, rose nearly 4 basis points to 1.994%.
Gold tends to gain in value during times of uncertainty and low-interest-rate environments because gold itself does not generate interest, and in low-interest-rate environments, the opportunity cost of holding gold is relatively low.
U.S., EU near trade deal
The Financial Times reported on Wednesday that the European Union and the United States are close to reaching a trade deal that would impose a 15% tariff on imports from Europe, similar to the one reached between US President Donald Trump and Japan this week.
The Financial Times reported that Brussels is likely to agree to so-called “reciprocal tariffs” to avoid tariffs that Trump has threatened to impose on EU goods of up to 30% from August 1.
“The agreement reached with Japan is clearly extortionate in terms. Most member states are swallowing their anger and are likely to accept the deal,” an EU diplomat said.
The two sides will exempt some products, including aircraft, spirits and medical equipment, from tariffs.
The agreement between the US and Japan has also left Brussels reluctant to accept higher reciprocal tariffs to avoid a damaging trade war, according to the Financial Times.
Technical Outlook Analysis OANDA:XAUUSD
On the daily chart, after gold reached its target at $3,430, it failed to break above this important resistance level and fell slightly. The decline brought gold back to test the support confluence area, which is the location of the 0.236% Fibonacci retracement with the lower edge of the price channel. And with the current position, gold still technically has enough conditions for a possible increase in price.
Specifically, gold is still in/above the supports from the short-term price channel, the long-term rising price channel and the support from the EMA21, as long as gold is still trading above the EMA21, it still has a bullish outlook in the short term. On the other hand, the short-term target is still at 3,430 USD, while once the 3,430 USD level is broken, it will provide the possibility of further upside with the next target at around 3,450 USD in the short term, more than the all-time high.
RSI remains above 50, far from the 80 – 100 area (overbought area). Showing that there is still a lot of room for upside ahead.
During the day, the technical outlook for gold prices continues to favor upside and notable positions will be listed as follows.
Support: 3,371 – 3,350 USD
Resistance: 3,400 – 3,430 – 3,450 USD
SELL XAUUSD PRICE 3421 - 3419⚡️
↠↠ Stop Loss 3425
→Take Profit 1 3413
↨
→Take Profit 2 3407
BUY XAUUSD PRICE 3354 - 3356⚡️
↠↠ Stop Loss 3350
→Take Profit 1 3362
↨
→Take Profit 2 3368
XAUUSD NEW OUTLOOKXauusd buy from 3360
Tp1 3370
Tp2 3380
Tp3 3390
Stope Lose 3350
TRADE AT YOUR OWN RISK

Gold price analysis July 25Gold Analysis – D1 Uptrend Still Maintains, But Needs New Momentum
Yesterday’s trading session recorded a D1 candle closing above the Breakout 3363 zone, indicating that buying power in the US session is still dominant. This implies that the uptrend is still being maintained, although the market may need a short-term technical correction.
In today’s Tokyo and London sessions, there is a possibility of liquidity sweeps to the support zone below before Gold recovers and increases again in the New York session.
Important to note:
The uptrend will only be broken if Gold closes below the 3345 zone on the D1 chart.
In this case, the 3320 level will be the next support zone to observe the price reaction and consider buying points.
For the bullish wave to continue expanding towards the historical peak (ATH) at 3500, the market needs stronger supporting factors, which can come from economic data or geopolitical developments.
📌 Support zone: 3345 – 3320
📌 Resistance zone: 3373 – 3418
🎯 Potential buy zone:
3345 (prioritize price reaction in this zone)
3320 (in case of breaking through 3345)
🎯 Target: 3417
GOLD (XAU/USD) SHORT TRADE PLAN
July 25, 2025
Trade Overview (My setup)
- Direction: Short (SELL)
- Entry Price: $3,330
- Take-Profit: $3,270
- Stop-Loss: $3,370
- Lot Size: 0.18 lots (18 oz)
- Risk: $720
- Reward: $1,080
- Risk/Reward Ratio: 1.5 : 1
Technical Analysis Supporting the Bearish Bias
1. Price Structure & Trend
- Descending channel observed on the 4H chart - strong short-term bearish signal.
- Series of lower highs and lower lows confirms bearish trend.
- Price is testing $3,325-$3,300 support - breakdown opens downside to $3,270-$3,250.
2. Key Support/Resistance Zones
- Key support: $3,300 being tested.
- Resistance: $3,360-$3,370 zone - logical stop-loss location.
3. Indicator Confirmations
RSI (4H): ~35-40, bearish territory, no bullish divergence.
Moving Averages: Price below 50 EMA and 200 EMA - bearish crossover.
MACD: Bearish crossover, histogram confirms selling momentum.
