GOLD-SELL strategy 3 hourly chartGOLD has been positive due to crypto buoyant state of mind. These are very overbought, even though we see each day a higher price, it only means the correction will become very severe, is my person al viewpoint.
Gold techs are starting to become negative, and I feel we should move lower towards $ 3,300 > 3,240 area over-time.
Strategy SELL @ $ 3,385-3,425 and take profit in stages near $ 3,325 - $ 3,247 for now.
GOLDCFD trade ideas
Perfect Long Opportunity on Gold? Fibonacci & Price Action AlignThis is a 15-minute chart of Gold (XAU/USD) from TradingView (via Capital.com) with Fibonacci retracement levels and a long trade setup.
Chart Summary:
Timeframe: 15-minute
Instrument: Gold (XAU/USD)
Current Price: $3,390.01
Trade Type: Long (Buy) position
Technical Setup:
Fibonacci Retracement Levels:
0.382 at $3,390.44
0.5 at $3,388.69
0.618 at $3,386.95
0.786 at $3,384.46
Entry Area: Around 0.5 to 0.618 levels (~$3,388–$3,386)
Stop-Loss: Below 1.0 level (~$3,381.30)
Target: Just below the 0 Fibonacci level (~$3,396.09)
This setup suggests a potential retracement-based bounce after a significant drop. The trader is betting on a reversal from the Fibonacci support zone with a tight stop below $3,381 and aiming for a recovery up to $3,396.

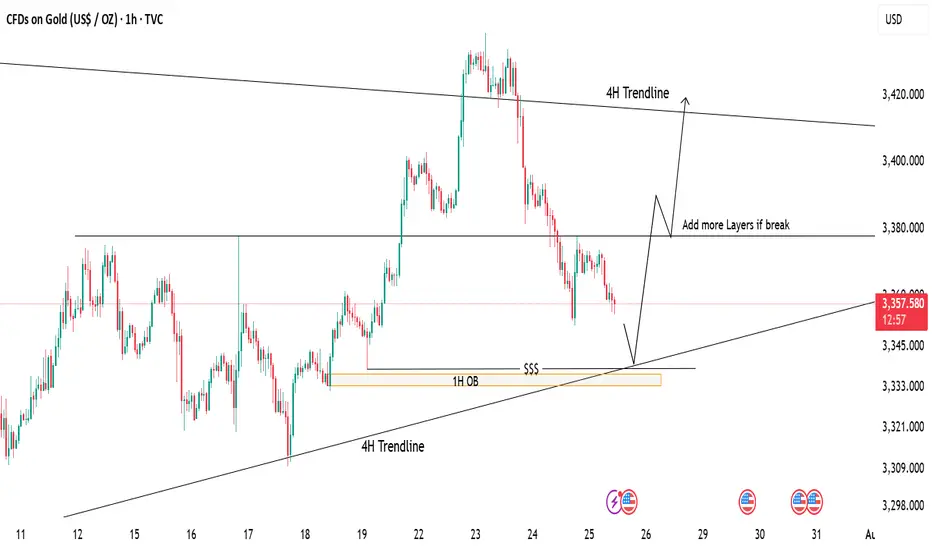
Gold Tapping Into Major Support – Eyes on Bullish ReversalPrice is currently retracing after a strong drop from recent highs. We're now approaching a key demand zone, aligning with:
📍 1H Order Block (OB)
📍 4H Trendline Support
📍 Liquidity Zone ($$$)
📉 If price taps into this area, it may offer a high-probability long setup.
📈 First target: 3380 (mid-range resistance)
🧱 If this breaks, we can look to scale in/add more positions, targeting the 4H trendline zone near 3420.
⚠️ Waiting for price reaction at support – patience is key!
Report - 25 jully, 2025U.S.–EU Tariff Negotiations Stabilizing Markets
Reports confirm the U.S. and EU are nearing a deal for 15% reciprocal tariffs—lower than the initially threatened 30% by President Trump. This easing of tensions led to moderate equity gains in both blocs, with the Stoxx 600 reaching a 6-week high before closing +0.2%. Pharmaceutical and auto stocks outperformed (Volkswagen +2.3%, Bayer +2.3%).
Forecast: If the 15% deal is finalized by the August 1 deadline, it would remove a key overhang on equities and boost cyclical sectors reliant on transatlantic trade. A failure, however, risks escalation, triggering retaliatory tariffs by the EU on $93bn of U.S. goods, dragging risk assets sharply lower.
DXY Outlook: Tariff de-escalation boosts safe-haven flows and investor optimism, supporting USD strength.
S&P 500: Short-term relief rally expected if the 15% tariff framework is signed. However, margin compression risks remain from lingering supply chain disruptions.
Tesla vs Trump: Policy Shock Rattles EV Sector
Elon Musk warned that Trump's anti-EV stance and trade war posture will sharply erode Tesla’s regulatory credit revenue and remove the $7,500 EV tax credit. Tesla's stock has cratered 37% since December, with a sharp 8% drop yesterday. Adjusted Q2 net income was down 22%, revenue -12%.
Risk Forecast: Loss of EV subsidies + political fallout between Musk and Trump could drag Tesla further and dampen broader EV sector growth.
XAUUSD: Rising political uncertainty and risks to the U.S. tech sector may drive safe-haven flows into gold.
Dow Jones: Tesla's underperformance and anti-EV policies could limit industrial sector gains.
ECB Holds Rates Amid Trade Risk Fog
The European Central Bank paused its easing cycle, holding the benchmark rate at 2%. Lagarde emphasized a "wait-and-watch" stance, signaling uncertainty due to unresolved trade talks and tariff volatility.
Market Implication: Eurozone government bond yields rose (10Y Bund at 2.70%), paring rate-cut bets. The euro softened to $1.1760.
EURUSD: Lack of further ECB accommodation and weaker consumer confidence amid trade frictions.
Fed Independence in Jeopardy? Market Confidence Wobbles
Pimco warned that White House pressure on Fed Chair Powell—including potential firing and scrutiny over $2.5bn HQ renovations—could destabilize markets. Trump continues pushing for aggressive 1% rates, diverging from current 4.25–4.5% levels.
Fiscal/Political Implication: Undermining Fed autonomy risks flight from U.S. bonds, undermining monetary policy credibility and capital inflows.
USDJPY: Yen may gain if markets lose faith in U.S. institutional integrity, despite rate differentials.
DXY: Temporary support from yields, but structural downside if Fed credibility erodes.
Deutsche Bank and BNP: Diverging Strengths in Volatile Landscape
Deutsche Bank posted its strongest Q2 in 18 years, driven by litigation charge reversals and stable investment banking performance. BNP Paribas also reported solid FICC trading (+27%), though equity trading lagged due to weak derivatives demand.
Equity Implication: Strong capital returns and stable European banking profitability support DAX resilience amid trade noise.
DAX: Boosted by banking and auto outperformance.
China–EU Trade Strains Escalate
Von der Leyen directly confronted Xi Jinping over trade imbalances and support for Russia. EU exports to China are down 6% YoY while Chinese imports to the EU are up 7%. Xi defended Beijing’s stance, warning against "decoupling" rhetoric.
Geostrategic Implication: EU may escalate anti-dumping and export control measures. Markets may see renewed volatility in European industrials and luxury sectors reliant on China.
XAUUSD: Rebalancing of power and heightened East–West tensions favor gold.
Oil Oversupply Warning from TotalEnergies
Total warned of an oil glut due to OPEC+ production increases and weakening global demand. Q2 profits fell 30% YoY. Brent now likely to stay within $60–70 range barring major geopolitical flare-ups.
Crude Oil: Short- to medium-term downside risk with soft demand and oversupply fears.
Energy Stocks: Dividend maintenance remains but debt levels and margin pressures may weigh.
AI Spending Surges – Alphabet and SK Hynix
Alphabet posted a 19% Q2 profit jump as AI integration boosts search volumes. Google’s cloud revenues rose 32%. Capex raised to $85bn. SK Hynix also posted record revenues from high-bandwidth memory chip sales, extending its lead over Samsung.
S&P 500: AI-driven earnings upside bolsters tech sector. Expect multiple expansion in mega-cap AI-exposed names.
XAUUSD : Robust AI investment supports risk appetite but inflationary fears could lift gold marginally.

XAU/USD: Golden Breakout to $3400?XAU/USD: Golden Opportunity Ahead XAU/USD is testing a key support at $3345, with a bullish setup forming on the 1-hour chart. Entry at $3345 offers a high-probability trade, targeting $3400 where the next resistance aligns. Set a stop loss at $3320 to manage risk below the recent support. A break above $3350 with strong volume could confirm the move. Watch for US dollar weakness as a catalyst. Trade smart!
#XAUUSD #GoldTrading #ForexSignals #TechnicalAnalysis #MarketAnalysis #DayTrading

Gold Bullish idea so far . 23.7.2025we got the last bullish zone at 3375- 3326 ( marked as BC )
price must respect that zone to go for the next target at around 3500 .
This is ONLY the Bullish Idea .
price must Break 3454 to activate new ATH sequence targeting 3850 zone .

The US and Europe reached an agreement. Gold rebounded.At the current node, the EU and the US reached a tariff cooperation, 15% tariff + 600 billion US dollars for investment in the United States. The additional tariffs are considered a big deal, and the US has become the winner again this time.
Of course, this is a small negative for the current gold market.
From a multi-period analysis, the monthly chart price is still in a reverse K state. For the current situation, we need to pay attention to the gains and losses of the monthly highs and lows. The weekly chart shows that the price has continued to fluctuate at a high level recently. As time goes by, the weekly watershed is temporarily at 3320. After last week's high and fall, there is currently a further downward performance.
The four-hour chart shows that the price has continued to be suppressed after breaking through the four-hour support last Wednesday. The four-hour level resistance is currently around 3355, and the resistance level has moved up compared with the early Asian market. Therefore, we will pay attention to the pressure at this position in the future. If it fails to break through for a long time, it is likely to fall directly under pressure; pay attention to the support range of 3320-3310 below.
KEMANA GOLD KEDEPAN NYA ?📊 Technical Analysis – XAUUSD (July 28, 2025)
Elliott Wave Structure – Triangle (ABCDE):
The chart clearly shows a contracting triangle pattern (ABCDE), which commonly appears during corrective waves (usually Wave 4 or Wave B in a larger degree).
Currently, price seems to have just completed Wave E, and it's showing early signs of a bounce from the triangle's lower support.
If this wave count is valid, we could expect a bullish breakout soon, continuing the previous trend (most likely upward if this is part of Wave (5)).
🧭 Key Support and Resistance Levels:
Triangle Support (Wave E area):
Around $3,325 – $3,336 (price is currently testing this zone)
Potential Bullish Targets (if breakout occurs):
🎯 $3,374
🎯 $3,414
🎯 $3,498 – $3,500 (major resistance zone / Wave 5 target)
🧠 Fundamental Outlook Supporting Gold (Forward-Looking)
✅ Bullish Drivers:
Fed Rate Cut Expectations (Late 2025):
Slowing inflation → Rate cuts expected → Positive for gold.
Weaker US Dollar:
A weaker dollar makes gold cheaper for international buyers → Bullish.
Global Geopolitical Tensions:
Rising uncertainty supports gold as a safe haven asset.
⚠️ Bearish Risks:
Strong US economic data (e.g., NFP beats or rising inflation) could lead to the Fed staying hawkish → Negative for gold.
If price breaks below triangle support ($3,325), the triangle structure would be invalidated and a larger correction could unfold.
📝 Summary & Trading Strategy:
Direction Entry Area Stop Loss TP 1 TP 2 TP 3
✅ Buy (preferred) $3,330 – $3,336 Below $3,310 $3,374 $3,414 $3,498–$3,500
❌ Sell (if breakdown) Below $3,320 Above $3,340 $3,265 $3,245 $3,118

XAU/USD(20250728) Today's AnalysisMarket news:
Trump announced that the US and Europe reached a trade agreement: 15% tariffs on the EU, $600 billion in investment in the US, zero tariffs on the US by EU countries, the EU will purchase US military equipment, and will purchase US energy products worth $750 billion. However, the US and Europe have different statements on whether the 15% tariff agreement covers medicines and steel and aluminum. Von der Leyen: The 15% tariff rate is the best result that the European Commission can achieve.
US Secretary of Commerce: The deadline for tariff increases on August 1 will not be extended. The United States will determine the tariff policy on chips within two weeks.
Technical analysis:
Today's buying and selling boundaries:
3345
Support and resistance levels:
3393
3375
3363
3326
3315
3297
Trading strategy:
If the price breaks through 3345, consider buying in, the first target price is 3363
If the price breaks through 3326, consider selling in, the first target price is 3315

Daily Analysis- XAUUSD (Monday, 28th July 2024)Bias: Bullish
USD News(Red Folder):
-None
Notes:
- Price gap down and filled up the gap
- Looking for price to tap 0.618 fib level
- Potential BUY if there's
confirmation on lower timeframe
- Pivot point: 3300
Disclaimer:
This analysis is from a personal point of view, always conduct on your own research before making any trading decisions as the analysis do not guarantee complete accuracy.

XAUUSD 4H Has Finished Triangle Pattern #elliotwaveXAUUSD has finished its ABCDE correction in triangle pattern. Price will soon to test the previous $3,500 all time high area. It will required some big news as fundamental to boost the gold price up.
At the time this idea published, price still making lower low and lower high which is the downtrend pattern, but I believe it will soon break the structure and see higher high and higher low as the uptrend confirmation.

Summary of gold market this week and analysis of next week's mar
Gold closed with an inverted hammer candlestick with a relatively long upper lead this week. Technically, the market is still bearish next week, and the pressure from above is still relatively large. After reaching the highest point of 3438.7 this week, it started a unilateral decline mode, which caught the bulls off guard perfectly. This week, I also emphasized that the 3400 line is not a high point. Gold rose strongly at the beginning of this week, and the market had high expectations for bulls. In the second half of the week, gold fell unilaterally, hitting the bulls hard. This week, it closed at 3336.7, which is another distance from 3400. Next week, we will continue to give the operation ideas of rebound shorting according to the technical analysis. Following the trend is the way to invest. If your current operations are not ideal, I hope I can help you avoid detours in your investment. You are welcome to communicate with me!
From the 4-hour analysis chart, we focus on the short-term suppression of 3370-75 on the top, and focus on the suppression of 3397-3400 on the top. After all, gold fell and broke through here this week, and then fell southward. We focus on the support of 3312-18 on the bottom. On Friday midnight, we gave a long position at 3318-25. Gold rebounded at 3324.9 at midnight. In operation, gold will still be treated as rebound short next week. I will remind you of the specific operation strategy during the trading session, so please pay attention to it in time.
Gold operation strategy:
Short gold rebounds at 3370-75, stop loss at 3387, target 3327-3330, and continue to hold if it breaks;

XAUUSD Gold just jumped to our 4H POI, we now wait for confirmation for buys to the upside targeting new highs.
How's your outlook?

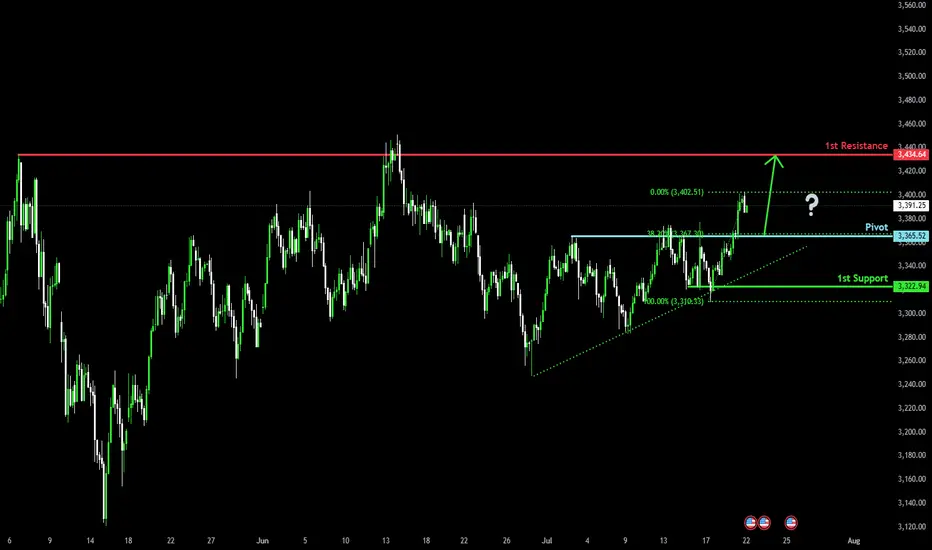
Falling towards pullback support?The Gold (XAU/USD) is falling towards the pivot which has been identified as a pullback support and could bounce to the 1st resistance.
Pivot: 3,365.52
1st Support: 3,322.94
1st Resistance: 3,434.64
Risk Warning:
Trading Forex and CFDs carries a high level of risk to your capital and you should only trade with money you can afford to lose. Trading Forex and CFDs may not be suitable for all investors, so please ensure that you fully understand the risks involved and seek independent advice if necessary.
Disclaimer:
The above opinions given constitute general market commentary, and do not constitute the opinion or advice of IC Markets or any form of personal or investment advice.
Any opinions, news, research, analyses, prices, other information, or links to third-party sites contained on this website are provided on an "as-is" basis, are intended only to be informative, is not an advice nor a recommendation, nor research, or a record of our trading prices, or an offer of, or solicitation for a transaction in any financial instrument and thus should not be treated as such. The information provided does not involve any specific investment objectives, financial situation and needs of any specific person who may receive it. Please be aware, that past performance is not a reliable indicator of future performance and/or results. Past Performance or Forward-looking scenarios based upon the reasonable beliefs of the third-party provider are not a guarantee of future performance. Actual results may differ materially from those anticipated in forward-looking or past performance statements. IC Markets makes no representation or warranty and assumes no liability as to the accuracy or completeness of the information provided, nor any loss arising from any investment based on a recommendation, forecast or any information supplied by any third-party.
GOLD continues to correct down, good news from trade situationOANDA:XAUUSD has fallen sharply again, currently trading around $3,360/oz, reflecting the easing of global trade tensions, affecting demand for safe-haven assets. The US Dollar and US Treasury yields have also increased, affecting gold prices.
The US Dollar Index ( TVC:DXY ), which tracks the greenback against six other currencies, rose to 97.56.
The yield on the 10-year US Treasury note US10Y rose to 4.386%. The US real yield, calculated by subtracting inflation expectations from nominal interest rates, rose nearly 3.5 basis points to 2.046%.
Markets are increasingly optimistic about such deals after the United States and Japan reached a trade deal, and the European Union could be next. In addition, rising stock markets and low volatility have kept gold's gains in check.
The United States and the European Union are moving toward a potential trade deal that would include a 15% tariff on EU goods and zero tariffs on some items.
The European Commission said Thursday that a negotiated trade solution with the United States is within reach.
“Our focus is on reaching a negotiated outcome with the United States,” a European Commission spokesperson told reporters about the EU-U.S. tariff talks. “We believe that such an outcome is achievable.” The European Commission has repeatedly said that its current priority is to reach a deal with the United States to avoid the 30% tariffs that U.S. President Trump has proposed to impose on EU products starting August 1.
On the economic data front, initial jobless claims in the United States unexpectedly fell last week, suggesting the job market remains solid.
The U.S. Bureau of Labor Statistics reported on Thursday that initial jobless claims fell to 217,000 in the week ended July 19, below expectations of 227,000 and down from 221,000 the previous week.
Technical Outlook Analysis OANDA:XAUUSD
Gold is heading for its third consecutive day of decline since hitting the bullish target level sent to readers in the weekly edition on Sunday at $3,430.
Despite the sharp decline, gold still has enough technical conditions for an uptrend given its current position and structure.
Specifically, gold is still above the EMA21, which is considered the nearest support at the moment. Along with that, the uptrend price channel is the short-term trend. However, for gold to qualify for a short-term bullish cycle, it needs to be confirmed by price action above the 0.236% Fibonacci retracement level, then the target is $3,400 in the short term, more than $3,430.
On the other hand, RSI is still holding above 50, and 50 in this case acts as momentum support. Therefore, gold still has room to rise.
In case gold is sold below EMA21, it may suffer a further decline with the next target around $3,310 in the short term, more than $3,300 and the 0.382% Fibonacci retracement level. And if gold loses the support at the 0.382% Fibonacci level, it will qualify for a bearish cycle.
Intraday, the current position of gold price is still tilted towards the upside, and the notable price points will be listed as follows.
Support: $3,350 – $3,310 – $3,300
Resistance: $3,371 – $3,400 – $3,430
SELL XAUUSD PRICE 3406 - 3404⚡️
↠↠ Stop Loss 3410
→Take Profit 1 3398
↨
→Take Profit 2 3392
BUY XAUUSD PRICE 3329 - 3331⚡️
↠↠ Stop Loss 3326
→Take Profit 1 3337
↨
→Take Profit 2 3343

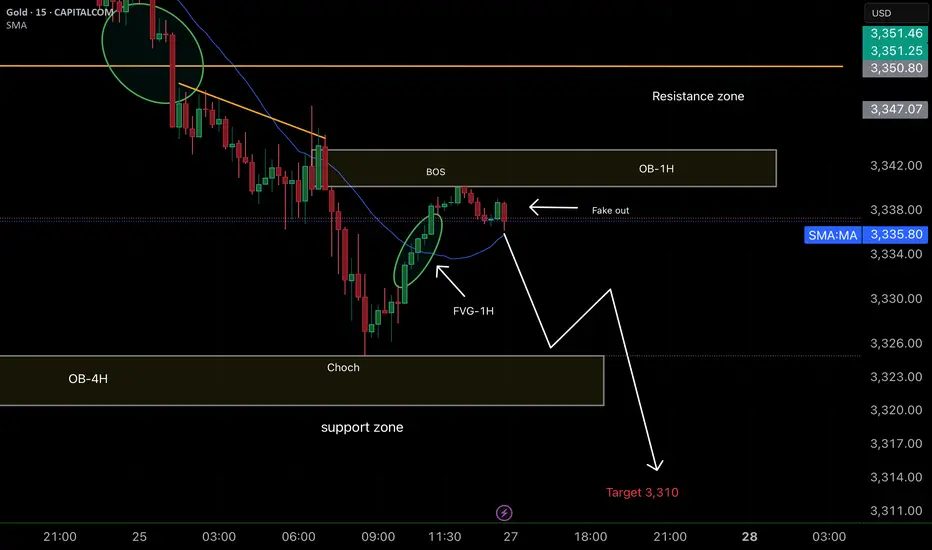
Smart Money concepts (SMC) Positive points of the analysis:
1. Clarity in the market structure (CHoCH + BOS):
It is clear that the market made a CHoCH and then confirmed it with a Break of Structure (BOS), which validates the downward trend change.
2. Well-identified fake out:
The "fake out" just after the BOS and within the 1H-OB is typical institutional behavior. This bullish wick is a trap to induce liquidity before the fall. Excellent reading.
3. Confluence zone (1H-OB + 1H-FVG):
The price rises to mitigate the 1H-FVG within the 1H-OB, providing a very good entry opportunity.
Furthermore, this occurs within the resistance zone, which gives it even more weight.
4. Support zone and target at 3310:
The TP is very well projected at 3310, just below the current support zone. If it breaks that zone, it is highly likely that it will reach the target.
Gold – Range Break Incoming?Gold is still locked in a broad range, but recent price action suggests a possible breakdown. A break below the double bottom opens the door for a move toward the range midpoint.

Gold Trading Strategy Reference On Monday✅ Gold Market Weekly Summary
Gold prices experienced significant volatility this week and ultimately closed lower on the weekly chart, failing to hold above the key $3400 level. Although the price briefly achieved a bullish breakout earlier in the week, the rally lacked follow-through, indicating weak bullish momentum and growing market indecision from a technical perspective.
✅ Detailed Review
Gold surged by 2.4% in the first two trading days of the week, but gave back nearly 3% over the last three sessions. The reversal was primarily driven by renewed optimism surrounding trade negotiations led by former President Trump, which boosted risk appetite and dampened safe-haven demand for gold.
✅ Outlook for Next Week
Investors will closely monitor the Federal Reserve’s policy meeting scheduled for July 29–30. Market expectations suggest an extremely low probability of a rate cut during this meeting, with the likelihood of holding rates steady in September rising to approximately 40%, up sharply from around 10% a month ago.
✅ If Fed Chair Jerome Powell highlights progress in trade agreements as a reduction in economic uncertainty—thereby leaving the door open for a September rate cut—U.S. Treasury yields may fall sharply, potentially boosting gold prices. Conversely, if Powell cites rising inflation data and avoids signaling any easing at the next meeting, gold may come under renewed pressure.
✅ Technical Analysis
Gold suffered a sharp decline on Friday, breaking below the key 4-hour trendline support at the $3335 level, which we previously identified. This triggered renewed bearish momentum, and the current price action reflects a clear downtrend. Unless a firm bottom is established, the bearish trend is likely to continue.
✅ Hourly Chart Structure
Volatility between bulls and bears was apparent this week. The price followed an ascending channel during the first half of the week but reversed sharply in the latter half, erasing gains and forming a new descending channel. The $3350 level now acts as a critical pivot point and will serve as the key resistance level for bearish strategies next week.
✅ Conclusion
Given that both the 4-hour and daily charts have broken major support levels, the outlook has shifted from a mildly bullish consolidation to a trend-following bearish stance.
✅ Trading Strategy Reference:
🔰 Entry: Consider initiating short positions around the $3350 level
⛔ Stop-Loss: Place stops above $3360
🔰 Targets: Initial target at $3325; if broken, look for further downside toward the $3310 area
🔥Trading Reminder: Trading strategies are time-sensitive, and market conditions can change rapidly. Please adjust your trading plan based on real-time market conditions. If you have any questions or need one-on-one guidance, feel free to contact me🤝

xauusdxauusd sell 3432 Gold is in an ascending channel. I think it could pull back from these areas. We need to see how the next 4-hour candle will close.

Gold scalp buying opportunity before final dropGold has broken above the mini bull flag formation and is currently sustaining above the structure. The strategy is to patiently await a pullback into the highlighted buy-back zone, where a favorable entry opportunity may present itself. Focus remains on the projected flag targets, as the ongoing momentum suggests promising upside potential. Monitor price action closely.

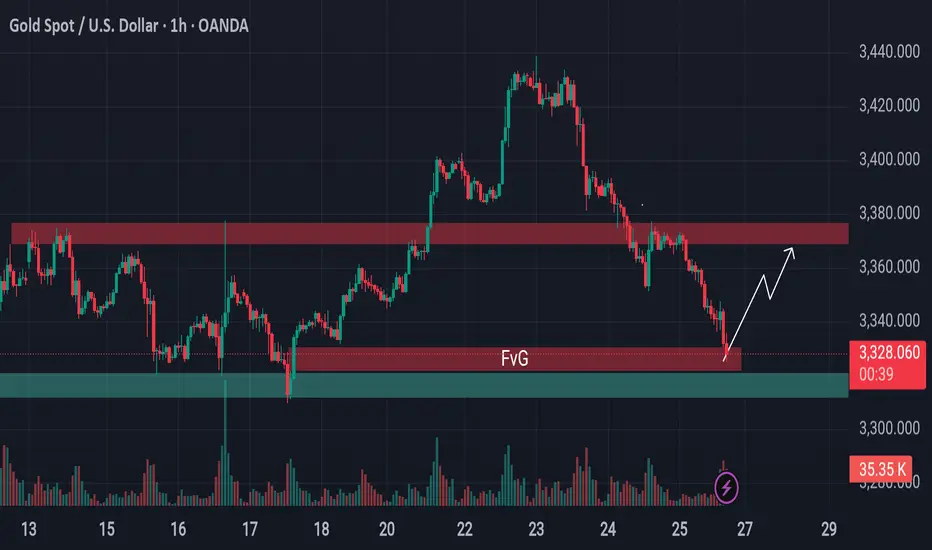
From Breakdown to Breakout? Gold Eyes Support Based Reversal!Gold is approaching a critical support area.
Previously, the price was holding above a key support level, but that zone has now been breached and is likely to act as resistance going forward. However, just beneath the current price, there's a well-established support level still intact—reinforced further by the presence of a bullish Fair Value Gap (FVG).
This setup hints at a possible reversal or a short-term surge from this zone. If market conditions align, gold may stage a pump from here. Keep this level on your radar—it could turn into a decisive point for price direction.
🛡 Always conduct your own analysis before taking any trades. DYOR.
XAUUSD Our old trade is holding in profits from top. but this one is reetry and played well but news can change thing dramatically
Manage risk at first
Sell short plan 15 minutes time frame

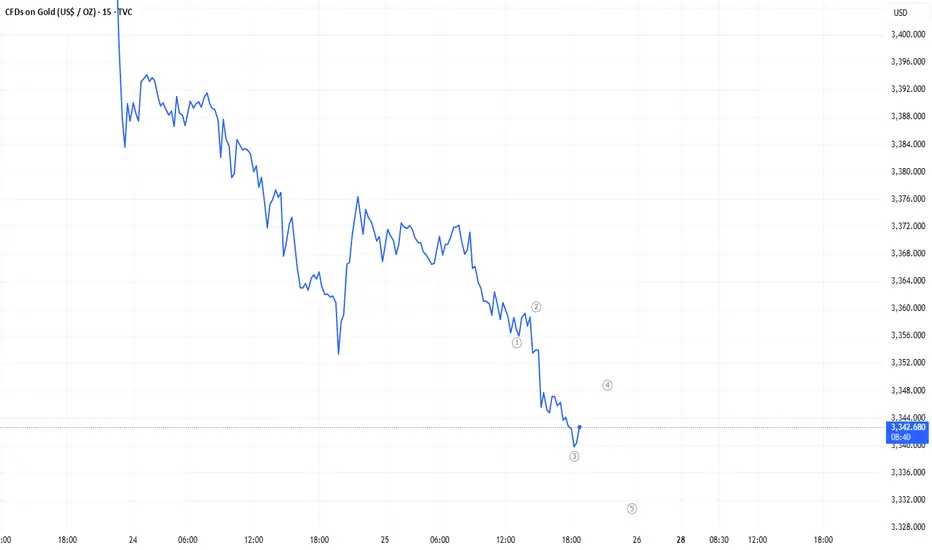
Elliott waveelliott 5 wave structure bearish continuation
sell limit 3347-3350 stoploss 3355, tp 3320