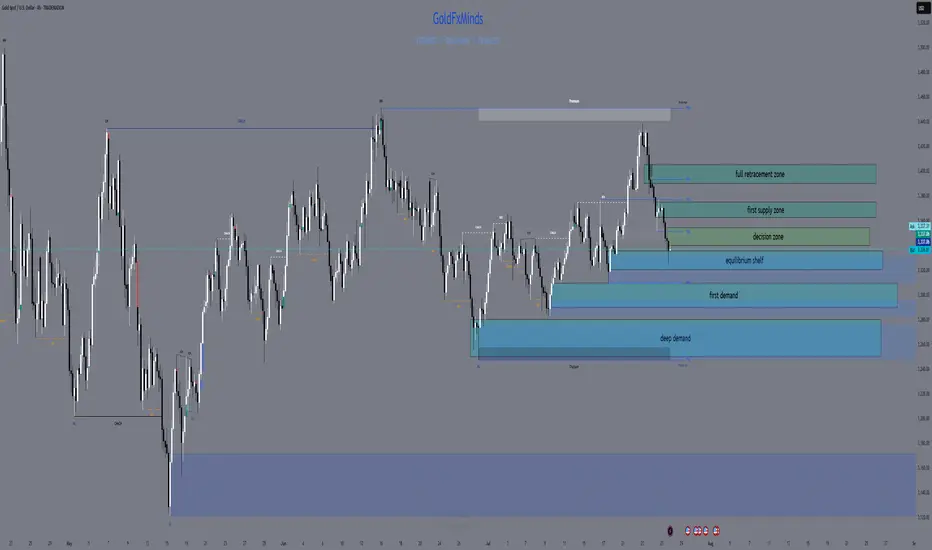
XAUUSD H4 Outlook – “Fed Week: Only the Real Zones”Hello, gold traders!
FOMC week is here, the dollar’s flexing, and gold is stuck under a fortress of supply. No fantasy, no overlaps, just your real, actionable H4 map—zones spaced, logic tight, and all fluff deleted.
⬜Bias:
Neutral to bearish while price is capped under 3,355 and the EMA cluster.
Only flip bullish if price closes and holds above 3,375 with strong confirmation after news.
Current Price: 3,336.81
Summary for your audience:
Neutral–bearish: All the EMAs (21/50/100/200) are overhead, and the primary supply and decision zones are blocking any upside.
No reason to flip bullish unless gold breaks out and holds above both the decision zone and the full supply ceiling after major news.
All bounces into supply are likely to get faded, unless the structure changes dramatically post-FOMC.
🟥 ULTRA SUPPLY ZONE: 3,390 – 3,405
127–161.8% Fib extension—liquidity grab and stop-hunt target for news-driven spikes
Only short if you see a monster upper wick and hard rejection
🟥 PRIMARY SUPPLY: 3,365 – 3,375
All EMAs (21/50/100/200) are stacked overhead; unfilled FVG at 3,370–3,375
Short on a clear rally rejection or bearish engulfing candle—this is where most breakouts get trapped
🔶 DECISION ZONE: 3,340 – 3,355
EMA100/200 straddle this level; small FVG at 3,350–3,352
Market “decides” here—fade unless price closes decisively above 3,355
🔵 EQUILIBRIUM SHELF: 3,320 – 3,335
50% Fib at 3,327; filled FVG at 3,325–3,330; SMA50 just below
Bounce/fake-break zone—wait for a clean H4 reversal, not a guess
🟢 FIRST DEMAND BASE: 3,290 – 3,310
H4 Order Block, hidden FVG (3,300–3,305), Fib 38.2% around 3,295
Longs only with strong pin-bar/engulf and quick EMA50 reclaim
🔵 DEEP PULLBACK BAY: 3,250 – 3,280
Weekly EMA21 and 61.8% Fib (~3,260), strong volume
Only consider a long on a panic flush and a powerful reversal wick
⚡️ MACRO CONTEXT
USD: On fire into ADP and FOMC; gold moves will be explosive, not logical
Events:
Tue: ADP
Wed: FOMC + Powell
Thu: Core PCE
Fri: NFP, ISM
Bias: Neutral-bearish under 3,355; only bullish if we close and hold above 3,375
EMAs: Clustered tightly overhead—bulls get no respect until this ceiling is crushed
🎯 TRADE LOGIC
Shorts:
3,390–3,405 (big wicks and clear rejection only)
3,365–3,375 (news spike or failed breakout with bearish candle)
Longs:
3,340–3,355 (only on a confirmed close above)
3,320–3,335 (strong reversal only—don’t front run)
3,290–3,310 (classic H4 pin-bar/engulf + EMA50 reclaim)
3,250–3,280 (deep panic flush and major reversal only)
NO TRADE: In the gaps—let the gamblers get chewed up, not you.
💬 Which zone will you snipe? Drop a comment and show you’re here for structure, not noise!
👍 Like & Follow for high-value, real-time sniper maps every day.
Disclosure: Chart via Trade Nation’s TradingView feed. Influencer Program participant.
GoldFxMinds 💛
GOLDCFD trade ideas
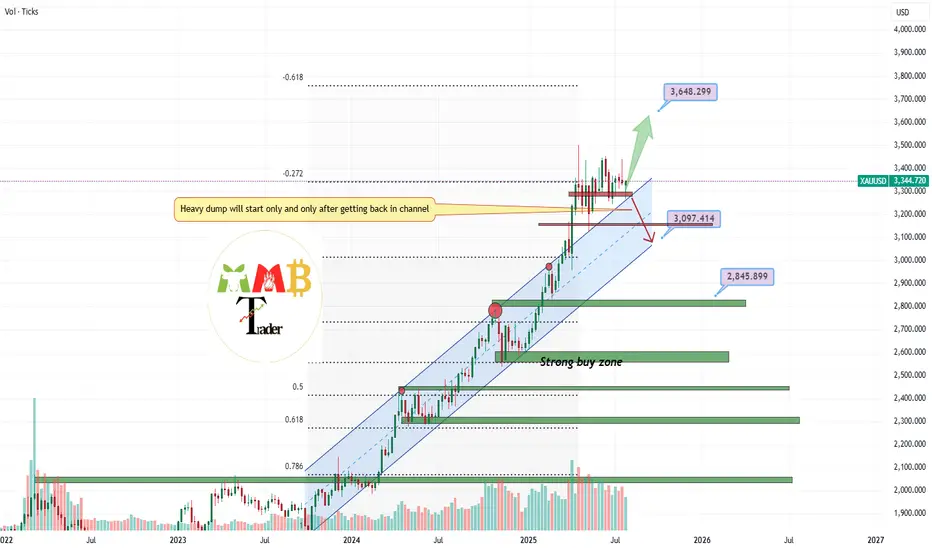
GOLD channel breakout retest complete more pump ahead As we can see the blue channel resistance is gone and also now it turn to strong and valid support and retest is also complete and gold is now targeting 3600$ easy.
DISCLAIMER: ((trade based on your own decision))
<<press like👍 if you enjoy💚
GOLD (XAUUSD): Bearish Continuation Ahead?!
Gold retested a recently broken significant liquidity cluster.
I see a clear sign of strength of the sellers after its test
with multiple intraday confirmation.
I think that the price will retrace to day to 3276 level.
❤️Please, support my work with like, thank you!❤️
I am part of Trade Nation's Influencer program and receive a monthly fee for using their TradingView charts in my analysis.

THE KOG REPORT THE KOG REPORT:
Due to there being no KOG Report last week so we won’t reference it, however, we did post the FOMC and NFP reports for the wider community to help them navigate the moves, which as you can see from the pinned ideas worked well.
So, what can we expect in the week ahead?
After the move we observed for NFP on Friday we would like to see some retracement in the sessions ahead. Looking at the 4H chart we have a reversal in play, but we still have no break out of this range! We’re simply playing the highs and the lows while price chops and whipsaws within it, which could be causing some new traders confusion and frustration.
We have a support level below 3350 and below that 3340 which will be the bias level for this week as bullish above. We then have the intra-day resistance level 3365-70 while there is an extension of the move into the 3385 level. Ideally, what we want to see here is support levels hold or a quick continuation on the open into the higher red box levels and the a potential for a RIP. That RIP however is most likely going to be a scalp unless we come down and break below that 3345-50 level.
We want to see how this reacts at these higher levels and if we do get a break of the boxes, otherwise, there is a chance we see another curveball like we suggested a couple of weeks ago, and we correct this whole move back downside with the first hurdle being 3340-35 on the flip.
We’re going to keep it simple here for now and usual we’ll update during the week once we have a clearer understanding of whether this wants to attempt a new all time high or not.
Please note, our liquidity indicator is suggesting a little higher but a pullback is on the way.
We’ll keep you updated.
KOG’s bias for the week:
Bullish above 3340 with targets above 3370, 3373, 3379 and above that 3384
Bearish on break of 3340 with targets below 3330, 3320 and below that 3310
RED BOXES:
Break above 3365 for 3372, 3375, 3379, 3384 and 3390 in extension of the move
Break below 3350 for 3346, 3340, 3335 and 3330 in extension of the move
Please do support us by hitting the like button, leaving a comment, and giving us a follow. We’ve been doing this for a long time now providing traders with in-depth free analysis on Gold, so your likes and comments are very much appreciated.
As always, trade safe.
KOG
GOLD The Target Is UP! BUY!
My dear subscribers,
This is my opinion on the GOLD next move:
The instrument tests an important psychological level 3317.7
Bias - Bullish
Technical Indicators: Supper Trend gives a precise Bullish signal, while Pivot Point HL predicts price changes and potential reversals in the market.
Target - 3326.4
My Stop Loss - 3313.0
About Used Indicators:
On the subsequent day, trading above the pivot point is thought to indicate ongoing bullish sentiment, while trading below the pivot point indicates bearish sentiment.
Disclosure: I am part of Trade Nation's Influencer program and receive a monthly fee for using their TradingView charts in my analysis.
———————————
WISH YOU ALL LUCK
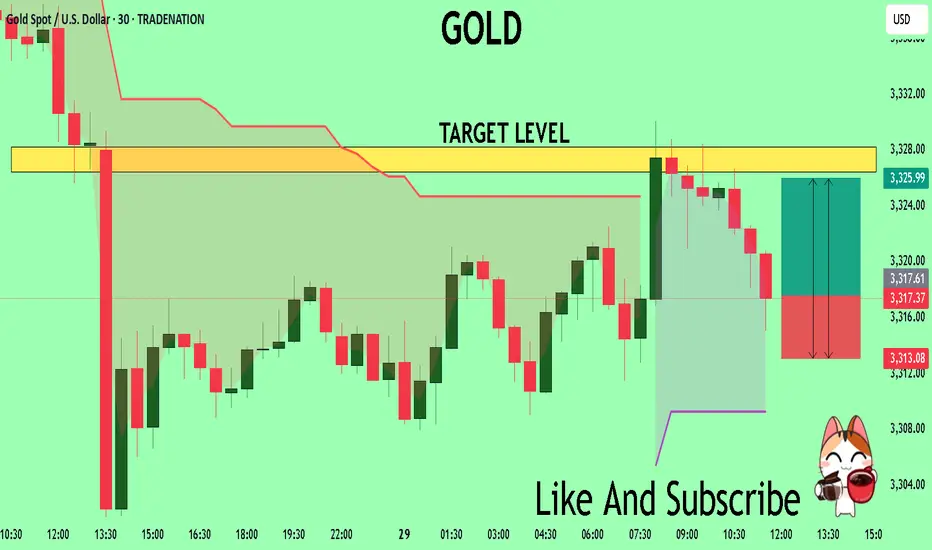
Gold Drops After Failing to Hold Above $3322📊 Market Overview:
Gold initially surged above the $3322 resistance, hitting $3329 amid Fed pause expectations. However, a rebound in the US dollar and profit-taking triggered a sharp drop back to $3315, signaling weakening bullish momentum.
📉 Technical Analysis:
• Key resistance: $3322 – $3330
• Nearest support: $3308 – $3300
• EMA09 (H1): Price has fallen below EMA09 → turning short-term trend bearish
• Candlestick / Volume / Momentum:
• Failed breakout above $3322 with strong bearish H1 reversal
• Increasing volume during the drop → rising selling pressure
📌 Outlook:
Gold may continue declining in the short term if it fails to hold above $3312. Bears have taken control after the failed breakout attempt. Risk increases for a move toward $3300–$3295.
💡 Suggested Trade Setup:
🔻 SELL XAU/USD : $3318 – $3321
🎯 TP: 40/80/200 pips
❌ SL: $3325
🔺 BUY XAU/USD: $3295 – $3292 (only with clear bullish signal)
🎯 TP: 40/80/200 pips
❌ SL: $3288

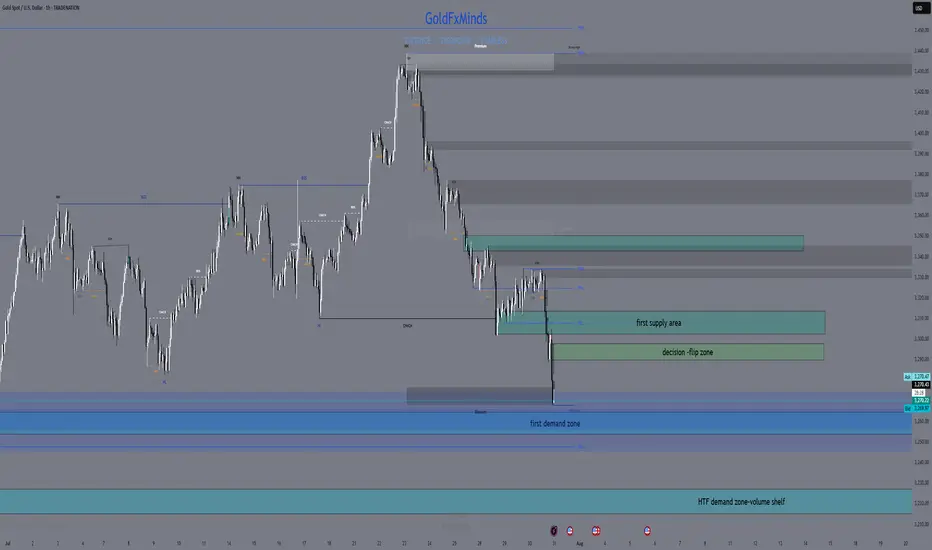
XAUUSD Market Update – July 30 Late NY Recap🔸Macro Context
Markets are still digesting Powell’s ongoing speech with no clear pivot signals. While FOMC tone remained cautious, no dovish surprise emerged. Trump’s upcoming comments keep geopolitical risks elevated. USD remains firm. Gold is reacting within key HTF demand as intraday volatility cools off.
🔸Bias Overview
Weekly Bias:
• Bearish rejection from the major supply wick 3439–3350
• Structure still below 3345, maintaining downside pressure
• Weekly RSI cooling off — no bullish divergence yet
Daily Bias:
• Lower high locked below 3345
• Price reentered the imbalance toward 3272
• Clean structure remains bearish unless we reclaim 3302
H4 Bias:
• Lower high formed at 3314
• Current price testing HTF Extreme Demand Base (3289–3272)
• Still bearish unless we see a confirmed M15 or H1 BOS from demand
🔸Key Structural Zones
🔺Above Price (3272):
• 3289–3294
Decision Block – M30 OB + FVG. First sign of momentum shift if reclaimed.
• 3302–3314
Supply Reversal – H1 OB + previous BOS zone. EMA alignment adds pressure.
• 3345–3350
Major Rejection Zone – H4 origin of last leg down. Strong resistance area.
🔻Below Price (3272):
• 3254–3264
Imbalance + OB – H4 FVG + clean demand zone. Buy setup only on deep flush + reversal PA.
• 3227–3214
HTF Demand Base – Daily OB + historical volume shelf. Final structural floor before deeper downside opens.
🔸Battle Plan
▶ Scenario 1 – Bearish Breakout
If 3272 fails with momentum and no reversal signs, expect continuation into 3254–3264.
No long trades unless BOS confirms.
▶ Scenario 2 – Reactive Long from Demand
If price gives a strong reaction from 3272 with BOS on M15 or H1 and clears 3294, then a recovery into 3302 is possible. Only valid with confirmed PA + EMA shift.
▶ Scenario 3 – Choppy Rejection from 3294
If price tests 3294 but fails, watch for rejections back toward 3272. Scalpers can fade reactions if no bullish structure forms.
🔸Final Thoughts
Price is once again testing our Extreme Demand Base from July 28 (3289–3272). The zone remains valid — but execution depends entirely on confirmation. Bears still in control unless we reclaim 3302 cleanly.
No need to rush. Best RR setups are found at clean structural edges.
Patience = profits.
—💬 Drop your thoughts in the comments.
❤️ Like if you appreciate the precision.
🔔 Follow GoldFxMinds for more sniper-level updates.
With you all the way,
— GoldFxMinds
📊 Analysis based on Trade Nation TradingView charts.
Gold can reach resistance area and then continue to fallHello traders, I want share with you my opinion about Gold. Over an extended period, the price action of Gold has been contained within a large descending triangle, a pattern characterized by a series of lower highs testing a descending resistance line and a relatively flat support base. The major seller zone around the 3415 resistance level has consistently capped upward rebounds, establishing a clear downward pressure on the asset. The most critical recent development has been a decisive breakdown, where the price broke below a key ascending trend line and, more importantly, below the horizontal support at 3310. This structural break has shifted the immediate market dynamics, turning the former support area of 3310 - 3320 into a new ceiling of resistance. The primary working hypothesis is a short scenario based on the principle of a breakdown and retest. It is anticipated that the price will attempt a corrective rally back towards this new resistance area around 3310. A failure to reclaim this level, confirmed by a strong rejection, would validate the breakdown and signal the continuation of the larger downward trend. Therefore, the tp for this next bearish leg is logically placed at the 3240 level. This target represents a significant area of potential support and a measured objective following the resolution of the recent consolidation. Please share this idea with your friends and click Boost 🚀
Disclaimer: As part of ThinkMarkets’ Influencer Program, I am sponsored to share and publish their charts in my analysis.

XAU/USD Bullish Setup Building MomentumGold has reclaimed bullish momentum after a strong bounce from the recent demand zone around 3319–3322. The chart shows a clear Change of Character (CHOCH) and subsequent Break of Structure (BOS), suggesting buyers are regaining control. Price is now trading above the Ichimoku cloud, further confirming bullish pressure. The upward arrow highlights the potential path toward the next key resistance area near 3380–3400. As long as price sustains above the previous structural break and the cloud base, continuation toward the upside remains likely. Market structure favours buying opportunities on dips, with bulls targeting a higher move in the short term.
Entry Buy: 3334
Target Point: 3404
If you found this analysis helpful, don’t forget to drop a like and comment . Your support keeps quality ideas flowing—let’s grow and win together! 💪

GOLD WEEKLY CHART MID/LONG TERM ROUTE MAPHey Everyone,
Weekly Chart Update – 3387 Tested, Channel Top Rejected
Quick follow up on our Weekly Chart roadmap – price continues to respect the structure with precision.
As anticipated, we got the test of 3387, completing the short term magnet move we've been tracking. That level aligned perfectly with the channel top, and true to form, we saw a clean rejection right on cue just short of the full channel top leaving that open.
Importantly, there was no close or lock above that zone, reaffirming it as valid resistance for now. As a result, the range remains active, with price still oscillating between 3281 support and 3387 resistance.
Key structural notes:
🔹 Structure remains intact
No weekly close above 3387, no breakdown below 3281. The rising channel is still fully respected, and EMA5 has yet to turn bearish.
🔹 3281 Holding Strong
This level continues to act as a key weekly pivot. As long as it holds, we maintain a constructive outlook within the current range.
🔹 3387 Tested + Rejected
First test gave us the expected reaction. Until we see a confirmed close above, it remains the top of the current range.
Updated Levels to Watch:
📉 Support – 3281
Weekly pivot and current range low. Still our key area for dip buys within this structure.
📈 Resistance – 3387
Now tested and confirmed. No break or lock above = valid rejection level.
📈 Resistance 2 – 3482
Unfilled weekly gap. Still the broader target, but we need a proper breakout above 3387 first.
Plan: We continue to treat 3281–3387 as the active weekly range. If 3281 fails, we reassess at the midline of the channel. If 3387 breaks and holds, we shift focus toward 3482.
Thanks again for all the incredible engagement and support, it means a lot to us here at GoldViewFX. Stay focused, stay disciplined.
Mr Gold
GoldViewFX

Gold 8H Bullish Reversal Setup After Channel Break. Gold/USD 8H Chart Analysis:
Price has broken below an ascending channel, indicating potential short-term weakness. However, a bullish reversal setup is marked, with a suggested buy zone near current levels (~3339), targeting the 3428–3459 USD range. Stop loss placed below 3310 for risk management.

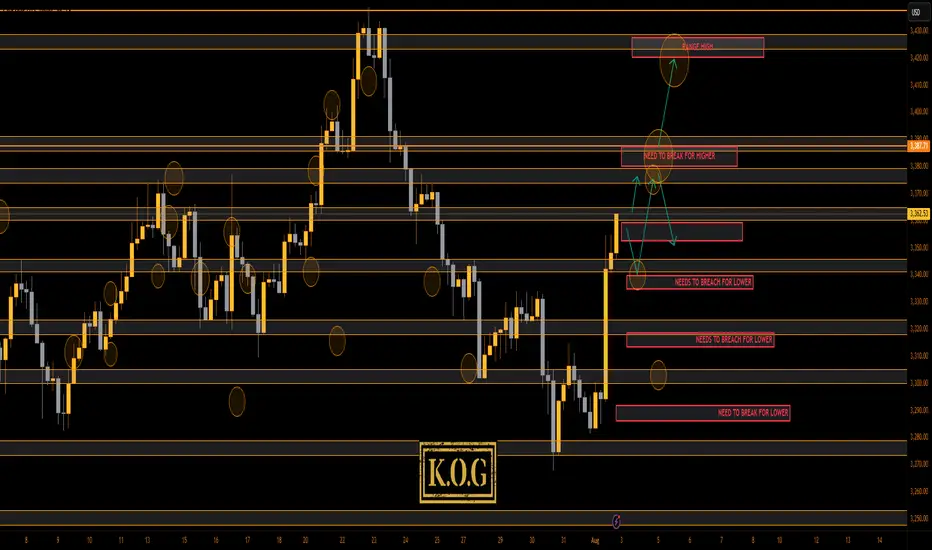
THE KOG REPORT - NFP UPDATE 1H 1H:
This is the chart we used last week for the FOMC and NFP KOG Reports. From the chart we can see the low was captured for FOMC and NFP didn’t give us an undercut low. We’ve kept the potential target box from the Report and for now we’ll stick with it. Red box defence is active below at the 3340-5 level and the ideal target stands above in the oval as long as we remain above the 3340 bias level.
KOG’s bias for the week:
Bullish above 3340 with targets above 3370, 3373, 3379 and above that 3384
Bearish on break of 3340 with targets below 3330, 3320 and below that 3310
RED BOXES:
Break above 3365 for 3372, 3375, 3379, 3384 and 3390 in extension of the move
Break below 3350 for 3346, 3340, 3335 and 3330 in extension of the move
Please do support us by hitting the like button, leaving a comment, and giving us a follow. We’ve been doing this for a long time now providing traders with in-depth free analysis on Gold, so your likes and comments are very much appreciated.
As always, trade safe.
KOG

GOLD (XAUUSD): Move Up Ahead?!
Friday's fundamentals made Gold very bullish during the New York session.
The price formed a high momentum bullish candle on a daily,
breaking a minor daily resistance area.
It gives us a confirmed Change of Character CHoCH and indicates
a highly probable bullish continuation next week.
I think that the price will reach 3400 level.
❤️Please, support my work with like, thank you!❤️
I am part of Trade Nation's Influencer program and receive a monthly fee for using their TradingView charts in my analysis.

Gold Alert: Key Levels for Potential Sell Setup!Good morning, my friends 🌞
Here’s today’s gold analysis. I'm expecting a decline in gold prices, specifically from the 3,383–3,420 level.
Once a correction starts around that zone, my target will be 3,310. Gold has been riding a strong uptrend, and if we reach those levels, I’ll be expecting a pullback and opening a sell position accordingly.
Please set your stop loss based on your personal margin preferences.
Your likes and support are my biggest motivation for continuing to share these analyses. Thank you to everyone showing appreciation 🙏

Xauusd bullish setupGold (XAU/USD) is approaching a key support zone around 3,285.82. The chart suggests a potential bullish reversal from this level, targeting resistances at 3,376.35 and 3,431.08. Price action may form a double bottom before moving upward.

GOLD DAILY CHART ROUTE MAPHey Everyone,
Daily Chart Update – Bounce + Rejection: Structure Still Dominates
Just a quick follow up on our range structure, we got exactly what we were anticipating.
Price gave us the perfect bounce off 3272, launching into 3433 for THE test of resistance. That move delivered another clean 160+ pip rotation, once again showing how laser accurate the structure has been.
As expected, 3433 held as resistance, and the lack of a break and hold above confirms another clean rejection. The range between 3272 support and 3433 resistance remains firmly in play, and structure continues to govern price action to the pip.
Here’s where we are now:
🔹 Range Still Active
Price continues to rotate inside our 3272–3433 box. Until we see a clean break and close beyond either boundary, we’ll keep playing the range.
🔹 No Breakout = No Change
The failure to break and lock above 3433 confirms rejection. We’re still looking for EMA5 lock for potential breakout confirmation, until then, range trades rule.
🔹 Precision Holds
Both 3272 and 3433 have now been tested and held perfectly. The respect these levels continue to show reaffirms their importance in our roadmap.
Updated Key Levels
📉 Support – 3272
Continues to act as a major pivot. Valid long entries remain on dips into this zone, unless a breakdown occurs.
📈 Resistance – 3433
Now officially tested and confirmed. Watching closely for any future breakout attempts or another rotation lower.
Thanks again for all the amazing support. Sticking to the plan, trading the structure, and staying disciplined.
Mr Gold
GoldViewFX

GOLD Breakdown Setup | Clean Sell Targets Ahead!XAU/USD (Gold) Analysis – 2H Timeframe
After a clear rejection from higher levels, Gold has pulled back to retest the broken support zone around 3340–3350, which now acts as a resistance.
If the price sustains below this zone, we can expect a smooth move down toward clean liquidity areas below.
This is a textbook bearish continuation setup. 💥
🔻 Trade Idea – Short Setup:
• Sell Below: 3,340
• Target 1: 3,300
• Target 2: 3,280
• Stop Loss: 3,355 (above resistance zone)
🧠 Confluences:
• Bearish market structure
• Support zone retest
• Trend continuation
• High-impact USD news ahead (watch for volatility)
📅 Key Dates: July 30 – Aug 1
⚡ NY session could trigger the move!

XAUUSD📈 XAUUSD (Gold) – Buy Setup | 4H Timeframe
Market Context:
After continuous selling, price is now testing a strong 4H and Daily support zone.
A clear bullish candle has formed, signaling potential reversal.
— proper SL is essential.
🔔 Trade Plan: Buy Gold
Entry: Stop Loss: TP mentioned in charts

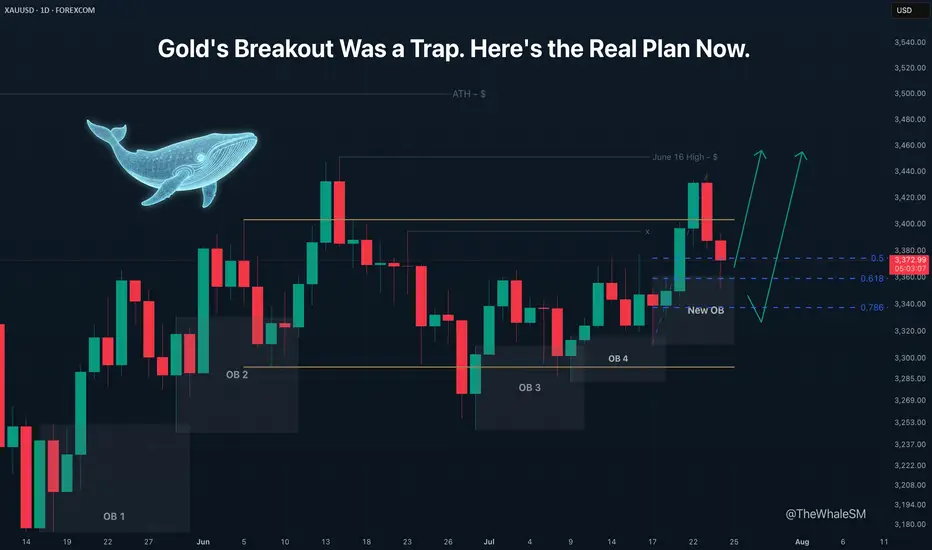
Gold's Breakout Was a Trap. Here's the Real Plan Now.Gold has made its next move, and it was quite sharp. I was expecting a smoother correction with a return to the manipulation zone, but Gold followed a different scenario, which I described at the end of my last gold analysis:
Gold has practically confirmed its breakout from the global range it has been in since the beginning of June. The only thing that could prevent this is a complete engulfing of the bullish daily candle that broke the upper boundary of the range by a bearish candle, but I consider this an unlikely scenario.
The closed red daily candle, which completely engulfed the preceding bullish one, showed that the move was, in fact, an internal liquidity sweep . The price has not yet managed to break out of the range. Therefore, when I wrote "Gold has practically confirmed its breakout from the global range" , the daily candle had not yet closed, and the price had not secured its position above the range's upper boundary.
Essentially, it's not important how the price arrives at a Point of Interest (POI) . What matters is what we have now: the price has mitigated a manipulation in the form of a new daily order block that was formed inside the range.
Although the middle of a range is a highly unpredictable area for price movement, and I almost never consider it for entries, in this case, there is a strong exception that allows us to consider longs from this order block. The reason for this exception is the bullish order flow on the daily structure, which I have mentioned several times, and the ascending daily structure within the range. This structure allows us to identify the start of the last impulse and draw Fibonacci retracement levels, which will serve as an additional condition for our potential long setup. We can now see that the price has reached the 61.8% Fib level and has shown a reversal reaction to it. To see more precisely if there is a potential entry point, let's switch to the 4H timeframe.
On the 4H chart, we see that the 61.8% level has held, and we can look for entry confirmation on a lower timeframe. The 4H timeframe also shows that the liquidity sweep created a supply zone , which will act as resistance on the path of the next attempt to break out of the range. Due to this zone, considering a long from the current position is not optimal because the risk-to-reward ratio is too small. Furthermore, the price could reject from this supply zone and continue its correction to the next level, the 78.6% Fib level . To find an entry with a more acceptable R:R, let's move to the lower timeframes.
Two Potential Long Scenarios
SCENARIO 1: Entry from the 15M Demand Zone or 15M OB
The 15M timeframe shows a break of the 15M structure and the formation of manipulations in the form of a demand zone and a 15M order block within it.
► Setup Condition: I will consider a long position upon the mitigation of one of these manipulation zones and a clear reversal reaction from it. If the price continues to move up from the current levels, I will not enter due to the large stop loss required and the suboptimal R:R to the nearest resistance.
► Invalidation: A break below these support zones on the lower timeframe will invalidate this scenario.
SCENARIO 2: Entry from the 78.6% Fib Level
This scenario becomes active if the first one fails.
► Setup Condition: If the price breaks the 15M supports, I will watch for its interaction with the 78.6% Fib level . For a potential entry, this level must hold, show a reversal reaction, and be followed by confirmation on a lower timeframe.
► Invalidation: A decisive close below the 78.6% Fib level.
~~~~~~~~~~~~~~~~~~~~~~~~~~~~~~~~~~~~~~~~~~~~~~~~~~~~~~~~~~~~~~~~~
The principles and conditions for forming the manipulation zones I show in this trade idea are detailed in my educational publication, which was chosen by TradingView for the "Editor's Picks" category and received a huge amount of positive feedback from this wonderful, advanced TV community. To better understand the logic I've used here and the general principles of price movement in most markets from the perspective of institutional capital, I highly recommend checking out this guide if you haven't already. 👇
P.S. This is not a prediction of the exact price direction. It is a description of high-probability setups that become valid only if specific conditions are met when the price reaches the marked POI. If the conditions are not met, the setups are invalid. No setup has a 100% success rate, so if you decide to use this trade idea, always use a stop-loss and proper risk management. Trade smart.
~~~~~~~~~~~~~~~~~~~~~~~~~~~~~~~~~~~~~~~~~~~~~~~~~~~~~~~~~~~~~~~~~
If you found this analysis helpful, support it with a Boost! 🚀
Have a question or your own view on this idea? Share it in the comments. 💬
► Follow me on TradingView to get real-time updates on THIS idea (entry, targets & live trade management) and not to miss my next detailed breakdown.
~~~~~~~~~~~~~~~~~~~~~~~~~~~~~~~~~~~~~~~~~~~~~~~~~~~~~~~~~~~~~~~~~
Follow master candle for today's SELL strategy✏️ OANDA:XAUUSD has continued a strong downtrend. Yesterday's D1 candle closed with a 60-price decrease, forming a master candle that determines the market trend. With the market having a master candle, pay attention to the 25% or 50% candle zones to trade in the direction of the trend. Today's main trading strategy will be to SELL according to the master candle. The BUY strategy will only be implemented when the 3313 zone is broken.
📉 Key Levels
Support: 3285-3270-3250
Resistance: 3301-3312-3333
SELL Trigger. Rejection 3301, 3312
Target 3250
Leave your comments on the idea. I am happy to read your views.

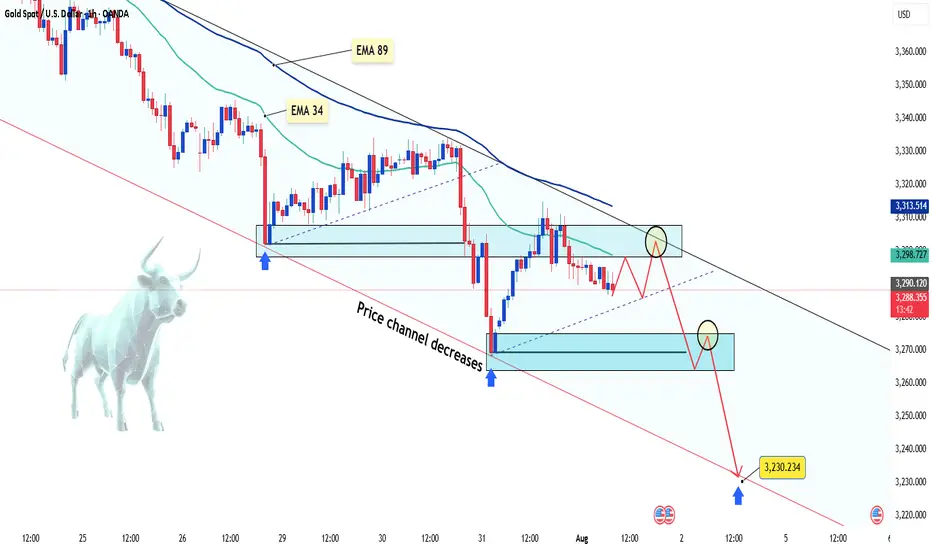
Gold keeps falling – is there more to come?Hello everyone, great to see you again!
Today, gold remains under pressure following a series of strong U.S. economic data releases, which have reinforced expectations that the Federal Reserve will keep interest rates elevated for longer. As a result, the U.S. dollar has strengthened, Treasury yields have climbed, and gold has lost its footing.
On the H1 chart, XAUUSD is clearly trading within a descending price channel. Both the EMA 34 and EMA 89 are acting as dynamic resistance zones. Recent attempts to rally have consistently failed at these levels, mirroring the bearish setup seen before July 29.
Currently, price is retesting a minor resistance area. If this retest fails, the next downside targets lie near 3,270 – and potentially down to 3,230 USD, which aligns with the lower boundary of the price channel.
From my perspective, the bearish momentum is likely to continue.
What about you? How do you think gold will close the day?
My first take on XAUUSDI see this last fall as a very clear sweep of liquidity (the recent lows. After that i see an impulsive push away from this zone giving me a change of character. Left behind is an FVG on hopurly chart that aligns within the kill zone on my Fibonacci tool. and that is where i would enter. I would expect price to mitigate this FVG. Another confluence is that we created many IFVG's on the way up showing balanced price action. Only one more confluence i would have liked is a HTF order block from the liquidity sweep but only have one on the 5 minute. i will monitor. First tp is that internal liquidity from the move, second tp is the external liquidity where we have had consolidation and a few failed attempts to break above this opening gap fvg. thanks for looking. any comments welcome,

XAUUSD – the calm before the next breakout?Hello traders, what’s your take on the current trend in OANDA:XAUUSD ?
Looking back over the past 12 months, gold has delivered a truly impressive performance. From around $2,380 in August 2024, the precious metal surged to an all-time high of $3,432 by April this year — a gain of more than $1,000 in less than a year. But what’s more telling than the rise itself is how the market behaved afterward: instead of crashing, gold has maintained a high consolidation range, suggesting the uptrend is still very much alive.
This powerful rally didn’t happen in isolation. In a world marked by uncertainty, gold has once again asserted its role as a safe-haven asset. Inflation remains persistent across major economies, geopolitical tensions continue to stretch from Eastern Europe to the Middle East and Asia, and de-dollarization efforts by countries like China and Russia are reshaping global capital flows. None of these events alone could shake the markets, but together, they have laid the groundwork for gold’s sustained relevance.
From a technical standpoint, the long-term bullish structure remains intact. Following its peak at $3,432, gold has entered a modest correction phase — one that may well be a healthy consolidation before the next directional move.
Interestingly, while many investors remain cautious, the chart paints a different story: a market that isn’t afraid, but simply catching its breath. The real question is no longer “Can gold hold above $3,400?” but rather “Is the market gearing up for a fresh breakout — or a deeper correction?”
We may not be able to predict the future, but we can observe how price reacts at key levels. And sometimes, it’s in these seemingly quiet phases that the biggest turning points begin to form.
What do you think — is gold preparing for another leg up?
Drop your thoughts in the comments below! 👇
