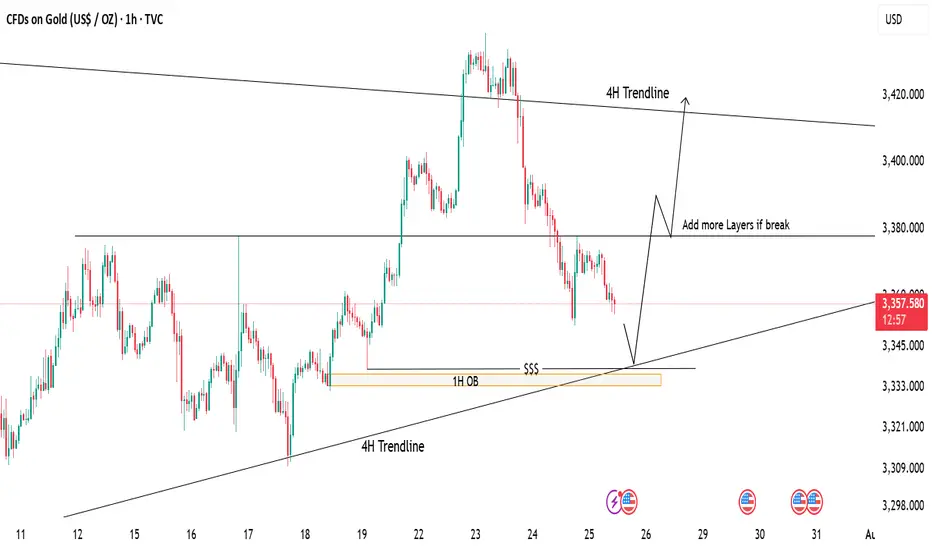
Gold Tapping Into Major Support – Eyes on Bullish ReversalPrice is currently retracing after a strong drop from recent highs. We're now approaching a key demand zone, aligning with:
📍 1H Order Block (OB)
📍 4H Trendline Support
📍 Liquidity Zone ($$$)
📉 If price taps into this area, it may offer a high-probability long setup.
📈 First target: 3380 (mid-range resistance)
🧱 If this breaks, we can look to scale in/add more positions, targeting the 4H trendline zone near 3420.
⚠️ Waiting for price reaction at support – patience is key!
GOLDCFD trade ideas
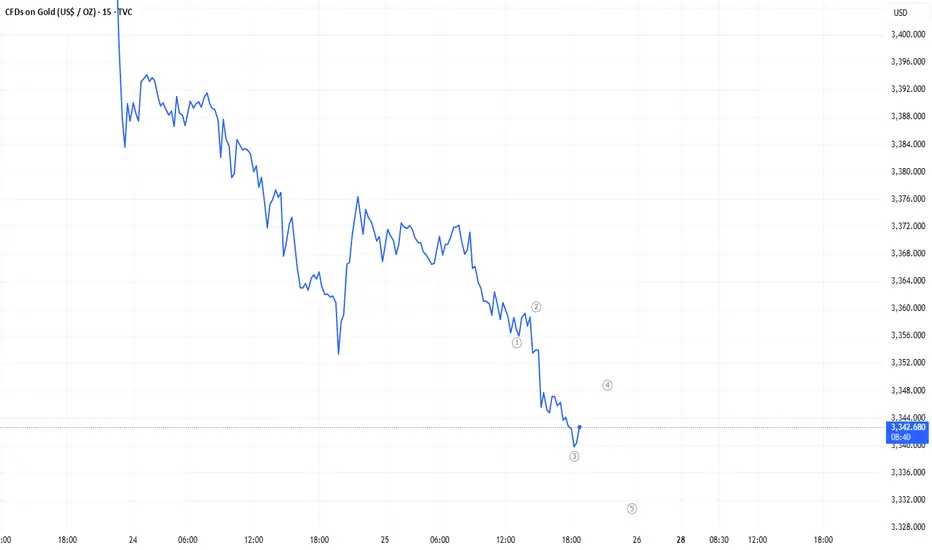
Elliott waveelliott 5 wave structure bearish continuation
sell limit 3347-3350 stoploss 3355, tp 3320
CONFLUENCE We might see GOLD using this confluence to go up. Gold is currently trending upwards, therefore we might see it continuing with that trend


gold bearishgold has not respected any support ony to H4 3351.
will it make its way up from here. only candle stick reaction to tell us.
however the safest trade for today to end the week is shorts.

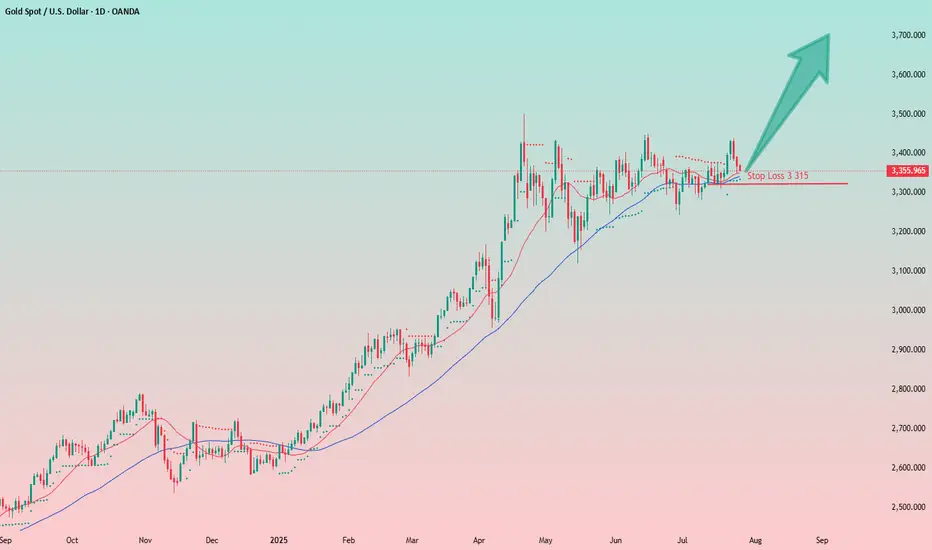
Gold Trade Against the Odds: When Emotion Meets StrategyThis may not be the best decision right now — I understand that — but it's one of those " I'm exhausted and just want to buy " moments.
The setup isn’t fully formed yet, but I have a strong feeling we’re going higher. I like the chart structure: low volatility, a spike to 3430 followed by a pullback to the moving averages without breaking key levels. I also like the tight stop at 1.2%.
I’m buying gold at the current level, around 3355.
📝Trading Plan
Entry: I’m buying gold at the current level, around 3355
Stop Loss: Stop at 3315
Target: 3425, 3500, and beyond.
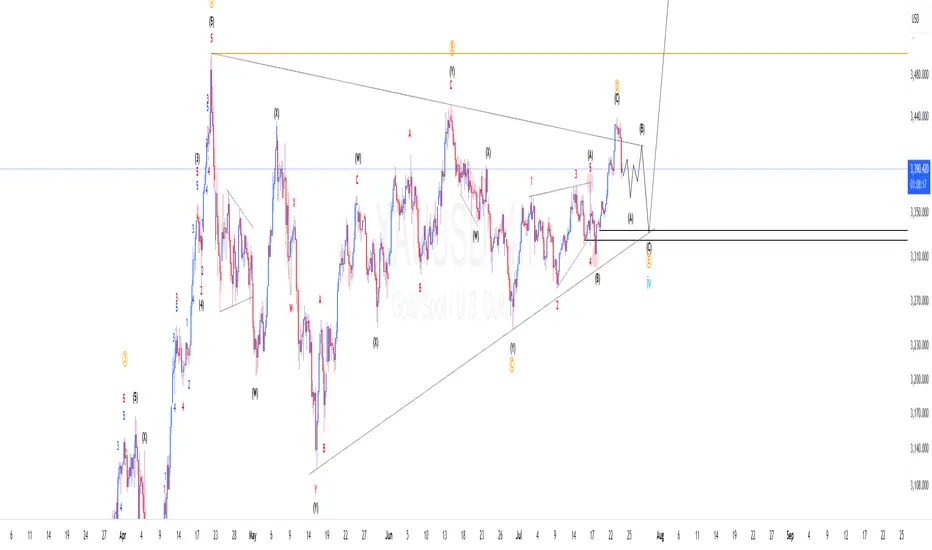
XAU/USD – Likely Wave ⑤ Top In – ABC Correction in Progress!OANDA:XAUUSD
✅ We’ve most likely completed our (Circle) Wave ⑤, and are now entering the first corrective wave of an ABC pattern (marked in 🟡 yellow brackets).
🔹 The (A) wave unfolded as a clean white ABC correction – textbook structure, worked out perfectly.
🔹 From (A) to (B) we saw an impulsive move (likely a 1-2-3-4-5, though not labeled).
🔻 From (B), a strong bearish move broke right through our 🔴 ascending trendline, signaling a potential trend reversal.
👉 We’ve likely completed wave 1 of the new downtrend and are now in a corrective move upward, forming yellow wave 2:
🟡 (A) – (B) – (C), with the (B) once again forming an internal ABC structure.
🎯 We’re now watching for the completion of wave C – this will complete yellow wave 2.
📐 The target zone (TP) lies in the yellow Fibonacci retracement area, with a key level at the 78.6% retracement (marked in white).
🛑 Stop Loss should be placed above the 4-month zone, or just above wave (B).
📊 The Take Profit will be more precise once the top of wave C is confirmed – but expect it to align closely with the 🔵 Fibonacci extension zone.

Buy level GoldStrong buy expected from our marked level strong buy trend line and fresh bullish engulfing level
Wait LTF confirmation then buy

Gold Bullish Momentum still strongGeneral trend and momentum is still to the upside. We now have a nice pullback and an opportunity to buy low again. Price is currently reacting to an H1 TF demand zone. If this zone breaks, look for entries in H4 demand and continue to ride the bulls to All Time Highs.

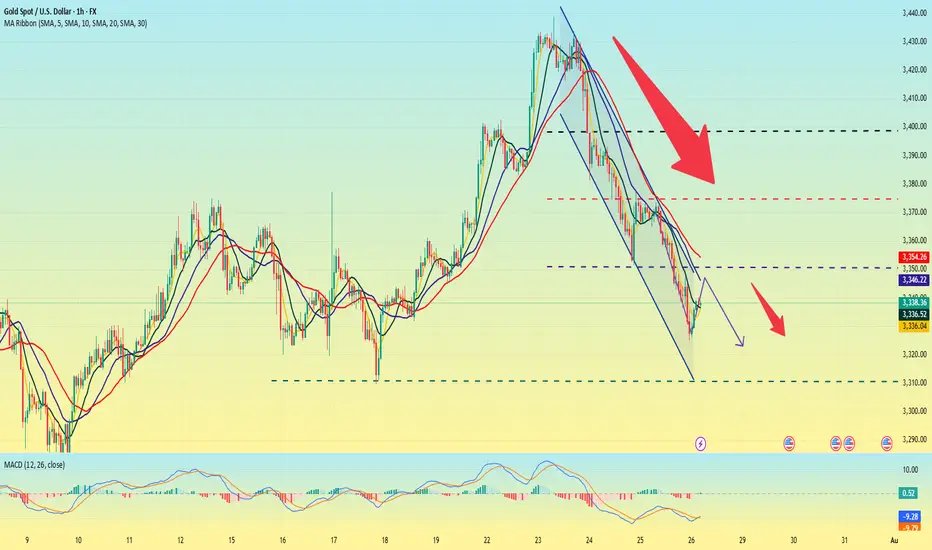
Gold is going down. It may continue next week.On the last trading day of this week, the bears attacked strongly and continued to refresh the recent lows, reaching the lowest point near 3325 before stopping.
From Monday's 3345 to 3440, it closed near 3337. This week, it also walked out of the large range roller coaster pattern, and all the strengths in the previous period did not exist. Under the continuous downward trend, the bulls were also vulnerable, and there was not even a strong rebound, which indirectly explained the strength of the bears in the short term.
As for the current trend, the bears are likely to continue to be strong, and before there is a symbolic upward breakthrough, we still need to maintain the idea of shorts to operate. The current upper pressure is maintained near 3350, which is also the bottom position touched for the first time in the previous period. It is possible that it will be transformed into a top-bottom conversion pattern; and the strong support level below is near 3310.
When the Asian market opens next Monday, we need to pay close attention to whether there is a gap problem on both the bulls and bears. After three consecutive negative daily lines, all the moving average systems have been broken, and it is also likely to form a resonance pressure pattern. On Monday, gold will first touch around 3350 and continue to short. The profit range will be around 3330-3320, and the stop loss will be 3360. If the European session is stronger, you can adjust the point before the US session.
xauusdxauusd sell 3432 Gold is in an ascending channel. I think it could pull back from these areas. We need to see how the next 4-hour candle will close.

XAUUSD Elliotwaves updateWe are yet to complete wave 4. So far the structures supports the triangle correction and price completed wave "d" and started final wave "e". If we are correct we should expect price make another 3 waves down to complete wave 4 and then resume the bullish momentum. To take advantage of the overall trend one should find areas where price has high probability of finding support to take the trade.
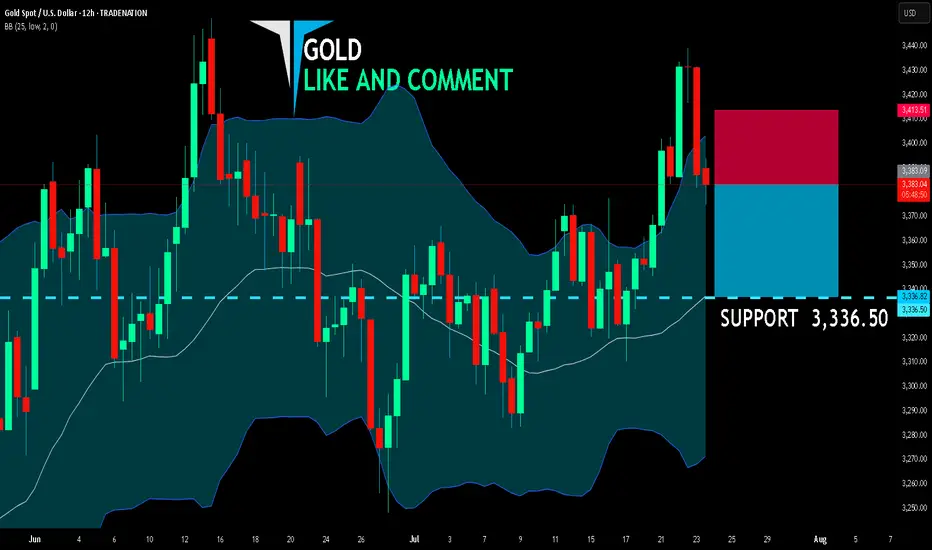
GOLD BEARS ARE STRONG HERE|SHORT
GOLD SIGNAL
Trade Direction: short
Entry Level: 3,383.09
Target Level: 3,336.50
Stop Loss: 3,413.51
RISK PROFILE
Risk level: medium
Suggested risk: 1%
Timeframe: 12h
Disclosure: I am part of Trade Nation's Influencer program and receive a monthly fee for using their TradingView charts in my analysis.
✅LIKE AND COMMENT MY IDEAS✅
Gold technical outlook – Signs of exhaustion at channel topOANDA:XAUUSD is climbing within a well-defined ascending channel, and price is now brushing up against the upper boundary, a dynamic resistance zone that has historically triggered pullbacks. If price gets rejected here, we may see a healthy correction toward the key support at 3,350, offering a potential reload point for bulls.
Should buyers step in and defend this level, the bullish structure remains intact, setting the stage for a renewed push higher. On the other hand, a clean break below 3,350 could open the door for a deeper retracement toward the lower edge of the channel, where more significant demand may lie.
All eyes should be on price action and volume in this regio, watch for reversal patterns like bullish pin bars or engulfing candles to confirm entries. As always, risk management comes first. Don't trade assumptions, trade confirmations.
What’s your take on this setup? Drop your thoughts below and let’s discuss!

SMC Strengths of the Analysis
• ✔️ Clear bearish structure (ChoCH + BOS + fake out)
• ✔️ Mitigation target (1H FVG not yet closed)
• ✔️ SL well protected outside the manipulation zone
• ✔️ Logical entry right where the imbalance begins

XAUUSD correction in progress Next target 3460-3470XAUUSD was trading in a up trend and currently consolidating, At the fib 0.5 and support channel support trendline both overlap at 3410-3415 area from where the price may resume again up the target can be 3460. let us see.

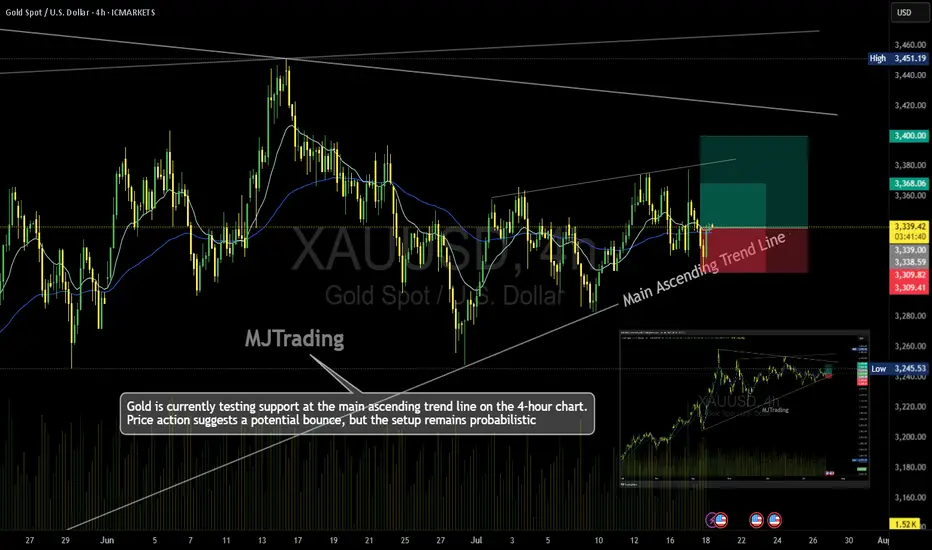
Gold (XAU/USD) – 4H Time Frame Trade Idea📈MJTrading:
Gold is currently testing support at the main ascending trend line on the 4-hour chart. Price action suggests a potential bounce, but the setup remains probabilistic—ideal for traders who operate on higher time frames and manage risk with discipline.
🔹 Trade Setup
Entry: 3340
Stop Loss: 3309
Take Profit 1: 3368
Take Profit 2: 3400
🔍 Technical Context
Price is respecting the long-standing trend line, hinting at bullish continuation.
Risk-reward ratio is favorable, especially for swing traders.
A break below the trend line invalidates the setup—hence the tight SL.
⚠️ Note: While the trend supports upside potential, failure to hold the trend line could trigger deeper retracement. Trade the probabilities, not the certainties.
In case it's not shown properly on your monitor because of different resolutions:
Psychology Always Maters:
#MJTrading #Gold #XAUUSD #Trend #Trendline #Forex #Chart #ChartAnalysis #Buy #Long
GOLD SELL POSITIONPrice have been correcting the last move down and now is showing a strong resistance at this level. expect price to move down in any news coming soon from US session.

Very Strong Short!Hello all. as you see market needs a new lower low. a little above we have an Strong level that in throw the market down. be happy and Trade it if your method confirm. (wink)

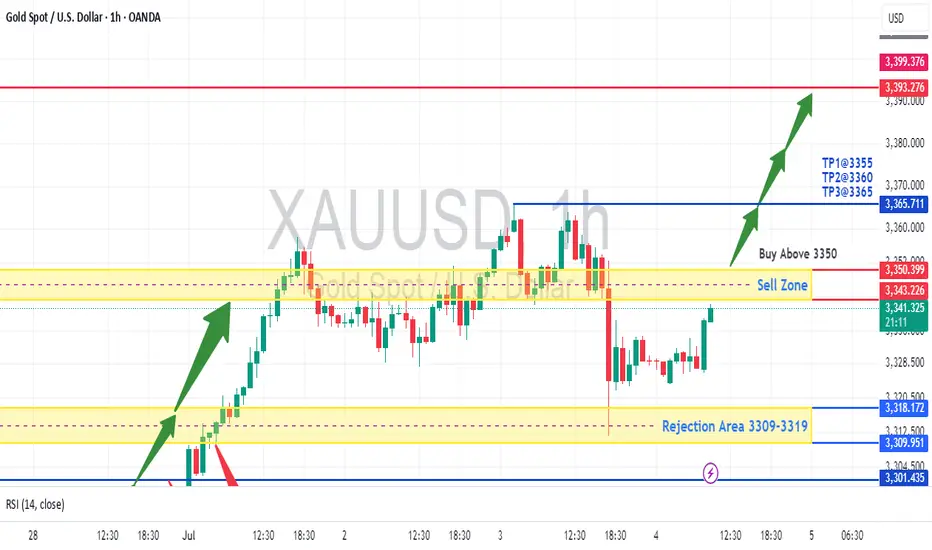
XAUUSD - Retesting 3400 before DeclineThe chart shows a potential buy setup for gold (XAUUSD) with the following key points:
Price Action: Gold is trading at 3,341.465, above the suggested "Buy Above 3350" level, indicating a bullish bias.
Support/Resistance: The rejection area at 3309-3319 held as support, and price has moved higher, confirming buyer interest.
Take Profit Levels: TP1 (3355), TP2 (3360), and TP3 (3365) provide clear upside targets.
RSI Confirmation: The RSI (14) at 54.21 shows moderate bullish momentum without being overbought.
Volume & Close: The slight increase in price (+0.09%) with supportive volume suggests accumulation.
Trade Idea: Enter long above 3350 with stops below 3309, targeting TP1-TP3. The rejection zone and RSI support further upside.
Disclaimer: This is not financial advice. Please consult with a financial advisor before making any investment decisions. We are not responsible for your loss because we are not SEBI registered and this analysis based on technical aspects and only for educational practice. Do your own research.
Gold XAUUSD Sell in trendline completion stageGold XAUUSD Sell in trendline completion stage - short term trade. now in 4th touch. bounce back to test previous level testing and return back to support again and it will break to test the sellers.

Gold Buy OfferIn 4H time frame there is a good Demand area in 3309.5-3351 price.
Ofcourse it is a thick one and S/L would be too far. So I prefer to enter the Buy position in the middle it .( some price around 3330 if drops )

XAUUSD 4HOUR TIME FRAME ANALYSISOn the 4-hour chart, XAUUSD has recently pulled back into a well‐defined demand zone just above 3 330, offering a low-risk entry around 3 338. Here’s how the setup looks:
Trend Context
• Over the past week, gold has carved out a gentle up-slope, tracing higher highs and higher lows from 3 300 up toward 3 395.
• Price dipped back to test the rising 50-period moving average.
Key Levels
• Entry (3 338): Aligns with the confluence of the 50-period MA and a horizontal support zone (3 330–3 340), where buyers staged a rally earlier in the week.
• Stop-Loss (3 307): Placed just beneath the swing low at 3 315 and below the trendline connecting the last two higher lows—giving room for noise while protecting against a deeper reversal.
Momentum & Oscillators
• RSI (14): Currently around 45, rising from the 40 region. This suggests bearish exhaustion is waning and room remains before overbought conditions.
