GOLDCFD trade ideas
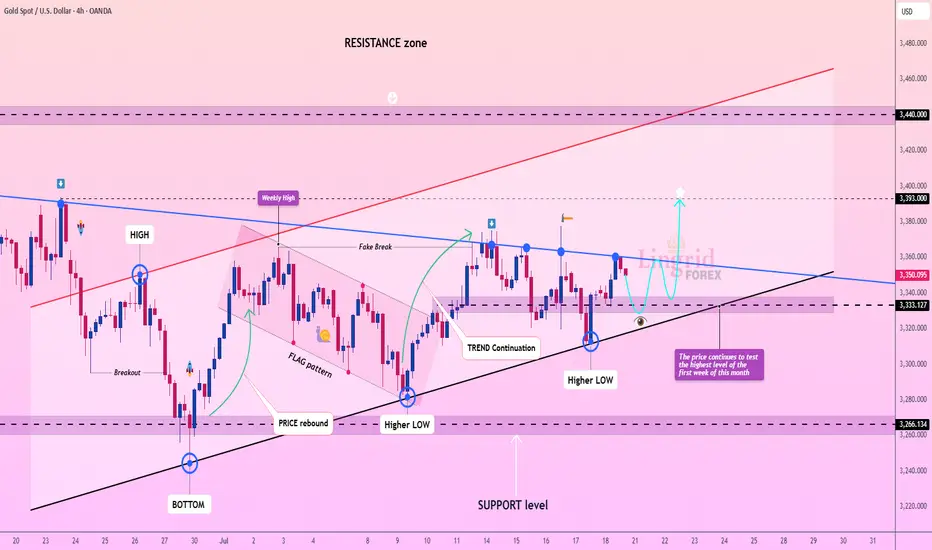
Lingrid | GOLD Weekly Analysis: Testing Resistance ZoneOANDA:XAUUSD markets are showing renewed strength as prices continue to test the highest levels reached in the first week of this month, demonstrating persistent bullish momentum despite ongoing consolidation. The precious metal is approaching a decisive technical juncture that could determine the next major directional move.
The chart reveals a compelling technical setup with gold forming higher lows while maintaining the upward trend continuation. After the previous fake breakout and flag pattern completion, the market has established a solid foundation above the $3,330 support level. The current structure shows a series of higher lows, confirming the underlying bullish bias.
The weekly high retest presents a crucial inflection point. A successful break above this level could trigger the next major leg higher toward the $3,400+ target zone, particularly given the ascending triangle formation and persistent institutional interest. The convergence of multiple technical indicators, including the trend continuation pattern and higher low formation, suggests accumulation at current levels.
Key levels to monitor include the immediate resistance at $3,393 and the critical $3,450 level. A decisive break above these levels would likely accelerate momentum toward $3,500-$3,600, while failure to maintain the higher low structure could see a pullback toward $3,285 support. The overall technical picture remains constructively bullish within the broader uptrend.
If this idea resonates with you or you have your own opinion, traders, hit the comments. I’m excited to read your thoughts!
Gold analysis WednesdayHello guys today I update the gold price action analysis, some parts of my journey and plan, and how we must prepare for every scenario that would come. Thankyou for watching

GOLD | Bullish Bias Amid Fed & Trade Policy UncertaintyGOLD | Bullish Bias Amid Fed & Trade Policy Uncertainty
Gold prices edge higher as markets weigh conflicting signals from the Federal Reserve and renewed trade policy uncertainty. Diverging opinions among Fed officials regarding the inflationary impact of President Trump's proposed tariffs have fueled demand for safe-haven assets.
While some members like Waller and Bowman appear open to rate cuts, others remain cautious about lingering inflation risks, adding to market volatility.
Technical Outlook:
Gold maintains bullish momentum above 3365. A break and hold above this pivot supports continuation toward 3375, and if momentum builds, toward 3385 and 3395.
However, any sustained move below 3365 may trigger a bearish correction toward the support zone between 3355 and 3342.
Pivot Line: 3365
Resistance Levels: 3375 · 3385 · 3395
Support Levels: 3355 · 3342
Bias: Bullish above 3365

XAUUSD Bullish ScenarioAccording to the data in the chart, the price has proven its bullishness by breaking important levels. Overall analysis can be buying at $3340 towards the target of $3450. On the other hand, if the price breaks $3340 with strength, the bullish scenario can fail.

Gold prices are under pressure, focusing on the Fed stormGold prices are under pressure, focusing on the Fed storm
Weekly gold price report: The rebound of the US dollar suppresses precious metals, and the market focuses on the Fed's policies and trade negotiations
Market review
On Friday (July 26), the international gold price was under pressure to fall, with spot gold falling 0.9% to $3,336.01/ounce, and COMEX gold futures closing down 1.1% to $3,335.6/ounce. The US dollar index rebounded from a low of more than two weeks, and the progress in US-EU trade negotiations weakened the demand for safe havens, which jointly suppressed the performance of precious metals.
Analysis of core influencing factors
The US dollar and trade situation
The US-EU trade agreement negotiations have entered a critical stage. The EU said that "the agreement is just around the corner", but member states still approved the potential counter-tariff plan. US President Trump said that he will negotiate with the EU on Sunday, with a probability of 50%. If the agreement is implemented, it may further suppress the safe-haven properties of gold.
The recent trade agreement between Japan and the United States also boosted market risk appetite, and funds flowed to risky assets.
Fed policy expectations
Despite the resilience of the US labor market (initial jobless claims fell to 217,000 last week, the sixth consecutive week of decline), the market generally expects the Fed to keep interest rates unchanged at its July meeting.
Trump has recently pressured the Fed to cut interest rates and even made a rare visit to the Fed headquarters, sparking discussions on policy independence. Some analysts believe that if inflationary pressures ease, the Fed may release dovish signals in the second half of the year.
Fund positions and central bank demand
As of the week of July 22, hedge funds' net long positions in gold increased to 170,868 contracts, the highest level since April, reflecting the market's long-term concerns about trade tensions.
Central bank gold purchase demand still provides structural support for gold prices.
Geopolitical dynamics
Israeli-Palestinian conflict: Hamas said that the ceasefire negotiations have made progress, but the US statement caused a surprise, and the progress of subsequent negotiations may affect market sentiment.
Russia-Ukraine situation: Turkey coordinates all parties to hold a leaders' summit in Turkey. Russia and Ukraine have agreed in principle to meet, and potential peace plans may reduce the safe-haven premium.
Outlook for the future
Key short-term events:
US/EU/China trade negotiations: If progress is optimistic, gold prices may fall to the support level of $3,300/ounce.
Federal Reserve July resolution: Pay attention to the policy statement's hints on the path of interest rate cuts and the Fed's response to political pressure.
US non-farm data: If the employment data is strong, it may strengthen the expectation of "higher for longer" interest rates.
Technical aspect: Near $3,300/ounce may attract buying, but breaking through the previous high requires clearer signals of monetary policy shift.
Risk warning: Repeated trade negotiations, escalating geopolitical conflicts or unexpectedly dovish Fed may reverse the decline in gold prices.

Gold : Sell Continuation Gold: Top Formed at Major Supply Zone 🔻 | 4H Reversal Setup
Looking for continuation after bearish BOS. Targeting clean liquidity below. SL above structure. R:R ~3:1

Simple Swing Trading Strategy with Smart Money Concept Explained
I will share with you the essential basics of swing trading forex gold with Smart Money Concepts.
You will learn how to do swing trading with the best SMC strategy.
I will teach you to c ombine order blocks, liquidity zones and imbalances to spot accurate entries and confirmation signals.
If you just started learning swing trading Forex with Smart Money Concepts, I strictly recommend trading with the trend only.
The cases and examples that we will discuss will be strictly trend-following ones.
Swing Trading with SMC in Uptrend
For swing buying any forex pair, we will look for the market that is trading in a bullish trend.
To confirm that the market is rising, you will need to execute structure mapping and find a forex pair that updates Higher Highs HH and Higher Lows HL.
Above is the example how I confirmed that GBPUSD is bullish with structure mapping. You can see that the pair consistently updates the highs.
Once you identified a bullish pair, your next step will be to find the zone from where the next swing move will follow.
According to the rules, the market remains in uptrend till the price is staying above or on the level of the last Higher Low HL.
Here is such a zone on GBPUSD.
It is based on the last Higher Low and current price levels.
We will assume that buying orders will concentrate within that area and from that a bullish rally will follow.
The problem is that this area is extremely wide, and we can not just buy randomly within.
Our next step will be to find liquidity zones within.
To buy, we need demand areas.
I found 4 price action based historic demand zones on GBPUSD.
We will need to wait for the test of one of these zones and then wait for an order block - a place where smart money are placing their buy orders.
The problem is that we don't know in which of these areas the order block is, so we will need to wait for tests of these zones and a consequent imbalance to confirm it.
To confirm a bullish imbalance for swing trading Forex, I recommend analyzing a 4H time frame after a test of a demand zone.
According to Smart Money Concepts, a bullish imbalance can be any sign of strength of the buyers : bullish breakout of a vertical/horizontal resistance, change of character, high momentum bullish candle, bullish price action pattern, etc.
An order block on GBPUSD was confirmed with a breakout of a resistance line of a falling channel on a 4H time frame.
That was the signal that Smart Money are buying, and that is your signal to open a swing long trade.
You place a buy position then with a stop loss below the order block and a target - at least a current high.
Swing Trading with SMC in Downtrend
For swing selling any forex pair, you will need to find a market that is trading in a bearish trend.
I suggest applying structure mapping to identify such a pair.
It simply should update Lower Lows LL and Lower Highs consistently.
USDCAD is trading in a bearish trend.
Structure mapping helps to easily confirm that.
Then, we will need to identify the zone from where the next bearish wave will start.
According to Smart Money Concepts structure mapping rules, the market remains bearish till the price is staying below or on the level of the last Lower High LH.
That's such a zone on USDCAD.
It is based on current prices and the last Lower High.
We will assume that selling orders will be distributed along the entire lenth of our zone.
Of course, we can not sell randomly within that zone because it is relatively extended.
Our next task will be to find liquidity supply zones within.
I found 2 price action based supply zones within our underlined area.
Before we sell, we will need to find an order block.
A place from where smart money are selling big.
To spot that, I suggest waiting for a test of one of our supply zones and wait for a bearish imbalance on a 4H time frame.
According to SMC, a bearish imbalance can be a bearish high momentum candle, a bearish CHoCH, a bearish price action pattern, a bearish breakout of a horizontal/vertical support , etc.
You can see that a lower supply zone was tested on USDCAD.
Our bearish order block confirmation is a bearish Change of Character, a formation of a high momentum bearish candle and a breakout of a rising trend line.
After that we can open a swing sell position and expect a bearish movement at least to a current low.
Stop loss should lie strictly above the order block.
TP should be at least a c urrent low.
That is how a trade should be executed on USDCAD pair.
Remember that there is no guarantee that the order block will be within a liquidity zone. You should learn to track the signs of smart money and their operations.
A proper combination of a trend analysis, liquidity zones and order block is the essential basis of a profitable swing trading Forex.
Mastering that, practice recognizing the imbalances and confirmations for spotting the best swing trading entries.
❤️Please, support my work with like, thank you!❤️
I am part of Trade Nation's Influencer program and receive a monthly fee for using their TradingView charts in my analysis.

XAUUSD Path Going As per Previous Ideas Analysis Discussed.XAUUSD Path Going As per Previous Ideas Analysis Discussed in the images above for further information or Previous Analysis refer previous Ideas.

Gold Trade SetupI will risk!!!
It seems we are near at the end of correction wave...
The first target R/R is 2 and the second is 4...

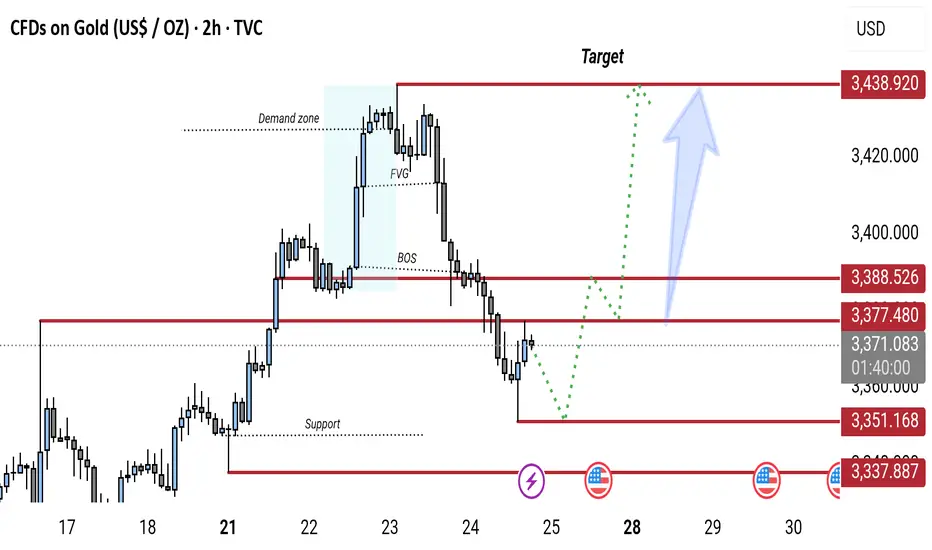
Gold 2H Chart: Bullish Reversal Expected from Key Support ZoneGold (XAU/USD) 2H chart shows a bearish break of structure (BOS) followed by a pullback toward a key support zone (around 3,337–3,351). A potential bullish reversal is expected from this zone, targeting the 3,438 resistance level. The chart highlights a demand zone, FVG (Fair Value Gap), and possible retracement before continuation to the upside.
Hellena | GOLD (4H): LONG to resistance area of 3498 (Wave 3).The price continues to move in a bullish direction, and I believe that now is the time to pay attention to the medium-term wave “3.” It is actively developing, and I believe that the target should be set at the maximum area of the higher-order wave “3” — the resistance area of 3498.
This is the nearest target, which carries significant weight.
Overall, the upward five-wave movement is developing according to the old scenario.
Manage your capital correctly and competently! Only enter trades based on reliable patterns!

XAUUSD Traders - Turn Chaos into Pips with This StrategyHello Traders,
Struggling to trade XAUUSD due to its high volatility? Taking small profits but suffering big losses?
We’ve got your back.
Introducing Gold Sniper — a high-probability strategy specially crafted for XAUUSD traders. With a 65%+ win rate and a consistent 1:1.33 risk-reward ratio, it’s designed to help you catch sharp moves with confidence.
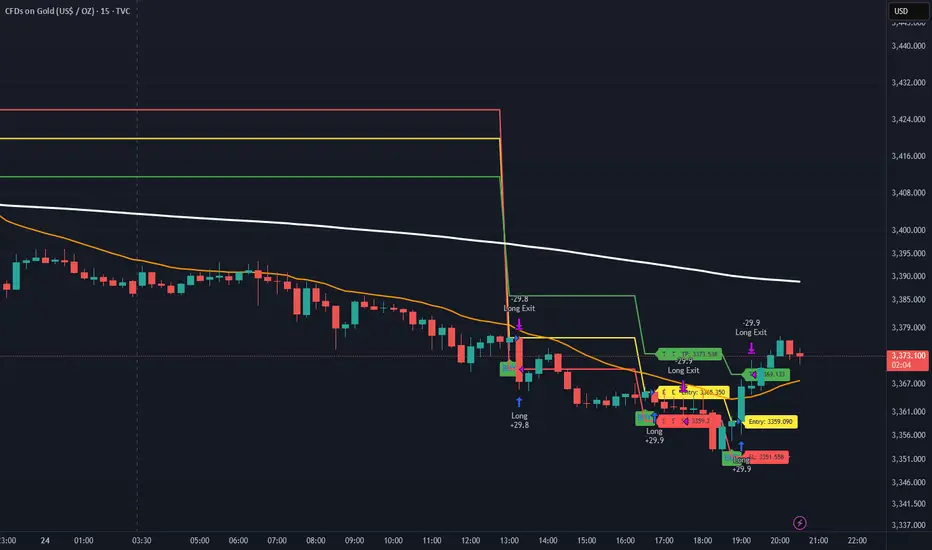
🚨 Live Performance Highlights:
Today’s Trades:
Signal 1
🟢 Buy @ 3365.350
🔴 SL @ 3359.209
🟢 TP @ 3373.538
❌ Result: SL Hit → 61 Pips Loss
Signal 2
🟢 Buy @ 3359.090
🔴 SL @ 3351.558
🟢 TP @ 3369.133
✅ Result: TP Hit → 75 Pips Profit
📊 Net Profit Today: +13 Pips
📅 Yesterday’s Profit: +150 Pips
✅ Gold Sniper helps you:
• Avoid fake breakouts
• Catch real momentum
• Stick to disciplined entries and exits
🎯 Want to boost your trading accuracy?
📩 DM us now to get access and start using Gold Sniper directly on your TradingView chart.
If you find this valuable, like the idea and show your support. Let’s grow together!
Happy Trading,
InvestPro India
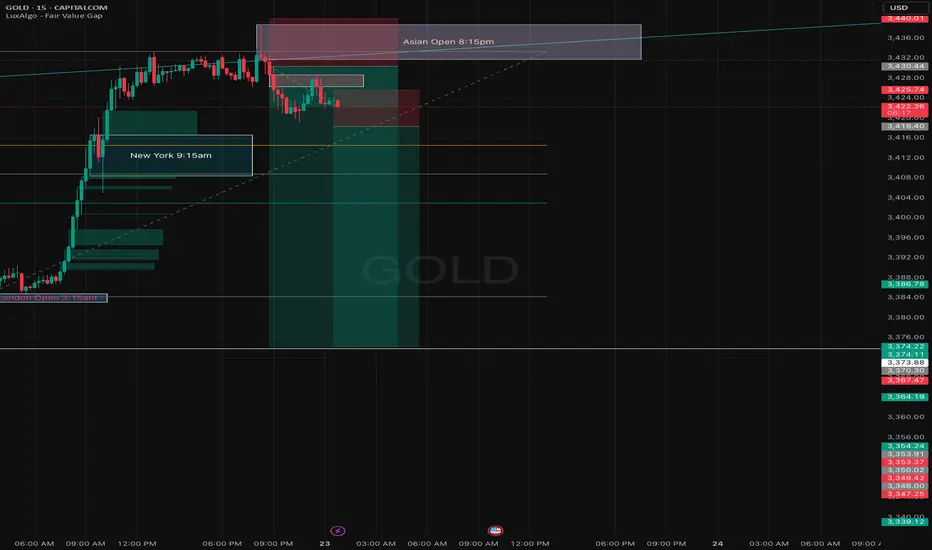
Gold Takes Flight, But Will Support Hold? Watch This Zone!Gold has broken its key resistance level in the New York session and, at the same time, has taken support from the trend line, which is pushing it upward. Currently, however, gold has also broken through another minor support level, and we can now observe that it is pulling back and moving downward.
It is advisable to remain patient at this stage. Wait for the market to come down to the zone where the previous resistance has now turned into support. If the price reacts positively at that level and shows signs of holding, we could potentially see a good buying opportunity from there.
As always, please conduct your own research (DYOR) before making any trading decisions. This is not financial advice.
