GOLDCFD trade ideas

Big money coming? Here, NFP data XAUUSD Technical Analysis PredDXY forecast today
XAU USD forecast today
EURUSD forecast today
NFP Data Forecast: Xauusd buys SELV sales for mass profit! Your latest gold trade guide confidently during the production of this most important wages is not related to the farm. In this video you will receive technical analysis from XaUUSD experts and proven adjustments for XaUUSD sales. It breaks down how you interpret forecasts for NFP data, how it affects gold prices, and where the best opportunities are. Whether you're a day trader or swing, this video gives you real information to plan your trade and plan your risk management as an expert. Don't miss this opportunity to turn your data into profits ahead of the market. Now look, trade more intelligently and go ahead with the crowd!
#NFPDATAFORECAST
#xauusd
#GoldTrading
#technicalalyasis
#forexsignals
#GoldPrice
#daytrading
#swingtrading
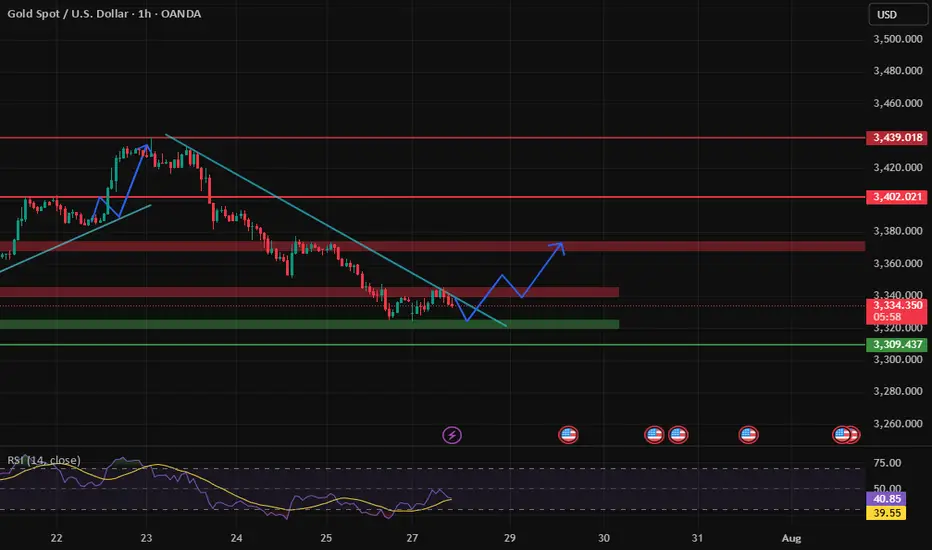
Head and shorder Head and shorder
Conformation on three time frame
Take sell on the second shorder formation
Target 1:3

LIVE BTC/USD, XAUUSD TRADING, 02/08/2025 SIGNALS PRICE ACTION TRLive BTC/USD, XAUUSD TRADING, 02/08/2025 signal price action trading strategy

Bullish Break of Structure on 4H XAUUSD – Targeting 3451.525 Price broke structure to the upside on the 4H chart, showing bullish intent. I expect price to continue higher toward the 3451.525 level, which looks like a key liquidity area. As long as price holds above the break, the bias remains bullish.

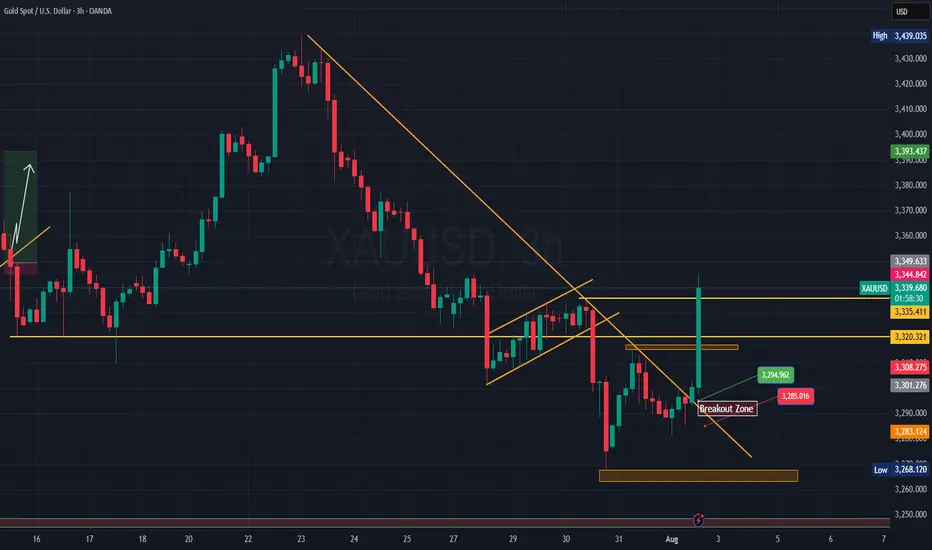
Gold is creating a downward structure in parallel channel.Hello IGT FOLLOWERS
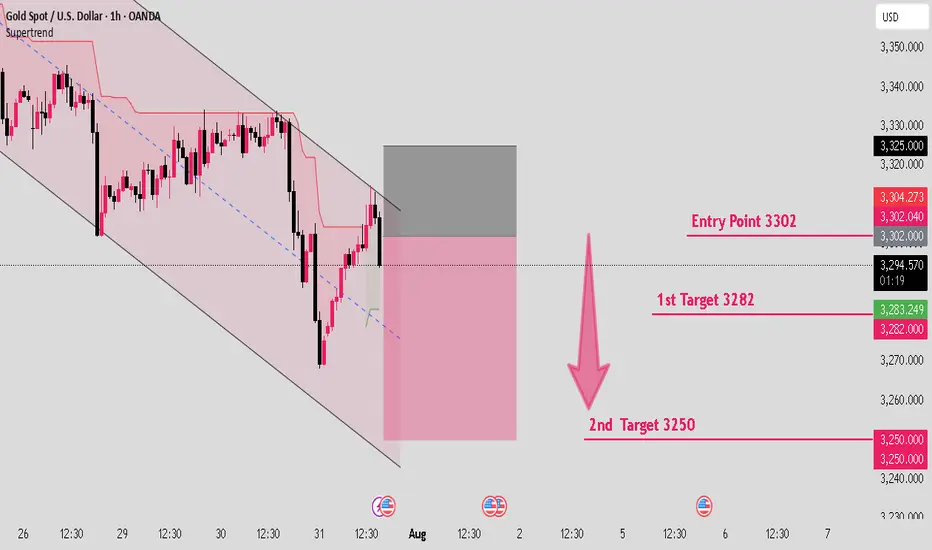
Here is my gold overview, According to me gold will fall because it is continously working in a downward parallel channel.. Bearish momentum visible on lower timeframes (1H-4H) • Price Structure: Recently rejected from $3,320-$3,325 resistance zone Forming lower highs and lower lows- suggesting short-term downtrend continuation..
Key points :
Entry point : 3302
1st Target : 3282
2nd Target : 3250
Follow me for more latest updates and signals
XAUUSD – Weak Rebound, Bearish Bias RemainsYesterday was a quiet and choppy day for Gold.
Although price managed to recover a small portion of last week’s 1400 pip drop, the rebound remains anemic — price barely reached the 23% Fibonacci retracement.
To make things worse for the bulls, the recovery from around $3300 is starting to take the shape of a bearish flag, a continuation pattern that typically signals further downside ahead.
📌 Resistance Zones to Watch:
- Initial resistance: $3345–3350
- Stronger resistance: $3370, a level already proven and well-defined
As long as the price is under those levels, I remain firmly bearish.
📈 Trading Plan:
I already have a short position open, and I'm still waiting to add more, preferably on a push into higher resistance, ideally above $3345.
No need to force entries — I’d rather scale in on strength, not weakness.
Once the correction is complete, I’m targeting:
- $3280 as the first support
- $3250 as a realistic downside objective
Conclusion:
The rebound lacks power. The structure favors the bears.
Still watching for better entries to add short, with eyes on 3280 and 3250 as likely targets.
Let’s stay patient and let the setup come to us. 🎯
Disclosure: I am part of TradeNation's Influencer program and receive a monthly fee for using their TradingView charts in my analyses and educational articles.

IM EXPECTING GOLD TO COLLAPSEHere on the post, i shared my SAXO:XAUUSD sell analysis, for further details, see the content of the post. All the best.

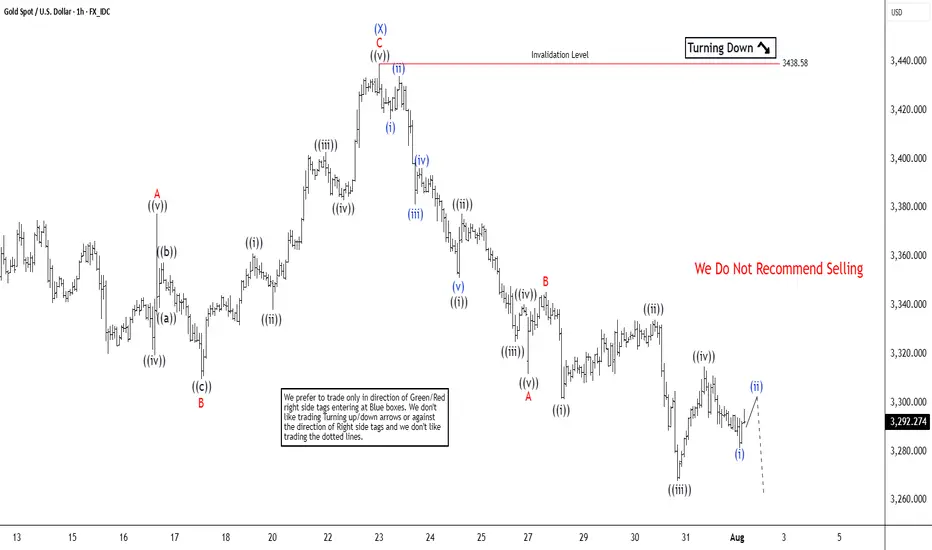
Elliott Wave Analysis Points to Gold (XAUUSD) Support Near 3320Gold (XAUUSD) appears poised for a double correction from its 16 June 2025 high. A double three consists of two corrective patterns, typically zigzags. From the June peak, wave (W) concluded at 3246.55, and wave (X) rallied to 3438.58, as shown on the 1-hour chart. Wave (Y) is now unfolding lower with internal subdivision as a zigzag. From wave (X), wave ((i)) ended at 3351.17, and wave ((ii)) peaked at 3377.45. Wave ((iii)) declined to 3324.80, followed by a wave ((iv)) rally to 3340.34. The final wave ((v)) completed at 3311.62, forming wave A in a higher degree. A corrective wave B rally reached 3345.35 before gold resumed its downward move.
Within wave C, wave ((i)) finished at 3301.47, and wave ((ii)) rallied to 3334.08. Wave ((iii)) dropped to 3267.94, with wave ((iv)) ending at 3314.85. Gold should continue lower in wave ((v)) to complete wave C. The potential target lies within the 100%–161.8% Fibonacci extension from the 16 June high. This projects a support zone between 3104 and 3230, where a three-wave rally is anticipated. Traders should monitor this area for potential reversal signals, as it may offer support for a corrective bounce.
XAUUSD – Bullish Reversal or Just a Deep Correction?Last week was a wild one for Gold.
After a quiet start and some choppy price action, the market dropped hard on Wednesday, breaking not only the 3300 key level but also the 3280 horizontal support — and what followed was anything but calm.
As expected after a strong move, the price pulled back to retest the broken support.
But Friday changed everything.
Instead of continuing down, Gold reversed sharply, fueled by weaker-than-expected NFP data. Price surged 800 pips from low to high, breaking above both the 3310 resistance zone and the weekly high around 3335.
________________________________________
🧭 Key Question:
Are we back in the bullish trend, or is this just a strong correction of the 3440 → 3270 drop?
Since May, Gold has lacked a clear trend — so a step-by-step trading approach is the most advisable to adopt.
________________________________________
🔍 Outlook:
Given the strength of the reversal and the break above two important resistance levels, my bias is bullish.
• 📌 Support: 3335 — a pullback into this zone could offer a buy opportunity in line with the recent momentum.
• 📌 Resistance: 3375 is the next key level to watch.
• ❌ Invalidation: A drop below 3310 would cancel the current bullish scenario.
🧠 Final Thoughts
Gold’s recent move challenges both bulls and bears.
Yes, the bounce was strong. Yes, key resistance levels broke.
But with no clear trend since May, chasing long term direction can be risky.
That’s why a step-by-step approach is the most advisable to adopt — let the market confirm each move before committing to the next.
For now, the breakout above 3310 and 3335 leans the bias to the upside.
However, staying reactive — not being stuck with an idea — is the smartest approach.
Disclosure: I am part of TradeNation's Influencer program and receive a monthly fee for using their TradingView charts in my analyses and educational articles.

THE KOG REPORT THE KOG REPORT:
In last week’s KOG Report we said we would be looking for a price to attempt the higher level red box sitting around the 3370-75 region and if not breached, we felt an opportunity to short would be available from that region. We said if that failed and the move commenced, we would be looking at a complete correction of the move back down into the 3330-35 region, where we would then monitor price again in anticipation of a long from there or the extension level of 3310 which was also a red box short target (move complete). As you can see from the above, not only did we get that higher red box, we rejected, completed the move downside and then our traders managed to get that long trade all the way back up into the Excalibur target, red box targets and the hotspots shared in Camelot.
A decent week again, not only on Gold but also the numerous other pairs we trade, share targets on and analyse.
So, what can we expect in the week ahead?
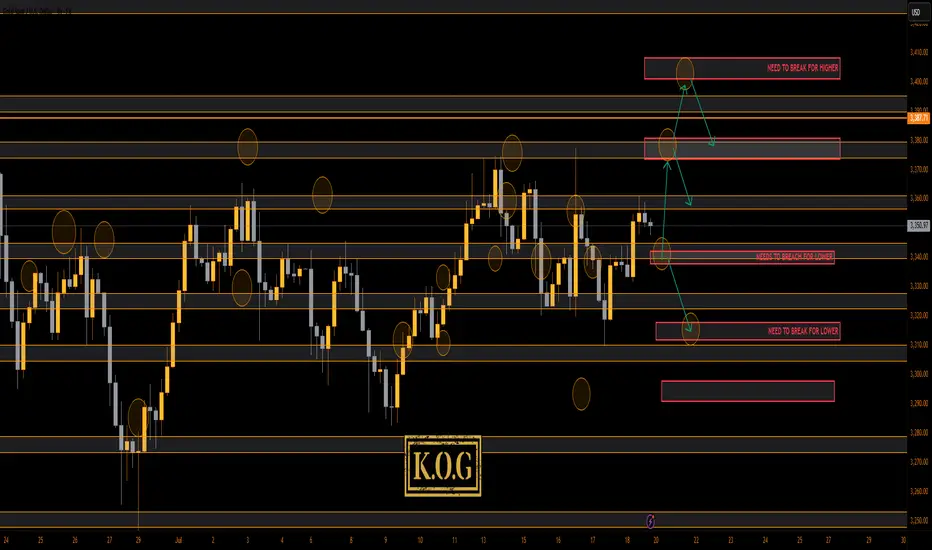
For this week we can expect more ranging price action, but due to the previous range from last week being so tight, it looks like we’ll see a breakout coming in the latter part of the week unless there is news to bring us unexpected volume.
We have the key level below 3335-40 support and above that resistance and a red box sitting at 3375-80. This is the region that needs to watched for the break, and if broken we should hit the range high again at 3400-10. However, if rejected, we could again see this dip to attack that lower order region 3310-6 before attempting to recover.
Last week we wanted to see that curveball and although we did see some aggressive price action, I think we will see something extreme for this week. It’s that lower level 3310-6 that is a key region for bulls, if broken we can see a complete flush in gold taking us down into the 3250’s before we start the summer run. That for us would be the ideal scenario going into the month end, but, we’ll play it how we see and as usual, we go level to level and update any changes as we go along.
KOG’s Bias for the week:
Bullish above 3340 with targets above 3355, 3361, 3368, 3372 and above that 3385
Bearish below 3340 with targets below 3335, 3330, 3322, 3316, 3310 and below that 3304
RED BOX TARGETS:
Break above 3350 for 3355, 3361, 3367, 3375 and 3390 in extension of the move
Break below 3340 for 3335, 3330, 3320, 3310 and 3306 in extension of the move
Please do support us by hitting the like button, leaving a comment, and giving us a follow. We’ve been doing this for a long time now providing traders with in-depth free analysis on Gold, so your likes and comments are very much appreciated.
As always, trade safe.
KOG
The trend is clear, why do I choose to be firmly bullish on goldGold Trend Analysis: Yesterday, the gold market demonstrated strong upward momentum, opening near 3290 before falling slightly to a low of 3281 before fluctuating upward. Boosted by the non-farm payroll data, the gold market surged during the US trading session, reaching a single-day gain of 2.02%, reaching a high of 3363 and closing there. The daily chart formed a long bullish candlestick with a long lower shadow, forming a Morning Star pattern, reinforcing the bullish trend. From the perspective of the cycle structure, the daily level is clearly in the 5-wave upward stage, and the upward trend of the large cycle has not changed. At the indicator level, the daily MACD momentum column (the column below the zero axis) represents the short-selling momentum. Its "gradual shortening" means that the short-selling force is weakening and the downward momentum is gradually fading. It is a potential signal of stopping the decline or rebounding. KDJ is about to form a golden cross between 20-50, which is a signal that short-term bullish power is beginning to increase, and the overall trend is bullish.
The 4-hour level shows typical bullish characteristics: the moving average system is arranged in a bullish pattern, but there is a certain deviation between the short-term price and the moving average. The technical side needs to correct the deviation rate through a callback before continuing to rise. The short-term support below is focused on the line near 3330-3335. This position is both the relay support level in the previous rise and the intersection of the 4-hour moving averages MA10 and MA20, which has strong support strength; the short-term resistance above is focused on the line near 3370-3383. This area is a pressure-intensive area near the previous high point. If it can be effectively broken through, it will further open up upward space. A successful breakout would open up further upside potential. A breakout would further open up the 3400 mark.
For gold trading, the short-term strategy is to buy on dips. If the price pulls back to the 3330-3335 support level, consider entering a long position with a target of 3355-3365. If it reaches 3370-3380, consider a short-term short position with a target of 3350-3340.
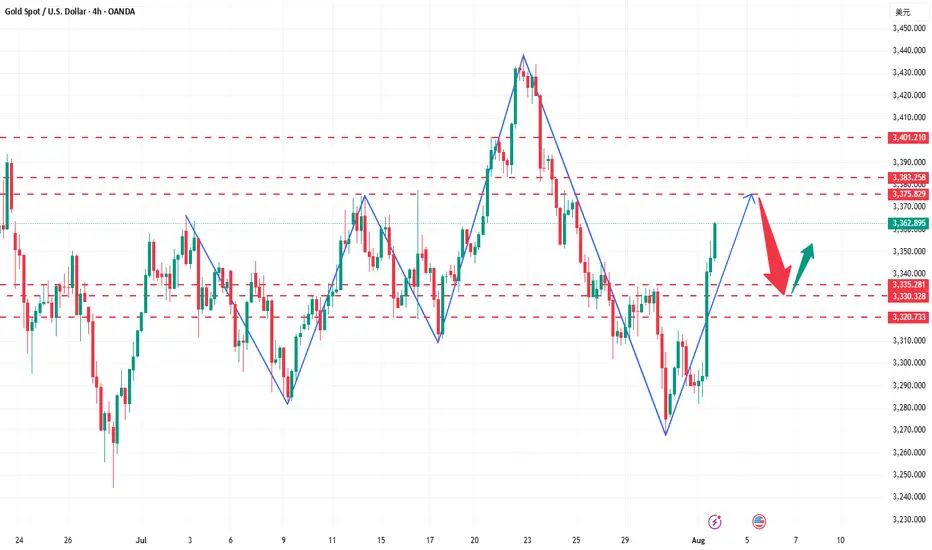
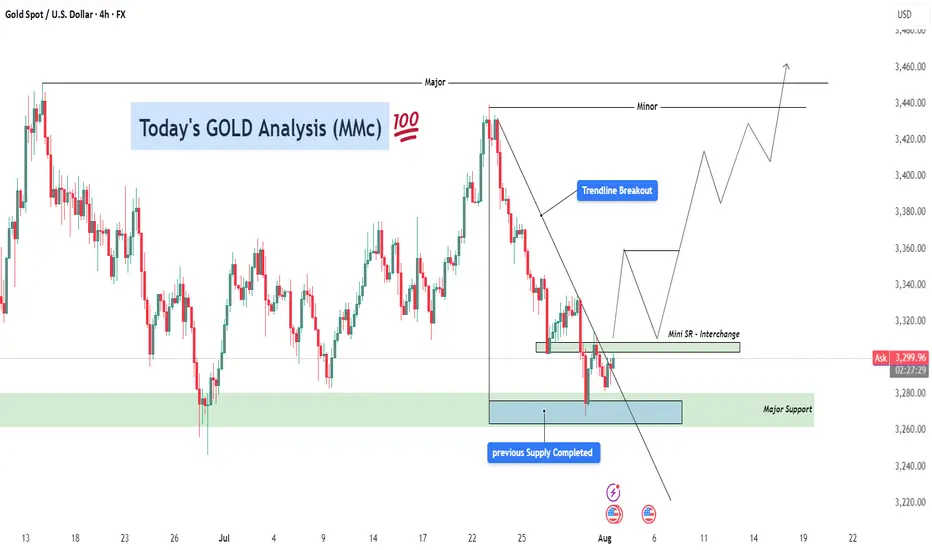
GOLD Analysis – Bullish Recovery Setup After Trendline Breakout ⚙️ Technical Structure Overview
This 4-hour chart of Gold (XAUUSD) illustrates a classic reversal setup developing after a significant correction. Price previously faced strong selling pressure from the 3,470+ zone and declined sharply. However, the recent price action suggests a shift in control from sellers to buyers, signaling a likely medium-term trend reversal or a bullish wave formation.
The key to this setup lies in three confluences:
Completion of a previous supply zone, which no longer holds influence.
Aggressive buyer activity from a major support zone.
A clean break above the descending trendline, which is a common signal that bearish momentum is losing strength.
🔑 Key Levels & Concepts Explained
🟢 1. Major Support Zone (3,260–3,280)
This zone has been tested multiple times and each time, buyers stepped in and prevented further downside. The most recent rejection from this area shows long wicks and bullish engulfing candles, indicating accumulation by institutional players. This is the foundational support that has held the entire corrective structure.
📉 2. Trendline Breakout
The descending trendline connecting swing highs has now been broken to the upside. This is a critical technical signal, especially on the 4H timeframe, as it suggests a potential trend reversal or at least a deep retracement in the opposite direction.
Trendline breakouts typically result in a retest of the trendline or a nearby support-turned-resistance zone (as is the case here with the Mini SR level).
It also implies that supply is weakening, and buyers are ready to push.
🧱 3. Mini Support/Resistance Interchange (~3,300–3,320)
This zone now plays the role of an interchange level—a previous minor resistance that could act as a support after the breakout. This level is crucial for intraday and swing traders because it can offer a low-risk long entry if price retests and confirms it with bullish momentum.
The chart projection suggests a bounce off this mini S/R, followed by successive higher highs and higher lows, forming a new bullish structure.
📈 Forecast Path & Trade Scenario
✅ Bullish Path (Preferred MMC Scenario)
Stage 1: Price retests the 3,300–3,320 zone (Mini S/R).
Stage 2: Buyers step in, leading to a bullish continuation.
Stage 3: Price targets the Minor Resistance (~3,440).
Stage 4: If momentum is sustained, it aims for Major Resistance (~3,470–3,480), completing a clean reversal formation.
This path reflects perfect bullish market structure—a breakout, followed by a retest and rally.
❌ Bearish Invalidation
If the price closes strongly below 3,260, the structure would be invalidated.
This would suggest that the support zone failed, possibly triggering deeper downside toward 3,220–3,200.
🧠 MMC Trader Mindset & Risk Considerations
Don’t Chase: Wait for a confirmed retest of the Mini S/R zone. Let the market come to your entry.
Entry Confirmation: Use candlestick signals like bullish engulfing, pin bars, or inside bars near the Mini S/R.
Volume Consideration: Volume should ideally rise on breakout legs and decline on pullbacks—this confirms healthy bullish structure.
Risk-Reward: With a stop below 3,260 and targets toward 3,470, the RR ratio favors long entries, especially after confirmation.
🔁 Summary Plan for Execution
Entry Zone: 3,300–3,320 (after bullish confirmation)
Stop Loss: Below 3,260 (structure break)
Take Profit 1: 3,440
Take Profit 2: 3,470–3,480
Risk-to-Reward: 1:2+ if planned carefully
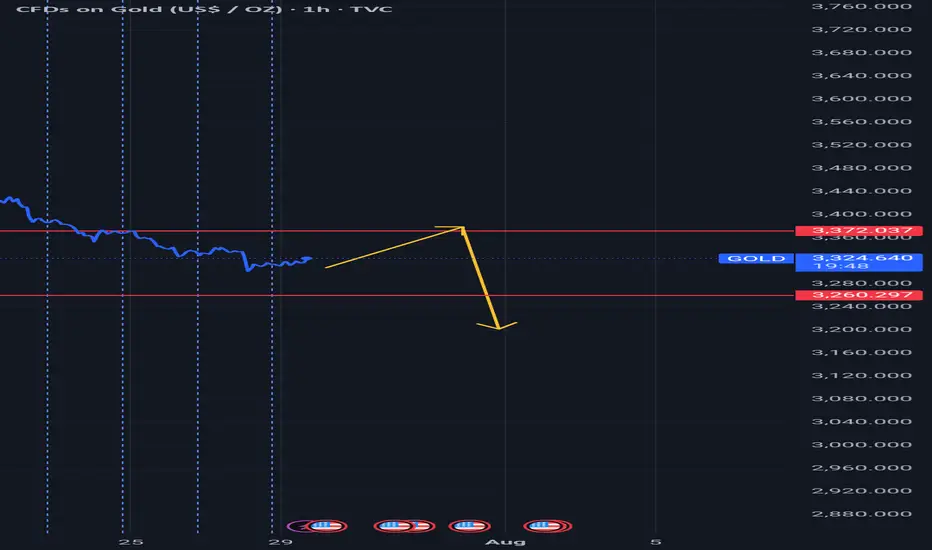
Gold Slipping Lower — 3250 and 3200 in Sight!✅ Gold & DXY Update – Post-FOMC Price Action
Earlier today, before the U.S. interest rate decision, I released my outlook on both the Dollar Index and gold.
In that analysis, I highlighted the DXY’s readiness to move toward the key level of 100 — and as of now, price is actively testing that exact zone, just as expected.
As for gold, I repeatedly emphasized the visible weakness on the buy side. It was clear that there were very few remaining buy orders strong enough to hold price up in this region — and that’s exactly what played out. Price has started pushing lower, in line with our expectations.
Looking ahead, I believe the first target is 3250, followed by a deeper move toward the liquidity zone and the marked box around 3200, which could act as a key target area in the coming days.
🔁 This analysis will be updated whenever necessary.
Disclaimer: This is not financial advice. Just my personal opinion.

Market Analysis: Gold Prices Ease – Market Awaits Fresh CatalystMarket Analysis: Gold Prices Ease – Market Awaits Fresh Catalyst
Gold price started a fresh decline below $3,380.
Important Takeaways for Gold Price Analysis Today
- Gold price climbed higher toward the $3,430 zone before there was a sharp decline against the US Dollar.
- A key bearish trend line is forming with resistance near $3,350 on the hourly chart of gold at FXOpen.
Gold Price Technical Analysis
On the hourly chart of gold at FXOpen, the price climbed above the $3,380 resistance. The price even spiked above $3,400 before the bears appeared.
A high was formed near $3,432 before there was a fresh decline. There was a move below the $3,380 support level. The bears even pushed the price below the $3,350 support and the 50-hour simple moving average.
It tested the $3,325 zone. A low was formed near $3,325 and the price is now showing bearish signs. There was a minor recovery wave towards the 23.6% Fib retracement level of the downward move from the $3,433 swing high to the $3,325 low.
However, the bears are active below $3,342. Immediate resistance is near $3,350. There is also a key bearish trend line forming with resistance near $3,350.
The next major resistance is near the $3,380 zone. It is close to the 50% Fib retracement level of the downward move from the $3,433 swing high to the $3,325 low. The main resistance could be $3,410, above which the price could test $3,432. The next major resistance is $3,450.
An upside break above $3,450 could send the gold price towards $3,465. Any more gains may perhaps set the pace for an increase toward the $3,480 level.
Initial support on the downside is near the $3,325 level. The first major support is near the $3,310 level. If there is a downside break below it, the price might decline further. In the stated case, the price might drop towards the $3,265 support.
This article represents the opinion of the Companies operating under the FXOpen brand only. It is not to be construed as an offer, solicitation, or recommendation with respect to products and services provided by the Companies operating under the FXOpen brand, nor is it to be considered financial advice.

Risk Capacity: The Real Reason Traders Blow Accounts | Ep. 4In this pre-recorded video, I unpack one of the most overlooked reasons why traders blow their accounts over and over again, and it’s not about your system, strategy, or signal.
It’s about risk capacity, the internal threshold your nervous system can handle before fear, greed, or shutdown kicks in.
This is part of my ongoing series on YouTube “Rebuilding the Trader Within”, where I reflect on the emotional and psychological dimensions of trading that no indicator can fix.
If you've ever found yourself repeating the same mistakes, feeling stuck at the same equity level, or losing composure in high-stakes trades... this might be the pattern underneath it all.
I'm still learning too, and I’d love to hear your thoughts. Drop a comment — let’s grow together.
#RiskCapacity #TradingPsychology #TraderMindset #RebuildingTheTraderWithin #ForexMentorship #TraderGrowth #InnerWork #ForexPsychology

GOLD - SHORT TO $2,880 (UPDATE)Gold 'Sell Trade' running 1,130 PIPS in profit to start the week. I hope you are all taking advantage of this free analysis & profiting from Gold's downside. Amazing move to start the new week, with much more downside expected.
Drop me a message @XTBCAP for Account Management & Investment opportunities✅

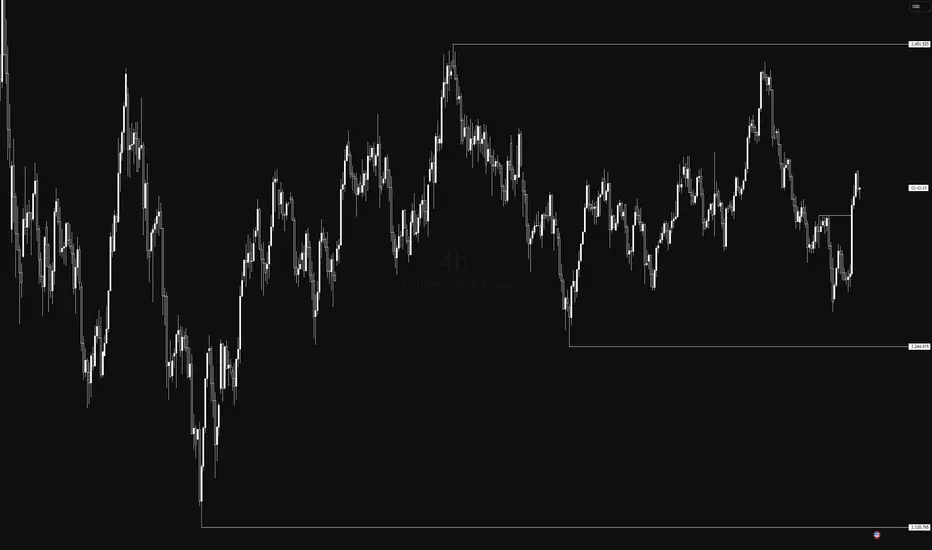
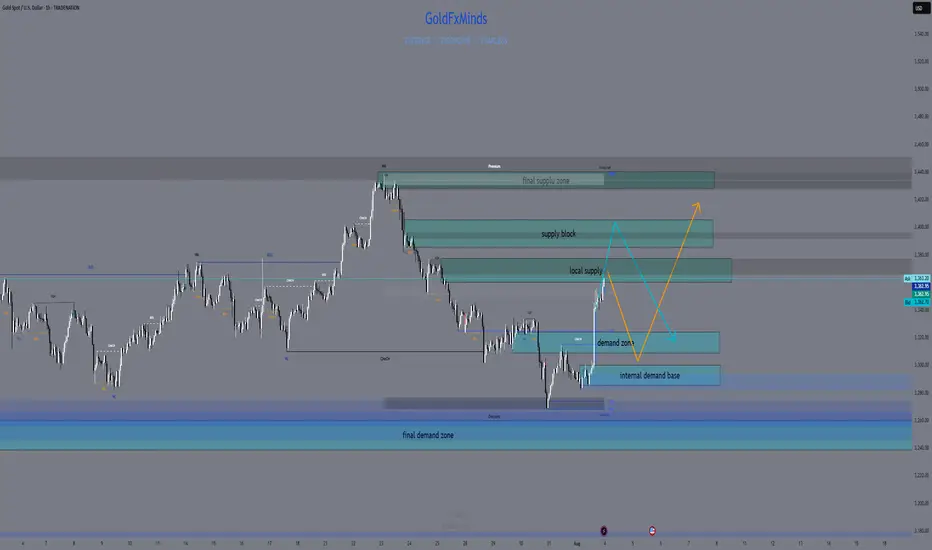
XAUUSD Daily Sniper Plan – August 4, 2025🧠 Macro & Context
Gold is surging back toward premium structure after sweeping 3287. With no major news today, flow is dictated by structure, liquidity, and the residual strength from July’s closing push. Bulls have reclaimed internal control, but are now pressing into major resistance zones. This is the perfect battleground for sniper entries.
🔥 Bias: Bullish short-term, but hitting premium exhaustion
The current candle is testing prior supply and imbalance. Unless we break 3375–3380 cleanly, price remains vulnerable to rejection from premium. Above that, clean air until external zones. Any pullbacks into discount (under 3310) remain buyable — if the structure holds.
🎯 Daily Sniper Zones
🔷 3360–3375 – Decision Supply
📍 Where we are now
This is the current premium pressure zone. Built from a bearish OB + unmitigated imbalance from late July. First contact is live. If price rejects this level, sellers may regain control short-term. But if buyers break and hold above 3375 → bullish expansion is open. This is our Decision Zone.
🔷 3387–3405 – External Supply Block
📍 Premium target for breakout move
Clean HTF OB + imbalance resting above liquidity. If 3375 gives way, this is the next sniper target. Expect strong reaction — either reversal or inducement wick. Ideal for shorts if price shows exhaustion and BOS on LTF.
🔷 3430–3439 – Final Supply Cap (Weekly)
📍 Extreme supply wick
This is the highest defined zone on the Daily/Weekly chart before unknown territory. Full wick zone, untouched since early May. Reactions from here tend to be sharp. A strong rejection could initiate a new sell cycle.
🔷 3310–3325 – Mid-Demand Support
📍 Pullback buy zone
If price rejects 3375 and pulls back, this is the first area to monitor for higher low formation. Built from bullish OB, Fibonacci 50%, and alignment with internal structure. RSI supports buyers here if retested cleanly.
🔷 3285–3300 – Key Reversal Demand
📍 The origin of the current rally
Strong institutional footprint. Last BOS + OB confluence area. Any retest here is valid for sniper buys as long as no bearish HTF shift appears.
🔷 3240–3260 – Final Daily Demand Base
📍 Only valid if structure breaks down
If we lose 3285, this is the last demand zone holding Daily structure. Deep discount + HTF mitigation block. A visit here would require bearish breakdown first.
🧠 Game Plan Summary
⚠️ Right now, we are in a decision zone (3360–3375). Do not rush. Wait for confirmation.
✅ If we break 3375, next bullish target = 3405, then 3439.
🔻 If we reject 3375, watch for controlled retracement into 3325 or 3300 for buys.
⛔️ Do not sell blindly into current price — we are at equilibrium.
💬 If this sniper breakdown sharpened your vision, show some love ❤️
Comment, follow, and hit that like to stay locked in with GoldFxMinds.
More sniper updates dropping 💥
Powered by Trade Nation – for clear structure and no chart noise.
Gold you now totaly buy trend for next 3 to 5 days Gold you now totaly buy trend for next 3 to 5 days
If you want learn more fell free contrect me .

GOLDGOLD needed a reaction from 3360 which is what market gave us, now we need some more upside before any correction.
Disclosure: We are part of Trade Nation's Influencer program and receive a monthly fee for using their TradingView charts in our analysis.
