GOLD ROUTE MAP UPDATEHey Everyone,
Once again our levels deliver the magic!!
Yesterdays update, we stated that we got the move into 3393 just like we analysed for the first level of swing and that we will now look for ema5 to cross and lock 3372 or 3393 to confirm direction.
🔄 Update:
No ema5 lock above 3393 confirmed the rejection into 3372 followed with ema5 cross and lock opening the full swing range test into 3353. We got the test and the perfect bounce back into 3372. A move into 3393 will complete the full swing range.
We will keep the above in mind when taking buys from dips. Our updated levels and weighted levels will allow us to track the movement down and then catch bounces up.
We will continue to buy dips using our support levels, taking 20 to 40 pips. As stated before, each of our level structures gives 20 to 40 pip bounces, which is enough for a nice entry and exit. If you back-test the levels we shared every week for the past 24 months, you can see how effectively they were used to trade with or against short/mid-term swings and trends.
🌀 The swing ranges give bigger bounces than our weighted levels - that's the difference between the two.
BULLISH TARGET
3440 - DONE
EMA5 CROSS AND LOCK ABOVE 3340 WILL OPEN THE FOLLOWING BULLISH TARGETS
3463
EMA5 CROSS AND LOCK ABOVE 3463 WILL OPEN THE FOLLOWING BULLISH TARGET
3483
EMA5 CROSS AND LOCK ABOVE 3483 WILL OPEN THE FOLLOWING BULLISH TARGET
3508
BEARISH TARGETS
3418 -DONE
EMA5 CROSS AND LOCK BELOW 3418 WILL OPEN THE FOLLOWING BEARISH TARGET
3393 - DONE
EMA5 CROSS AND LOCK BELOW 3393 WILL OPEN THE SWING RANGE
3372 - DONE
3353 - DONE
EMA5 CROSS AND LOCK BELOW 3353 WILL OPEN THE SECONDARY SWING RANGE
3330
3306
As always, we will keep you all updated with regular updates throughout the week and how we manage the active ideas and setups. Thank you all for your likes, comments and follows, we really appreciate it!
Mr Gold
GoldViewFX
GOLDMINICFD trade ideas

XAUUSD Beginning of a Trend Reversal? Bearish Move IncomingGold is showing signs of potential downside pressure on the 4-hour chart. After a rejection from the upper volatility band and a failure to sustain bullish momentum above the dynamic EMA cloud, price has rolled over and is now trading below the midline support area.
🔻 Bearish Structure Developing:
Price rejected strongly from the upper gray zone (Resistance band).
A new lower high has formed, aligning with bearish market structure.
Candles are trading under the red-to-blue transition EMA ribbon, indicating increasing bearish sentiment.
🎯 Trade Setup:
Entry: Near 3,365
SL: Above the recent high near 3,406
TP: Targeting the lower band support around 3,300 – 3,323

Middle East War - Gold Price Increases✍️ NOVA hello everyone, Let's comment on gold price next week from 06/23/2025 - 06/27/2025
⭐️GOLDEN INFORMATION:
Gold prices held steady on Friday, hovering near $3,369 and on track to post a weekly loss of nearly 1.90%, as markets digested US President Donald Trump’s decision to forgo immediate military action against Iran in favor of a diplomatic approach. At the time of writing, XAU/USD is down 0.11%.
While easing geopolitical tensions helped lift risk sentiment, additional pressure on gold emerged from concerns over potential US restrictions on allies operating semiconductor plants in China, as reported by Bloomberg. Trump's restraint on Iran encouraged a risk-on tone, weighing on the appeal of the safe-haven metal.
⭐️Personal comments NOVA:
Middle East tensions escalate, gold prices continue to recover above 3400, early next week
🔥 Technically:
Based on the resistance and support areas of the gold price according to the H4 frame, NOVA identifies the important key areas as follows:
Resistance: $3395, $3448
Support: $3302, $3256
🔥 NOTE:
Note: Nova wishes traders to manage their capital well
- take the number of lots that match your capital
- Takeprofit equal to 4-6% of capital account
- Stoplose equal to 2-3% of capital account
- The winner is the one who sticks with the market the longest

XAUUSD: Is Bullish Trend Ended? Or It is just beginning big moveAs we previously stated that price can reverse between 3340 to 3350 region, which was a pivotal point for bulls. Price smoothly moved currently trading at 3376 and possibly bullish move continuing towards 3400,3450 and ultimately reaching 3600.
Following the price’s all-time high at $3500, it experienced a sharp decline and failed to maintain that level. A substantial 2400 pips would have resulted in significant losses for many accounts. Initially, it was perceived as a minor correction, with the expectation of further price appreciation. However, this assumption proved incorrect. After reaching an even higher peak, the price invariably undergoes a more substantial correction.
At 3260, substantial bullish volume surged into the market, necessitated by the presence of a fair value gap. Subsequently, the price experienced a decline, reflecting the prevailing bearish trend, which favoured the bears. However, at 3200, a pivotal level representing a discounted price point, bull volume surged. This powerful bullish impulse propelled the price to 3432, ultimately confirming the bullish trend. AB=CD there recurring pattern emerged weekly. When the price reached the 3432 level as a fair value gap, the CD pattern commenced.
AB=CD we have identified a recurring pattern. It appears to be an equal move in any direction, and it has manifested precisely as anticipated. We were aware that the price would reject at 3120, and it did so accordingly. Currently, the market is in our favour. Upon market opening, it exhibited a positive gap, propelling the price to 3450. However, it subsequently declined, reaching 3384.
Presently, we find ourselves in the accumulation phase, poised for distribution. This distribution is anticipated to be substantial, potentially leading to another record high, potentially reaching 3650.
Moving forward, the price could continue towards our target from its current position. Alternatively, there exists a possibility that it may drain the sell-side liquidity and reverse from 3360-3370.
Our take-profit levels are set at 3450, 3490, 3520, and finally, 3600. When entering the market, it is advisable to employ a short time frame. It is important to note that this analysis is merely our opinion, and market conditions may deviate from expectations.
We extend our best wishes for success and safe trading. If you wish to demonstrate your support, you may consider liking, commenting, or sharing this analysis with others.
Sincerely,
Team Setupsfx_

Gold Trading Analysis and Strategies for Sideways Decline MarketAfter Trump announced a comprehensive ceasefire agreement between Israel and Iran, market risk aversion significantly cooled, and gold prices plunged by more than $30 in early trading. Although the stability of the ceasefire agreement remains doubtful, the rebound in risk appetite has dominated market trends, with stock markets rebounding, oil prices falling, and demand for safe-haven assets declining.
From a technical perspective, the moving average system on the daily chart of gold shows an intertwined state, indicating a relative balance between bulls and bears. The current key resistance above is near 3350, which is an important psychological threshold. If effectively broken, it may open up upward space; the lower support is focused on the 3285-3290 range, which is the lower edge of the May consolidation platform. A break below this level may intensify correction pressure. The loss of the midline in the 4-hour chart further confirms the short-term weak structure, providing technical support for the downward trend.
XAUUSD
sell@3330-3340
tp:3320-3310
buy@3285-3290
tp:3310-3320
Investment itself is not the source of risk; it is only when investment behavior escapes rational control that risks lie in wait. In the trading process, always bear in mind that restraining impulsiveness is the primary criterion for success. I share trading signals daily, and all signals have been accurate without error for a full month. Regardless of your past profits or losses, with my assistance, you have the hope to achieve a breakthrough in your investment.

[XAUUSD] GOLD – Bullish Setup in Play🟡 *Key Context*
- Geopolitical calm (Trump ceasefire remarks) lowered risk aversion, pushing Gold down — but key support is holding.
- Fed uncertainty continues, yet technicals point to a possible reversal.
📉 *Price Structure*
- Price dropped into a falling wedge, testing 3285–3295 (H4 demand zone).
- RSI bullish divergence + harmonic ABCD pattern seen on 30m.
📌 *Trade Setup – Long Bias*
🔹Entry: 3285–3295 zone (watch for bullish candle confirmation)
🔹Stop Loss: Below 3280 (structure invalidation)
🔹Target 1: 3320–3330
🔹Target 2: 3390 (longer-term move)
⚠️ Volume confirmation is key — wait for breakout strength. Avoid entries during news events. Risk must be managed tightly.
#XAUUSD #Gold #TradingSignal #TeconLab #BuyTheDip

Hanzo Drex | 15-Min Bullish Reversal Setup – 300 Pips in Sight🔥 Gold – 15 Min Scalping Analysis
⚡️ Objective: Precision Reversal Execution
Time Frame: 15 -Minute Warfare
Entry Mode: Only after verified Reversals
👌Bullish Reversal : 3397
Price must break liquidity with high volume to confirm the move.
☄️ Hanzo Protocol: Dual-Direction Entry Intel
➕ Zone Activated: Strategic liquidity layer detected — mapped through refined supply/demand mechanics. Volatility now rising. This isn’t noise — this is bait for the untrained. We're not them.
🦸♂️ Tactical Note:
The kill shot only comes after the trap is exposed and volume betrays their position.

Gold Take All Stop losses,Are You Ready To Sell ?Here is my 1H Gold Chart and this is my opinion , the price opened this week with massive wick to upside to take all stop losses and then moved to downside very hard and aggressive , we have a very good Res that we sell from it last week 3377.00 , it`s still strong and forced the price many times to respect it so it still my fav level to sell it again today if the price touch it and give me a good bearish price action to confirm the entry and we can targeting 300 pips at least . if we have a daily closure above my res then we will think about buying instead of selling , but until now i`m looking to sell it from the level i mentioned .

XAUUSD – Sniper Entry Plan June 26, 2025👋 Hello traders,
Gold is currently consolidating after recent downside liquidity sweeps, and Thursday brings high-impact USD catalysts. Let’s break it down and build a precise plan for sniper entries around these volatile zones. We’re trading structure, not noise — eyes on the prize. 🎯
🔸 HTF Outlook (D1 → H4 → H1)
🌐 Macro & Geopolitical Context
Markets are bracing for:
USD Unemployment Claims (Forecast: 244K, previous: 245K)
Final GDP q/q and Durable Goods Orders
Fed speakers (Barkin, Barr, Harker)
Stronger-than-expected data could reinforce USD bullish sentiment, sending gold down. Weaker reports + dovish Fed = bullish pressure on gold.
🗺️ Daily Bias: Neutral to Bullish
Price is ranging above a key CHoCH low + Daily OB (3272–3288)
Strong bullish continuation only confirmed with a break above 3370–3384
FIBO: 50% retracement of the last swing is near 3310, giving structure to Buy Zone 1
Bias: Bullish as long as 3272 holds — PA supports HL structure above imbalance
🕓 H4 Bias: Bearish Pullback
CHoCH at 3384 → clean Lower High + price failed to close above premium FVG
Pullback testing EMA 50/100 + FVG at 3345
FIBO extension zone at 161.8% aligns near 3288 = reactive downside target
Bias: Reactive bearish under 3352. If 3370 breaks cleanly → short invalid.
🕐 H1 Bias: Bullish Short-Term
CHoCH → HL printed at 3310 → higher lows forming toward supply
EMA 21/50 crossed to the upside, RSI mid-range (50–60)
PA structure showing ascending triangle under resistance
Bias: Bullish continuation valid toward 3352–3370, unless breakdown under 3308
🔸 LTF Precision (M30 → M15)
🔹 Sell Zone 1 – 3352–3345
H1 OB + M15 FVG + upper range sweep
RSI expected to peak near 70 → potential divergence
FIBO: 78.6% retracement of previous bearish leg
PA: Watch for M15 liquidity sweep + bearish engulfing
🔸 Entry: Wait for break/retest → confirmation on M5–M15 BOS
🔹 Sell Zone 2 – 3370–3384
HTF premium imbalance zone + weak high above
RSI likely in exhaustion zone
FIBO extension 1.272–1.618 completes inside this supply
PA: Only enter after stop hunt wick + clear CHoCH (M5)
🔸 Entry: Reactive fade after liquidity trap
🔸 Buy Zone 1 – 3308–3313
H1 CHoCH + OB + EQ zone
RSI bounce zone (30–40)
FIBO 50–61.8% retracement of bullish swing
PA: Watch for M15 bullish engulfing or double bottom formation
🔸 Entry: Only on structure break + retest confirmation
🔸 Buy Zone 2 – 3288–3272
Daily OB + HTF FVG + massive imbalance
RSI expected to overshoot under 30
FIBO: 1.618 extension from previous M15 bullish leg
PA: High-RR reversal zone if flushed by NY open
🔸 Entry: Enter only after M5 CHoCH or strong engulfing near the OB
⚖️ Decision Zone – 3333–3336
Previous supply turned EQ zone
PA shows indecision — do not enter here
Useful for monitoring if price holds support or rejects
🔸 Trade Scenarios
🟢 Bullish Scenario
If USD data is weak:
Flush to 3308 or 3288
Confirm HL formation → sniper buy from OB → aim 3345+, possibly 3370 sweep
🔴 Bearish Scenario
If USD prints strong:
Price spikes into 3352 or 3370 zones → rejection + BOS
Sniper short entry → targets 3310 → 3288
🔸 Final Plan & Action Points
✅ Patience is key during news. Let structure confirm.
✅ Track price behavior near 14:30 CEST, avoid instant spikes.
✅ Best sniper RR zones:
🔹 Sell from 3352 or 3370
🔸 Buy from 3308 or 3288
📊 Precision matters. Structure wins.
👍 Like this if it helped you map the move, and 🔔 follow for tomorrow’s sniper entry.
— GoldFxMinds
Disclosure: I am part of TradeNation's Influencer program and receive a monthly fee for using their TradingView charts in my analyses and educational articles.

Gold Short: Wave 5 of C In this video, I explained my change in the Gold Elliott Wave counts on the cycle level (red font numbering) and how I think the Gold price movement will go down in a double combination (because the previous 2 waves are double combinations).
I also go through how I set the short target using Fibonacci extensions.

GOLD - SHORT TO $2,800 (UPDATE)Our original sell bias from $3,347 which I posted live for you all, is now running in deep profits! Market is now down & running 810 PIPS in profit in just 2 days.
We have broken structure to the downside, crossing below our previous 'Wave E' low, indicating & acting as stronger confluence that Gold will carry on down towards our $2,800 target. Huge profits en-route for us all in this free channel.

Gold trade plan 25/06/2025Dear Trader,
Gold is fluctuating in the range between 3300 and 3370. I expect that after some correction, the price will reach the strong upward zone around 3365–3370. From there, we will review the chart again. If the strong 3390 zone is broken, a move will follow.
if you enjoyed this forecast, please show your support with a like and comment. Your feedback is what drives me to keep creating valuable content."
Regards,
Alireza!

GOLD (XAUUSD): Technical Analysis & Important Pattern to Watch
For some known reason, Gold remains bearish this entire week.
The market is currently correcting within a falling channel - a bullish flag on a 4H time frame.
Ahead, I see a bunch of strong intraday supports.
From one of these structures, a bullish rally may resume.
A trigger that you should look for is a bullish breakout of
a resistance line of the flag and a 4H candle close above that.
A bullish continuation will be expected then.
❤️Please, support my work with like, thank you!❤️
I am part of Trade Nation's Influencer program and receive a monthly fee for using their TradingView charts in my analysis.

Strong weekend selling pressure, below 3300⭐️GOLDEN INFORMATION:
Gold prices (XAU/USD) came under renewed selling pressure during the Asian session on Friday, retreating below the $3,300 level after a lackluster performance the previous day. The precious metal is edging closer to the two-week low seen on Tuesday, as investors await the release of the US Personal Consumption Expenditures (PCE) Price Index. This key inflation gauge is expected to offer fresh insight into the Federal Reserve’s policy outlook and could significantly influence US Dollar (USD) movements—ultimately shaping the near-term trajectory of the non-yielding yellow metal.
⭐️Personal comments NOVA:
Selling pressure at the end of the week caused gold prices to fall below 3300, maintaining selling pressure and falling today
⭐️SET UP GOLD PRICE:
🔥SELL GOLD zone: 3326- 3328 SL 3333
TP1: $3315
TP2: $3302
TP3: $3290
🔥BUY GOLD zone: $3248-$3250 SL $3243
TP1: $3260
TP2: $3270
TP3: $3280
⭐️Technical analysis:
Based on technical indicators EMA 34, EMA89 and support resistance areas to set up a reasonable SELL order.
⭐️NOTE:
Note: Nova wishes traders to manage their capital well
- take the number of lots that match your capital
- Takeprofit equal to 4-6% of capital account
- Stoplose equal to 2-3% of capital account

GOLD Gold’s retreat is directly linked to the Israel-Iran ceasefire, which has eased geopolitical tensions and prompted a shift in investor risk appetite away from gold and into equities and other risk-on assets...watch 3243-3224 zone #gold #shavyfxhub

GOLD (XAUUSD): Bullish Move After Opening?!
I think that there is a high chance that Gold will have a bullish opening.
The market closed, breaking a resistance line of a bullish flag pattern
on an hourly time frame.
Fundamentals strongly support this bullish outlook.
Resistance 1: 3392
Resistance 2: 3420
❤️Please, support my work with like, thank you!❤️
I am part of Trade Nation's Influencer program and receive a monthly fee for using their TradingView charts in my analysis.

#XAUUSD #GOLD 30Min 📉📈 #XAUUSD 30m Analysis – Dual Setup Scenario
We’re monitoring two potential trade setups depending on how price reacts at key levels:
🔴 Sell Setup:
Price is entering a Sell-Side Order Block Zone between 3350–3360, aligned with a Fair Value Gap (FVG). This premium zone is likely to act as strong resistance, with potential rejection targeting downside liquidity near 3310 — an ideal area for short positions.
🟢 Buy Setup:
If price sweeps below and taps into the Liquidity Zone / Demand Area around 3305–3311, we’ll watch for a bullish reversal from this discount zone. This area offers a favorable setup for long entries, aligning with institutional buying levels.
📌 Be sure to mark these key zones on your chart for enhanced clarity and execution.
💬 What’s your outlook on Gold? Share your thoughts below 👇

Bulls and bears are anxious? Rebound continues to empty📰 Impact of news:
1. Initial unemployment claims data
📈 Market analysis:
Gold is in a sideways consolidation near 3320 in the short term. The market has no clear direction for the time being, and the long and short positions are in a tug-of-war. The hourly line rebounded to 3328 and then fell back again, suggesting that there is still room for short-term retracement. The current operation needs to focus on key points: if it rebounds to the 3320-3330 resistance area, you can consider entering short positions again. If the market continues to decline, focus on the 3300-3290 support range. If it stabilizes, long orders can be arranged. The overall idea is to maintain a volatile market. Before effectively breaking through 3350 or falling below 3290, high-altitude and low-multiple is still the main strategy.
🏅 Trading strategies:
SELL 3320-3330
TP 3310-3300-3290
BUY 3310-3300
TP 3320-3330-3340
If you agree with this view, or have a better idea, please leave a message in the comment area. I look forward to hearing different voices.
OANDA:XAUUSD FX:XAUUSD FOREXCOM:XAUUSD FXOPEN:XAUUSD TVC:GOLD

XAU/USD Bearish Bomb Ready to Explode? (Entry Levels Inside)🏦💰 GOLD HEIST ALERT: XAU/USD Bearish Raid in Progress! (Short Setup Inside) 💰🏦
🚨 Cops Waiting at Resistance? Here's How to Steal Pips & Escape Safely! 🚨
🦹♂️ ATTENTION ALL MARKET BANDITS!
To the Profit Pirates & Risk-Takers! 🌍💣
Using our 🔥Thief Trading Tactics🔥 (a lethal mix of liquidity grabs + institutional order flow + macro traps), we're executing a bearish gold heist on XAU/USD—this is not advice, just a strategic robbery plan for traders who play by their own rules.
📉 THE GOLD VAULT RAID (SHORT ENTRY PLAN)
🎯 Loot Zone: 3280.00 (or escape earlier if bulls fight back)
💣 High-Stakes Play: Neutral trend turning bearish - trap for late buyers
👮♂️ Cop Trap: Where bullish traders get arrested by resistance
🔪 ENTRY RULES:
"Heist Activated!" – Strike when price breaks 3340.00
Sell Stop Orders above MA OR Sell Limit on pullbacks (15-30min TF)
Aggressive? Enter at market but use tighter stops
📌 SET ALERTS! Don't miss the breakdown
🚨 STOP LOSS (Escape Plan):
Thief SL at 3390.00 (4H swing high)
⚠️ Warning: "Ignore this SL? Enjoy your margin call."
🎯 TARGETS:
Main Take-Profit: 3280.00
Scalpers: Ride the bear waves only
🔍 FUNDAMENTAL BACKUP (Why This Heist Works)
Before raiding, check:
✅ COT Data (Are big players dumping gold?)
✅ Real Yields (TIPS vs Gold correlation)
✅ Geopolitical Heat (Safe-haven flows drying up?)
✅ DXY Strength (Dollar crushing commodities?)
🚨 NEWS RISK WARNING
Avoid NFP/CPI/FOMC periods (unless you like volatility torture)
Trailing stops = your get-out-of-jail-free card
💎 BOOST THIS HEIST!
👍 Smash Like to fund our next raid!
🔁 Share to recruit more trading outlaws!
🤑 See you at the target, rebels!
⚖️ DISCLAIMER: For entertainment only. Trade at your own peril.
#XAUUSD #GoldTrading #TradingView #LiquidityGrab #ThiefTrading
💬 COMMENT: "Short already—or waiting for confirmation?" 👇🔥

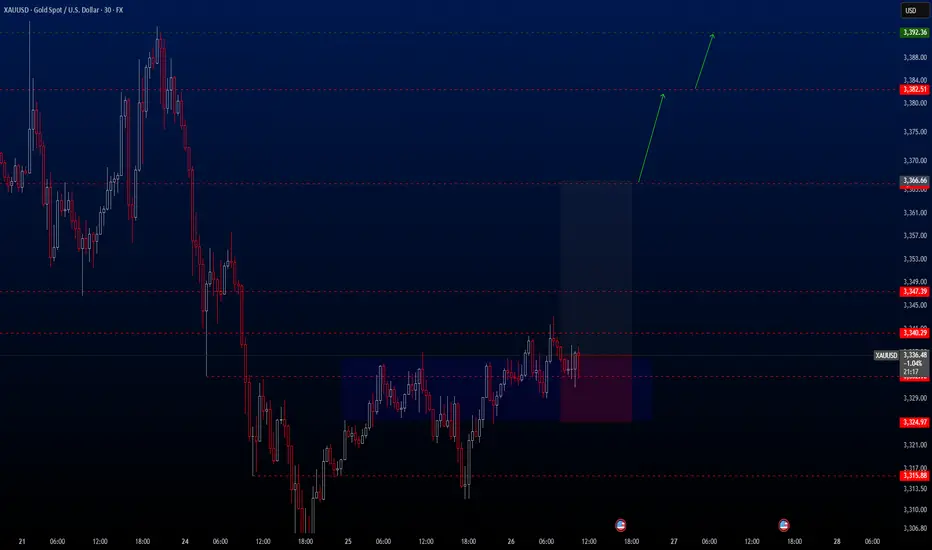
XAUUSD Hello traders.
Today’s first trade setup comes from the XAUUSD pair. The pair is currently positioned in an ideal buy zone, and I’ve spotted a potential long opportunity. There are three different take profit levels, all of which are listed below. Personally, I’ll be closing my position at the first TP level: 3366.66.
However, keep in mind that two major economic events will be released today:
📌 Gross Domestic Product (GDP) (QoQ) – Q1
📌 Initial Jobless Claims
These are highly impactful events, so please manage your risk accordingly.
🔍 Trade Details
✔️ Timeframe: 30-Minute
✔️ Risk-to-Reward Ratio: 1:2.5
✔️ Trade Direction: Buy
✔️ Entry Price: 3336.62
✔️ Take Profit: 3366.67 / 3382.51 / 3392.36
✔️ Stop Loss: 3324.97
🕒 If momentum fades or the price consolidates within a tight range, I’ll keep this trade open only until 23:00 (UTC+4). After that, I’ll close it manually—whether in profit or loss—depending on how the price action evolves.
🔔 Disclaimer: This is not financial advice. I’m simply sharing a trade I’ve taken based on my personal trading system, strictly for educational and illustrative purposes.
📌 Interested in a systematic, data-driven trading approach?
💡 Follow the page and turn on notifications to stay updated on future trade setups and advanced market insights.
Gold XAUUSD Analysis 25.06.2025The Gold shows with a recent upward trend following a period of consolidation and a dip. Key observations:
The price previously fluctuated between a support level around 3,310-3,319 and a resistance near 3,354.
The current price is consolidating near the recent high, suggesting potential for further upward movement or a pullback.
Signal:
Buy signal is present in the range of 3,316-3,319, aligning with the support level, offering a good entry point for a potential upward move.
GOLD The US 10-year Treasury yield is approximately 4.29%-4.37%
The US Dollar Index (DXY) is trading near 97.877, showing relative stability with minor fluctuations
Impact on Markets Today
The slight decline in the 10-year yield suggests modest easing of bond market pressure, possibly reflecting cautious investor sentiment amid ongoing fiscal concerns and expectations of Fed rate cuts later this year.
The DXY near 97.9 indicates a moderately strong dollar, though recent trends show some weakening due to fiscal worries and softer economic data.
Together, a stable-to-slightly weaker dollar and a modestly lower 10-year yield can support safe-haven assets like gold, though elevated yields still pose a headwind. But despite the dips of both the 10 year us government bond yield and the dollar index ,GOLD lost over 500pips from Asian session to Newyork session trading on cease fire deal between Israel and Iran by united states of America.
In brief: The US 10-year yield’s slight dip combined with a steady DXY reflects a market balancing inflation, fiscal concerns, and Fed policy outlook. This environment supports cautious risk-taking with safe-haven demand still relevant.
follow zone of buy and sell for educational purpose only.
#gold #dollar

Is Gold Setting a Trap for Traders?Gold is currently retesting the FVG zone around 3,392 after breaking below a key trendline — a classic sell-trigger area if price gets rejected.
Bearish momentum is supported by:
U.S. jobless claims: 244K < 245K forecast → Stronger USD
Iran–Israel ceasefire → Reduced demand for safe-haven assets
If price fails to break above 3,392, the next downside target is the 3,299 support zone.
Trade idea: Watch for a rejection around 3,390–3,392 to consider short positions.
Bearish bias remains valid as long as price stays below 3,392.
