XAU/USD Bearish Bomb Ready to Explode? (Entry Levels Inside)🏦💰 GOLD HEIST ALERT: XAU/USD Bearish Raid in Progress! (Short Setup Inside) 💰🏦
🚨 Cops Waiting at Resistance? Here's How to Steal Pips & Escape Safely! 🚨
🦹♂️ ATTENTION ALL MARKET BANDITS!
To the Profit Pirates & Risk-Takers! 🌍💣
Using our 🔥Thief Trading Tactics🔥 (a lethal mix of liquidity grabs + institutional order flow + macro traps), we're executing a bearish gold heist on XAU/USD—this is not advice, just a strategic robbery plan for traders who play by their own rules.
📉 THE GOLD VAULT RAID (SHORT ENTRY PLAN)
🎯 Loot Zone: 3280.00 (or escape earlier if bulls fight back)
💣 High-Stakes Play: Neutral trend turning bearish - trap for late buyers
👮♂️ Cop Trap: Where bullish traders get arrested by resistance
🔪 ENTRY RULES:
"Heist Activated!" – Strike when price breaks 3340.00
Sell Stop Orders above MA OR Sell Limit on pullbacks (15-30min TF)
Aggressive? Enter at market but use tighter stops
📌 SET ALERTS! Don't miss the breakdown
🚨 STOP LOSS (Escape Plan):
Thief SL at 3390.00 (4H swing high)
⚠️ Warning: "Ignore this SL? Enjoy your margin call."
🎯 TARGETS:
Main Take-Profit: 3280.00
Scalpers: Ride the bear waves only
🔍 FUNDAMENTAL BACKUP (Why This Heist Works)
Before raiding, check:
✅ COT Data (Are big players dumping gold?)
✅ Real Yields (TIPS vs Gold correlation)
✅ Geopolitical Heat (Safe-haven flows drying up?)
✅ DXY Strength (Dollar crushing commodities?)
🚨 NEWS RISK WARNING
Avoid NFP/CPI/FOMC periods (unless you like volatility torture)
Trailing stops = your get-out-of-jail-free card
💎 BOOST THIS HEIST!
👍 Smash Like to fund our next raid!
🔁 Share to recruit more trading outlaws!
🤑 See you at the target, rebels!
⚖️ DISCLAIMER: For entertainment only. Trade at your own peril.
#XAUUSD #GoldTrading #TradingView #LiquidityGrab #ThiefTrading
💬 COMMENT: "Short already—or waiting for confirmation?" 👇🔥
GOLDMINICFD trade ideas

XAUUSD Hello traders.
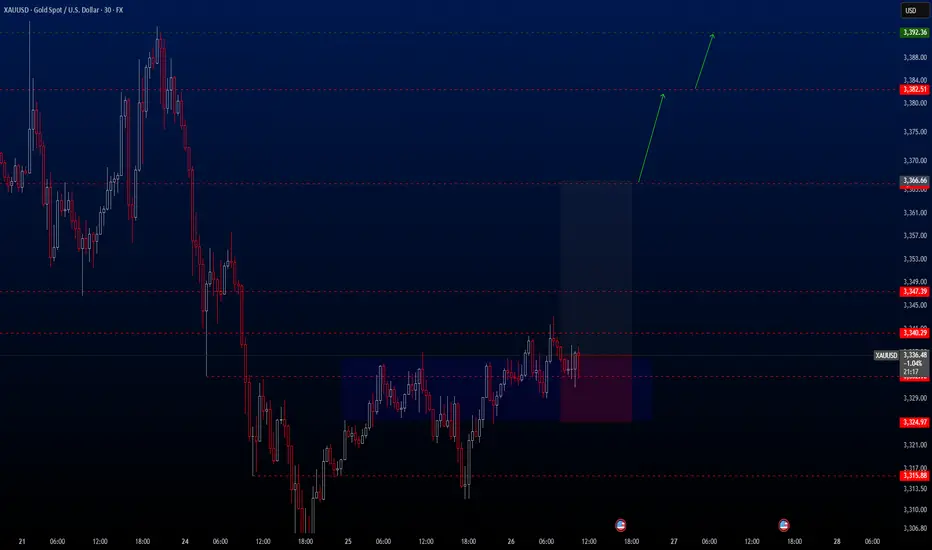
Today’s first trade setup comes from the XAUUSD pair. The pair is currently positioned in an ideal buy zone, and I’ve spotted a potential long opportunity. There are three different take profit levels, all of which are listed below. Personally, I’ll be closing my position at the first TP level: 3366.66.
However, keep in mind that two major economic events will be released today:
📌 Gross Domestic Product (GDP) (QoQ) – Q1
📌 Initial Jobless Claims
These are highly impactful events, so please manage your risk accordingly.
🔍 Trade Details
✔️ Timeframe: 30-Minute
✔️ Risk-to-Reward Ratio: 1:2.5
✔️ Trade Direction: Buy
✔️ Entry Price: 3336.62
✔️ Take Profit: 3366.67 / 3382.51 / 3392.36
✔️ Stop Loss: 3324.97
🕒 If momentum fades or the price consolidates within a tight range, I’ll keep this trade open only until 23:00 (UTC+4). After that, I’ll close it manually—whether in profit or loss—depending on how the price action evolves.
🔔 Disclaimer: This is not financial advice. I’m simply sharing a trade I’ve taken based on my personal trading system, strictly for educational and illustrative purposes.
📌 Interested in a systematic, data-driven trading approach?
💡 Follow the page and turn on notifications to stay updated on future trade setups and advanced market insights.
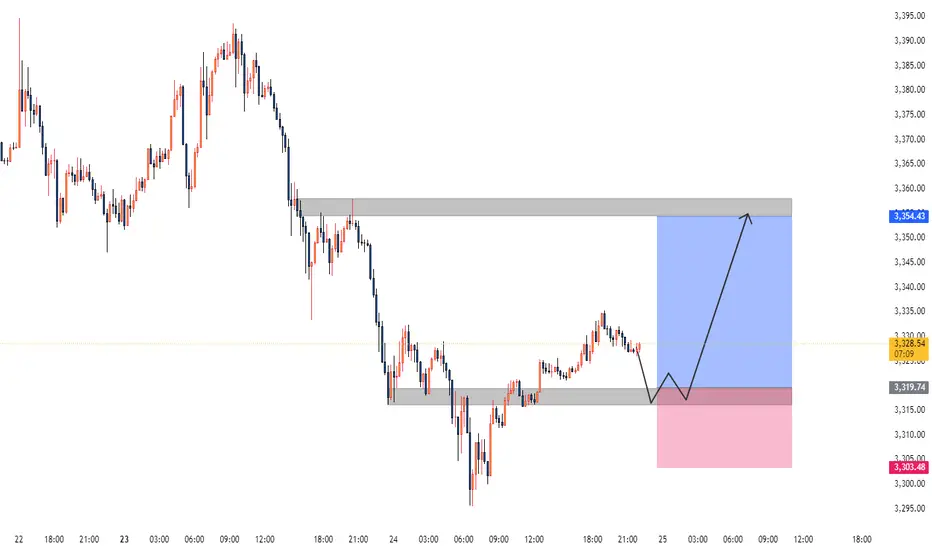
Gold XAUUSD Analysis 25.06.2025The Gold shows with a recent upward trend following a period of consolidation and a dip. Key observations:
The price previously fluctuated between a support level around 3,310-3,319 and a resistance near 3,354.
The current price is consolidating near the recent high, suggesting potential for further upward movement or a pullback.
Signal:
Buy signal is present in the range of 3,316-3,319, aligning with the support level, offering a good entry point for a potential upward move.
Hanzo Drex | 15-Min Break Out Setup – 200 Pips in Sight🔥 Gold – 15 Min Scalping Analysis
⚡️ Objective: Precision Reversal Execution
Time Frame: 15 -Minute Warfare
Entry Mode: Only after verified Reversals
👌Bullish Break : 3333.5
Price must break liquidity with high volume to confirm the move.
👌Bearish Break : 3324
Price must break liquidity with high volume to confirm the move.
☄️ Hanzo Protocol: Dual-Direction Entry Intel
➕ Zone Activated: Strategic liquidity layer detected — mapped through refined supply/demand mechanics. Volatility now rising. This isn’t noise — this is bait for the untrained. We're not them.
🦸♂️ Tactical Note:
The kill shot only comes after the trap is exposed and volume betrays their position.

GOLD The US 10-year Treasury yield is approximately 4.29%-4.37%
The US Dollar Index (DXY) is trading near 97.877, showing relative stability with minor fluctuations
Impact on Markets Today
The slight decline in the 10-year yield suggests modest easing of bond market pressure, possibly reflecting cautious investor sentiment amid ongoing fiscal concerns and expectations of Fed rate cuts later this year.
The DXY near 97.9 indicates a moderately strong dollar, though recent trends show some weakening due to fiscal worries and softer economic data.
Together, a stable-to-slightly weaker dollar and a modestly lower 10-year yield can support safe-haven assets like gold, though elevated yields still pose a headwind. But despite the dips of both the 10 year us government bond yield and the dollar index ,GOLD lost over 500pips from Asian session to Newyork session trading on cease fire deal between Israel and Iran by united states of America.
In brief: The US 10-year yield’s slight dip combined with a steady DXY reflects a market balancing inflation, fiscal concerns, and Fed policy outlook. This environment supports cautious risk-taking with safe-haven demand still relevant.
follow zone of buy and sell for educational purpose only.
#gold #dollar

Is Gold Setting a Trap for Traders?Gold is currently retesting the FVG zone around 3,392 after breaking below a key trendline — a classic sell-trigger area if price gets rejected.
Bearish momentum is supported by:
U.S. jobless claims: 244K < 245K forecast → Stronger USD
Iran–Israel ceasefire → Reduced demand for safe-haven assets
If price fails to break above 3,392, the next downside target is the 3,299 support zone.
Trade idea: Watch for a rejection around 3,390–3,392 to consider short positions.
Bearish bias remains valid as long as price stays below 3,392.

Gold Challenges 2025 Trendline – Are We Breaking Lower?Following renewed Middle East ceasefire hopes and signs of exhausted buying momentum on the gold chart, the yellow metal has pulled back toward a key trendline—connecting higher lows since December 2024—currently near the 3,300 level.
If gold holds above 3,300 and continues to respect this broader trend support, the bullish trajectory may re-align, with potential upside targets at 3,400, 3,450, and 3,500.
However, a decisive close below 3,300 could signal a deeper corrective move. In that case, further downside may unfold toward 3,150, 3,050, 2,950, and 2,800, in line with the 1.272 and 1.618 Fibonacci extension levels derived from the April 2025 high, May 2025 low, and June 2025 high.
- Razan Hilal, CMT

Insist on bullish trend and wait for upward trend
Today's market analysis and interpretation:
First, gold weekly level: Last week, it closed negative, and continued to follow the yin-yang cycle. This week, it is likely to close positive again, and rely on the short-term 5-day and 10-day gradual shocks and strength; the medium-term trend continues to be bullish, and the nine-week wide consolidation is about to end. In fact, the big positive K last week has ended the shock and is ready to move upward. However, under the gradual warming of the geopolitical situation last week, it fell back and closed negative. It is indeed unexpected. It belongs to the control period. The risk aversion will always come. Wait patiently
Second, gold daily level: It closed with a long lower shadow cross K for two consecutive days. The lower track of the rising channel has always been effective support, including today, and it was only pierced, and it is still bottoming out and pulling up; the key point is When the closing price effectively stands on the 5-day moving average, then we should continue to attack upward to test the upper track of the channel, although the time cycle will basically approach 3490-3500;
Third, the gold 4-hour level: opened high to 3396, then fell back with a big negative, and did not stand on the middle track. At this time, the European session bottomed out and pulled up, breaking through the middle track again. Once the closing at 22:00 is confirmed to be above the middle track, accompanied by the golden cross below the zero axis of macd, this cycle will begin to gradually strengthen;
Fourth, the gold hourly level: the geopolitical situation is still fierce over the weekend and continues to heat up. Today's opening jumped high to 3396, then fell all the way back to 3347, and then stabilized and attacked to 3380. The overall situation is still discontinuous shock and the washing force is getting stronger each time, which shows that the competition between bulls and bears is becoming more and more intense, and they have been fighting for the gains and losses of the lower track of the daily channel; from the channel distribution, the key pressure is 3390. As long as it breaks through and stabilizes, it will be difficult to have a large-scale decline and wash; on the contrary, before 3390 breaks through and stands above, there is no need to rush to chase the rise for the time being. Pay attention to the support of 3360-65 and 3355-50. Continue to be bullish on dips and insist on pulling down and bullish. It is only a matter of time before 3390 breaks through or even stands above 3400, and this time is expected to be very near; because during the European session, the US dollar and gold continued to rise simultaneously, and gold performed quite resistant to declines, unlike last week, when it was suppressed immediately after a short sharp pull. This shows that gold's safe-haven properties are gradually recovering and returning.

XAUUSD Long Setup – Watching 3247 Entry ZoneHi Traders,
The recent price action of XAUUSD has been a bit complex, but I hope this idea turns out to be profitable for everyone.
Feel free to share your thoughts if you see anything differently.
What I find most interesting is the entry zone around 3247–3245 . If we take the wave count starting from May 15, 2025 (3120.76) and consider wave 5 to be completed on June 15, 2025 (3451.52), then wave 2 should ideally retrace to around 3247.
On top of that, wave C of wave 2 seems to follow a clean 1–2–3–4–5 structure. If we treat the current move as a downtrend, wave 5 would likely complete right at 3247, which I find both accurate and technically compelling.
I'll be watching 3247 closely and plan to go long from there.

XAUUSD NEXT WEEK UPDATE The chart you provided is a technical analysis of Gold Spot (XAU/USD) on a 3-hour timeframe, showing a bearish setup with the following key features:
---
🔍 Chart Analysis Summary:
Price Channel:
The price has been moving within an ascending channel (marked by two blue lines) but is now testing the lower boundary of this channel.
Breakout Direction:
A bearish breakout is projected, indicated by the large blue downward arrow. This suggests a possible trend reversal from bullish to bearish.
Entry & Target:
Current Price: ~3368.75
Target Price: ~3098.03
This matches the previous demand/support zone (yellow horizontal band near the bottom).
Stop Loss (SL):
Placed at 3528, just above recent highs to manage risk.
Risk Zone:
The red area shows the risk if price moves against the trade (stop loss zone).
The green area shows the reward zone (target profit area), highlighting a favorable risk/reward ratio.
Event Indicators:
Several economic event icons are placed near the projected move date (~June 24–26), suggesting that fundamental catalysts may support this move (e.g., FOMC, CPI, etc.).
---
✅ Bearish Setup Summary:
Setup Type: Bearish channel breakout
Sell Entry: On break and close below channel support (~3368)
Stop Loss: 3528
Take Profit: 3098
R/R Ratio: Favorable
Would you like a written trade plan or a summary in table format?

GOLD Made H&S Reversal Pattern , Chance To Sell To Get 200 PipsHere is My 15 Mins Chart On Gold and we have a very good reversal Pattern , Head & Shoulders , we have a 15 mins closure below neckline 3322.00 we can enter a sell trade and targeting at least 100 pips as scalping , we can enter after waiting the price to retest neckline and then enter . and the price can reach 3300.00 to 3296.00 again .

XAUUSD-Bearish Outlook and Price StructureA bearish outlook for gold (XAUUSD) on the 1-hour timeframe, with a bias toward the 3,100 area, targeting the highlighted demand zones.
Price-Movement Structure
We observe a three-wave corrective pattern that appears complete at the 3,494.98 high. Key observations:
- **Wave (A)** : Initial correction from the major low.
- **Wave (B)** : Complex sideways consolidation.
- **Wave (C)** : Extension to new highs, creating liquidity.
The current price action suggests potential institutional distribution at the highs. I am expecting a drop to approximately 3,349.94.
However, fundamentals such as interest rates, dollar strength, and geopolitical risks remain key drivers of bullish optimism.

Gold Spot / U.S. Dollar (1h Chart) - OANDA1-hour chart from OANDA shows the price movement of Gold Spot against the U.S. Dollar (XAU/USD). The current price is $3,323.720, reflecting a decrease of $45.480 (-1.35%) over the last hour. The chart includes a candlestick representation with a notable downward trend, a support level around $3,324.455, and a resistance zone between $3,352.955 and $3,360.000. The time frame displayed ranges from 12:00 to 3:00, with the data updated as of 12:52 PM PKT on June 24, 2025.

6.26 Gold intraday analysis guideOn Wednesday (June 25), international spot gold rose slightly during the US trading session, but was still suppressed by the 20-day moving average (US$3,355). The RSI (14) was at 48.7, in the neutral range of 40-60, suggesting that the market lacks a clear direction. US$3,355 (20-day moving average) has become the recent watershed between long and short positions. If it breaks through this level, it may test the psychological barrier of US$3,400. The support below is US$3,245 (the low point on May 29). If it fails, it may drop to the integer level of 3,200 and US$3,121 (the low point on May 15). Stability of the geopolitical situation: If the ceasefire agreement in the Middle East continues, the outflow of safe-haven funds may further suppress the gold price. Fed policy expectations: If the July non-agricultural and CPI data show that inflation is cooling down, it may rekindle expectations of interest rate cuts and boost gold. The current gold market is in a "wait-and-see mode", and both long and short sides lack decisive momentum. Traders need to pay close attention to: US economic data: especially employment and inflation indicators for the Fed's policy path. Geopolitical dynamics: Any breakdown of the ceasefire agreement could quickly push up safe-haven demand. Dollar trend: If the Fed maintains a hawkish stance, a stronger dollar may further suppress gold prices. Gold is expected to maintain range fluctuations in the short term, with the $3,355 moving average resistance and $3,245 support forming a key trading range. The direction of the breakthrough depends on new fundamental catalysts.
Personal operation analysis:
Trend: Oscillating trend
Support: Near 3,300.00
Resistance: Near 3,335.50
Strategy:
View logic: Short view near 3,335-3,340, stop loss 3,345, take profit near 3,300--3,280, and follow the stop loss 300 points.

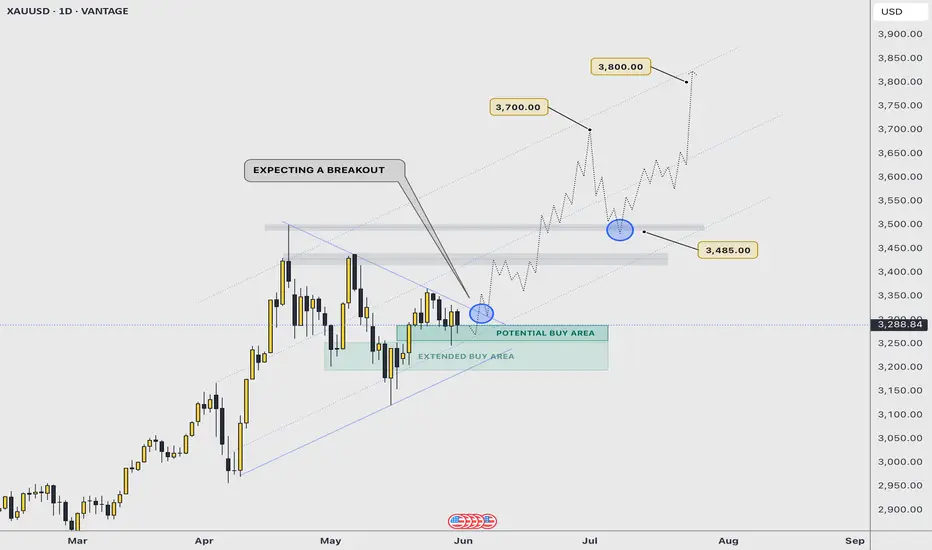
BREAKOUT SOON | $3700 - $3800 As illustrated, I’m visualising the next potential bullish continuation impulse that would take gold near the $4000 projected price.
In this idea, the path projected is based on the breakout of a rising symmetrical triangle that price formed; a strong bullish pattern that tends to be very effective when price successfully breaks out with strength.
On a fundamental aspect, things continue to hold the yellow metal on a positive route to maintain its bullish momentum and direction. Fed rates decision is getting close, and that is just the tip of the iceberg that’s going to move gold to record highs within weeks.
A key and major pivot area is near the $3200 - $3250 price range; so it’s possible we have one more attempt to break $3200.
—
GOOD LUCK
persaxu
Gold is near the 0.618 levelGold is near that 0.618 level, going to watch it closely from here. We might not get an entry until Sunday at 6pm NY time when market open.
Key Level to watch 3249, 3194
We need SPY / ES to come down for gold to gain momentum.

GOLD Will Grow! Long!
Here is our detailed technical review for GOLD.
Time Frame: 1h
Current Trend: Bullish
Sentiment: Oversold (based on 7-period RSI)
Forecast: Bullish
The market is trading around a solid horizontal structure 3,290.38.
The above observations make me that the market will inevitably achieve 3,315.54 level.
P.S
We determine oversold/overbought condition with RSI indicator.
When it drops below 30 - the market is considered to be oversold.
When it bounces above 70 - the market is considered to be overbought.
Disclosure: I am part of Trade Nation's Influencer program and receive a monthly fee for using their TradingView charts in my analysis.
Like and subscribe and comment my ideas if you enjoy them!

GOLD Intraday H1 Chart Update For 23 June 25 GOLD Intraday Chart show mid term Bearish move for now
For Today keep an eyes on 3368 level Breakout for Buy Scalping for long trade we may wait for dip around 3330-3340 zone SL remains possibly 100 pips
As long as market sustains below 3400 Psychological Level it will remains Bearish and will try to move towards 3200-30 Psychological


XAUUSD-Mapping the Last Wave of the Current Bull CycleI expect gold to be entering the final bullish wave of its current long-term cycle, with an ultimate target in the $3,900–$4,050 range.
However, the first major resistance lies between $3,600 and $3,700, where I expect a potential pullback.
From there, a healthy correction toward $3,300–$3,400 is likely.
If strong buying momentum steps in at that support zone, we may see gold continue its rally toward the final target.
Key Risk Level:
Pay close attention to the $3,300–$3,400 support.
If gold fails to hold above it, and closes decisively below, this could signal that $3,600 was already the final top of this bull cycle.

Gold is Nearing an Important Support!!Hey Traders, in today's trading session we are monitoring XAUUSD for a buying opportunity around 3,360 zone, Gold is trading in an uptrend and currently is in a correction phase in which it is approaching the trend at 3,360 support and resistance area.
Trade safe, Joe.
Today's gold trading strategy, I hope it will be helpful to youRecent geopolitical tensions remain high, particularly in the Middle East where conflicts between Israel and Iran continue to generate new developments. Earlier this week, Iran was hit by an Israeli airstrike, a piece of news that instantly triggered a sharp rally in gold prices, pushing the metal to an intraday high of $3,450 per ounce. However, subsequent news of peace talks eased market risk aversion, causing gold to retreat rapidly. By June 18th, the price had dropped to $3,380 per ounce, with a daily volatility exceeding 2.7%.
Generally, geopolitical conflicts influence gold prices for 3 to 15 days, and when tensions ease, 50% to 70% of the conflict-driven rally tends to retrace. For example, during the Russia-Ukraine ceasefire talks in October 2024, gold prices fell from $2,789 to $2,650 per ounce, a 5% retracement. Although the geopolitical situation has not further deteriorated, as long as tensions persist, gold remains susceptible to sudden price swings triggered by breaking news.
In the 4-hour chart, the Bollinger Bands are narrowing, while the MACD indicator continues to operate below the zero axis in a bearish crossover, with green bars expanding—indicating a clear short-term bearish trend. Notably, the RSI indicator is currently in the oversold zone, suggesting potential for a price rebound. In terms of support and resistance levels, the lower support can be referenced at $3,340 per ounce, while the upper resistance focuses on $3,380 per ounce. A break above $3,380 may trigger a rebound, whereas a drop below $3,340 could lead to further declines.
Today's gold trading strategy, I hope it will be helpful to you
XAUUSD sell@3370~3380
SL:3390
TP:3360~3350

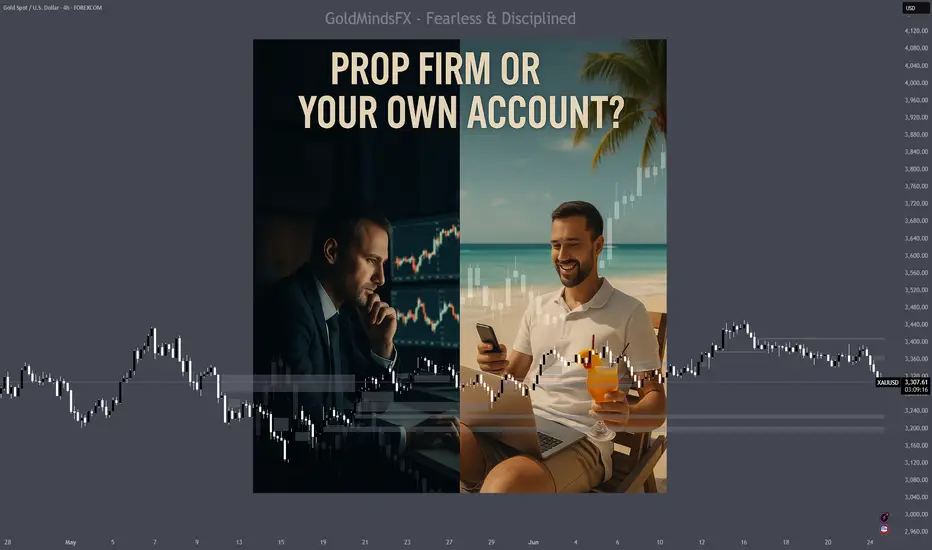
XAUUSD - Prop firm or your own account? - Trading Psychology"$100K Funded? Or $1K account you own?? Welcome to the Inside Battle of Every Trader"
You want capital, freedom and win big.
But the question is: do you do it with your own money, or someone else’s?
You’ve got the $100K funded dream on one side. Big leverage, strict rules, payout drama.
And on the other side? Your own $1K account. Zero limits, zero support, and a whole lot of emotional damage.
This is a breakdown of what really happens behind both paths — the adrenaline, the self-sabotage, the mind games, and the payouts that sometimes never come.
The Prop Firm Path: Pass, Survive, Then Pray
Phase 1: You trade with hunger.
You’ve got the goal in sight, and every move is calculated. You’re alert, focused, mechanical. The structure helps. The rules feel like a challenge. Everything feels possible.
Phase 2: You trade with fear.
Now you’re tiptoeing. The target’s smaller, but the pressure is suffocating. Hesitation.Overthink. You play defense — and that’s when you lose. You stop executing your edge and start trading to avoid failure.
Funded: The real test begins.
You go live, you trade well, you hit payout… and suddenly the firm has a problem. A new rule is “suddenly” enforced. A clause is reinterpreted. A delay happens. You’re told to wait. Or worse — your account is shut with no warning.
That’s the part no one prepares you for: the waiting, the silence, the mental snap.
Passing isn’t the end. It’s barely the middle.
✅ So, Should You Go Prop? Here's What You Need to Know
Yes — if you’re ready to treat this like a hostile contract.
If you’re trading a prop account, you are trading their rules, their terms, their timing. You are not a partner — you are a performer. And they are very comfortable pulling the plug.
If you do it:
• Be colder than the system.
• Read every rule twice.
• Trade Phase 2 like a surgeon — no ego, no rush.
• And never treat a payout like it's guaranteed — treat it like a fight you have to win more than once.
You don’t just pass. You survive.
And if you’re not ready to survive, stay out.
🚨 Do not forget — It’s Simulated Capital. And That’s the Game.
Let’s not pretend it’s hidden:
You’re NOT TRADING REAL MONEY. You’re executing on a simulated account that mirrors real conditions — nothing more.
When you get paid, it’s not because you “grew” capital. It’s because you performed better than the masses who failed their challenges and fed the payout pool.
This isn’t shady. It’s the model — and it works because most traders lose.
So don’t delude yourself into thinking you’re managing funds.
You’re monetizing discipline inside a challenge-based system.
And if you know how to work that system? You get paid.
If you don’t? You become someone else’s payout.
🔓 Trading Your Own Money: Real Freedom or Emotional Damage?
With your own capital, there’s no one watching — and no one helping.
You set the rules. You decide how aggressive, how cautious, how chaotic.
But the second you click “Buy,” your psychology comes for you like a debt collector.
Because real trading isn’t what’s on the screen — it’s what’s happening between your ears.
You lose your money, you lose your confidence.
You win big, and suddenly you think you’ve figured out the market — until the market slaps you for it.
There’s no one to blame, and that makes it ten times harder.
But here’s the part no one can take away from you: every lesson is yours.
Every win is clean. Every loss hits deep. And if you make it — you really made it.
💡 How to Make Self-Funded Work for You
✅ Start with small capital — but also invest in your trading education.
Join a group that teaches you how to trade, not signal groups that just give you orders when to buy or sell, without explaining why.
✅ Join a real trading community.
Surround yourself with people who post actual breakdowns — who teach, not flex.
Avoid ego chats. Avoid circus chats. Find people who show the why, not just the entry.
(If you’re reading this, you already found the right space.)
✅ Focus on fixing mistakes — not faking wins.
Nobody cares how many pips you caught if you blew 5 trades getting there. Get real about your risk management and lot size.
✅ Learn to stop after a win.
Don’t feed your dopamine. Protect your equity. Walk away while you’re still in control.
✅ Respect your losses. Don’t chase them.
Red days don’t destroy traders. Revenge trading does. Stop. Reset. Come back sharper.
✅ If you’re not paying yourself yet, don’t panic.
Some seasons are for building, not cashing out. Don’t force results just to feel good — let the system earn before it pays.
🔄 The Hybrid Advantage: Rent the rules. Own the skill.
Some traders don’t pick a side.
They use prop firms like a hired weapon — fast, effective, disposable and
Personal accounts like a vault — protected, scalable, sacred.
They switch between them based on market conditions, mental load, and long-term goals.
You don’t need to be loyal to a style just be loyal to your results.
🧠 Final Word:
Trading becomes real, sustainable, and successful only when your mind is at peace with the path you chose.
If you wake up anxious about your account — if you feel pressure before you even open the chart — that’s not discipline, that’s misalignment.
This doesn’t mean trading should feel easy. But it should feel right.
You should wake up curious to read price, not terrified to take a trade.
Whether you trade $100K or $1K, the real account is always in your head.
You should feel like this work belongs to you — not like you’re trying to survive someone else’s idea of success.
Whether you trade with a prop firm or your own account, or both, the goal is the same:
Mental clarity. Emotional control. Strategic confidence. You’ll know you’re on the right path the moment the stress fades — and the obsession becomes patience, structure and joy with success.
If this lesson helped you today and brought you more clarity:
Drop a 🚀 and follow us✅ for more published ideas.