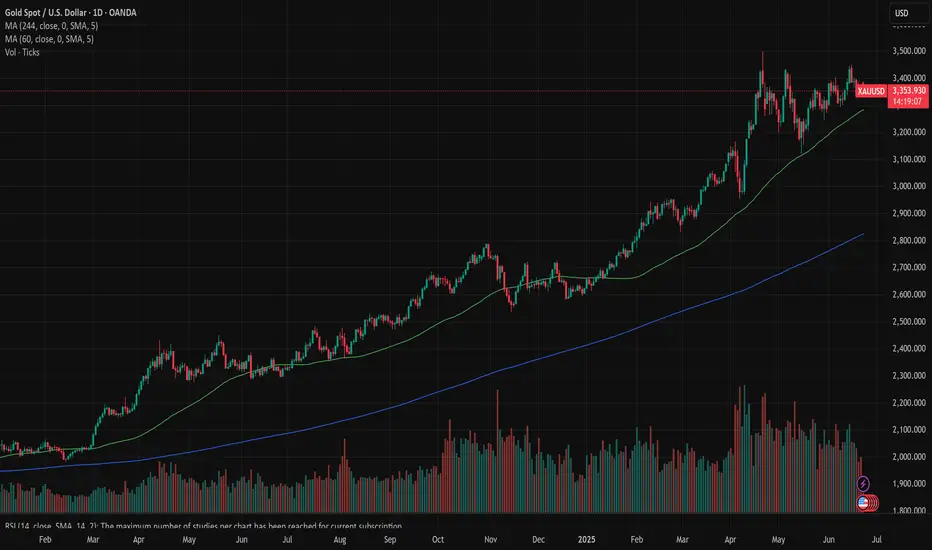
Gold: waiting the U.S. decisionGold was traded in a relaxed manner during the previous week, as investors are anticipating the final decision of the U.S. Administration, regarding their involvement in the Middle East conflict. On the other hand, the Fed held interest rates unchanged at the FOMC meeting during the previous week. The price of gold reached its highest weekly level at the start of the week, at $3.446 and for the rest of the week was traded in a modestly negative sentiment, ending the week at $3.368.
The RSI continues to move between levels of 60 and 53. This shows that investors are still not certain which side to trade. The indicator is still holding more close toward the overbought market side. There is still no change with MA 50 and MA 200 lines as they continue to move in parallel with an uptrend. Still, charts are showing that the price of gold found a supporting line with MA50, since April this year.
Analysts are noting that central banks continue to be one of major gold buyers. Considering high geopolitical and economic uncertainties, the price of gold has the potential to go even higher from current levels. However, for the week ahead, charts are showing that some further corrections might be possible, at least till the level of $3,2K. Some stronger corrections should not be expected. The price of gold also has equal opportunities for a move toward the upside, where the level of $3.430 might be tested for one more time. There is also the potential for higher grounds, but it is unclear whether it will occur in the week ahead or probably at a longer time frame.
GOLDMINICFD trade ideas
XAUUSD-Bearish Outlook and Price StructureA bearish outlook for gold (XAUUSD) on the 1-hour timeframe, with a bias toward the 3,100 area, targeting the highlighted demand zones.
Price-Movement Structure
We observe a three-wave corrective pattern that appears complete at the 3,494.98 high. Key observations:
- **Wave (A)** : Initial correction from the major low.
- **Wave (B)** : Complex sideways consolidation.
- **Wave (C)** : Extension to new highs, creating liquidity.
The current price action suggests potential institutional distribution at the highs. I am expecting a drop to approximately 3,349.94.
However, fundamentals such as interest rates, dollar strength, and geopolitical risks remain key drivers of bullish optimism.

Today's gold trading strategy, I hope it will be helpful to youRecent geopolitical tensions remain high, particularly in the Middle East where conflicts between Israel and Iran continue to generate new developments. Earlier this week, Iran was hit by an Israeli airstrike, a piece of news that instantly triggered a sharp rally in gold prices, pushing the metal to an intraday high of $3,450 per ounce. However, subsequent news of peace talks eased market risk aversion, causing gold to retreat rapidly. By June 18th, the price had dropped to $3,380 per ounce, with a daily volatility exceeding 2.7%.
Generally, geopolitical conflicts influence gold prices for 3 to 15 days, and when tensions ease, 50% to 70% of the conflict-driven rally tends to retrace. For example, during the Russia-Ukraine ceasefire talks in October 2024, gold prices fell from $2,789 to $2,650 per ounce, a 5% retracement. Although the geopolitical situation has not further deteriorated, as long as tensions persist, gold remains susceptible to sudden price swings triggered by breaking news.
In the 4-hour chart, the Bollinger Bands are narrowing, while the MACD indicator continues to operate below the zero axis in a bearish crossover, with green bars expanding—indicating a clear short-term bearish trend. Notably, the RSI indicator is currently in the oversold zone, suggesting potential for a price rebound. In terms of support and resistance levels, the lower support can be referenced at $3,340 per ounce, while the upper resistance focuses on $3,380 per ounce. A break above $3,380 may trigger a rebound, whereas a drop below $3,340 could lead to further declines.
Today's gold trading strategy, I hope it will be helpful to you
XAUUSD sell@3370~3380
SL:3390
TP:3360~3350

XAUUSD-Mapping the Last Wave of the Current Bull CycleI expect gold to be entering the final bullish wave of its current long-term cycle, with an ultimate target in the $3,900–$4,050 range.
However, the first major resistance lies between $3,600 and $3,700, where I expect a potential pullback.
From there, a healthy correction toward $3,300–$3,400 is likely.
If strong buying momentum steps in at that support zone, we may see gold continue its rally toward the final target.
Key Risk Level:
Pay close attention to the $3,300–$3,400 support.
If gold fails to hold above it, and closes decisively below, this could signal that $3,600 was already the final top of this bull cycle.

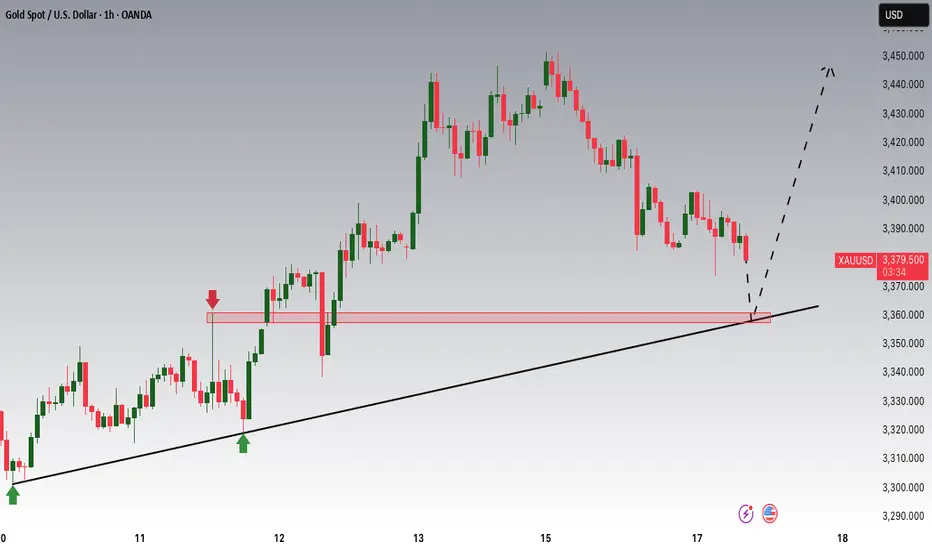
Gold is Nearing an Important Support!!Hey Traders, in today's trading session we are monitoring XAUUSD for a buying opportunity around 3,360 zone, Gold is trading in an uptrend and currently is in a correction phase in which it is approaching the trend at 3,360 support and resistance area.
Trade safe, Joe.
GOLD (XAUUSD): Updated Support & Resistance Analysis
Here is my latest support and resistance analysis for Gold.
Horizontal Structures
Support 1: 3294 - 3312 area
Support 2: 3231 - 3287 area
Support 3: 3121 - 3176 area
Resistance 1: 3338 - 3368 area
Resistance 2: 3441 - 3451 area
Resistance 3: 3493 - 3500 area
Vertical Structures
Vertical Support 1: Falling trend line
Consider these structures for pullback/breakout trading.
❤️Please, support my work with like, thank you!❤️
I am part of Trade Nation's Influencer program and receive a monthly fee for using their TradingView charts in my analysis.

GOLD I Monday CLS I KL - OB/FVG I Target Monday CLS HighsHey, Market Warriors, here is another outlook on this instrument
If you’ve been following me, you already know every setup you see is built around a CLS Footprint, a Key Level, Liquidity and a specific execution model.
If you haven't followed me yet, start now.
My trading system is completely mechanical — designed to remove emotions, opinions, and impulsive decisions. No messy diagonal lines. No random drawings. Just clarity, structure, and execution.
🧩 What is CLS?
CLS is real smart money — the combined power of major investment banks and central banks moving over 6.5 trillion dollars a day. Understanding their operations is key to markets.
✅ Understanding the behavior of CLS allows you to position yourself with the giants during the market manipulations — leading to buying lows and selling highs - cleaner entries, clearer exits, and consistent profits.
📍 Model 1
is right after the manipulation of the CLS candle when CIOD occurs, and we are targeting 50% of the CLS range. H4 CLS ranges supported by HTF go straight to the opposing range.
Analysis done on the Tradenation Charts
Disclosure: I am part of Trade Nation's Influencer program and receive a monthly fee for using their TradingView charts in my analysis.
"Adapt what is useful, reject what is useless, and add what is specifically your own."
— David Perk aka Dave FX Hunter ⚔️
👍 Hit like if you find this analysis helpful, and don't hesitate to comment with your opinions, charts or any questions.

Gold price short term recovery 3366⭐️GOLDEN INFORMATION:
Kansas City Federal Reserve President Jeff Schmid stated on Wednesday that the central bank has sufficient time to assess the impact of tariffs on inflation before making any decisions regarding interest rates. His remarks suggest a cautious approach and align with Fed Chair Jerome Powell’s comments from the previous day.
Chair Powell reaffirmed the view that there is no urgency to alter monetary policy, emphasizing a patient, data-driven approach as the Fed monitors economic developments. This less dovish tone from Fed leadership may help cap downside pressure on gold in the near term.
Meanwhile, money markets are fully pricing in two rate cuts by the end of 2025, with a September move seen as more probable than one in July—although expectations for a July cut have slightly increased since last week.
⭐️Personal comments NOVA:
Gold price recovered and continued to accumulate, pay attention to the GAP 3366 area at the beginning of the week, selling pressure is still maintained.
⭐️SET UP GOLD PRICE:
🔥SELL GOLD zone: 3366- 3368 SL 3373
TP1: $3358
TP2: $3345
TP3: $3330
🔥BUY GOLD zone: $3303-$3301 SL $3296
TP1: $3315
TP2: $3328
TP3: $3340
⭐️Technical analysis:
Based on technical indicators EMA 34, EMA89 and support resistance areas to set up a reasonable BUY order.
⭐️NOTE:
Note: Nova wishes traders to manage their capital well
- take the number of lots that match your capital
- Takeprofit equal to 4-6% of capital account
- Stoplose equal to 2-3% of capital account

GOLD (XAUUSD): Intraday Bullish Confirmation
Gold is retesting a recently broken trend line of a bullish flag
pattern that I shared with you earlier.
A double bottom pattern on that and a violation of its neckline
provide a strong intraday confirmation.
I think that the price may rise to 3392 level.
❤️Please, support my work with like, thank you!❤️

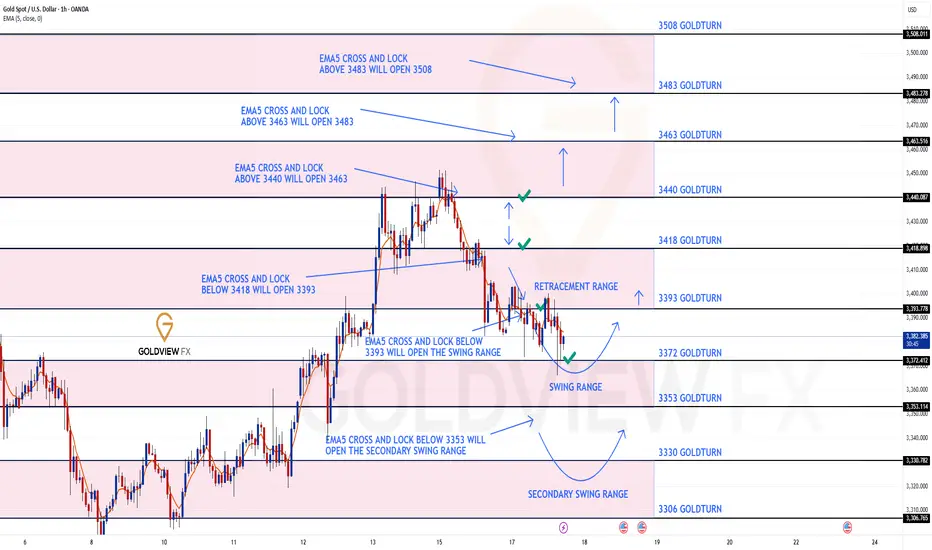
GOLD ROUTE MAP UPDATEHey Everyone,
Another great day on the markets with our chart idea playing out, as analysed!
Yesterday we started with our Bullish target at 3440 hit, followed with no EMA5 cross and lock, confirming the perfect rejection and showcasing the accuracy of our levels. This rejection went on to hit our Bearish target, followed by EMA5 cross and lock opening 3393, which was also hit perfectly.
🔄 Update:
After testing 3393, we got the EMA5 cross and lock, opening the swing range. The first level was tested perfectly and gave the bigger bounce. Let’s see if it completes the full swing back to 3393, or if it goes for the full swing test below.
We will keep the above in mind when taking buys from dips. Our updated levels and weighted levels will allow us to track the movement down and then catch bounces up.
We will continue to buy dips using our support levels, taking 20 to 40 pips. As stated before, each of our level structures gives 20 to 40 pip bounces, which is enough for a nice entry and exit. If you back-test the levels we shared every week for the past 24 months, you can see how effectively they were used to trade with or against short/mid-term swings and trends.
🌀 The swing ranges give bigger bounces than our weighted levels - that's the difference between the two.
BULLISH TARGET
3440 - DONE
EMA5 CROSS AND LOCK ABOVE 3340 WILL OPEN THE FOLLOWING BULLISH TARGETS
3463
EMA5 CROSS AND LOCK ABOVE 3463 WILL OPEN THE FOLLOWING BULLISH TARGET
3483
EMA5 CROSS AND LOCK ABOVE 3483 WILL OPEN THE FOLLOWING BULLISH TARGET
3508
BEARISH TARGETS
3418 -DONE
EMA5 CROSS AND LOCK BELOW 3418 WILL OPEN THE FOLLOWING BEARISH TARGET
3393 DONE
EMA5 CROSS AND LOCK BELOW 3393 WILL OPEN THE SWING RANGE
3372 - DONE
3353
EMA5 CROSS AND LOCK BELOW 3353 WILL OPEN THE SECONDARY SWING RANGE
3330
3306
As always, we will keep you all updated with regular updates throughout the week and how we manage the active ideas and setups. Thank you all for your likes, comments and follows, we really appreciate it!
Mr Gold
GoldViewFX
THE KOG REPORT - FOMCTHE KOG REPORT – FOMC
This is our view for FOMC, please do your own research and analysis to make an informed decision on the markets. It is not recommended you try to trade the event if you have less than 6 months trading experience and have a trusted risk strategy in place. The markets are extremely volatile, and these events can cause aggressive swings in price.
A you can see traders the pre-event price action started yesterday with the hourly now playing between the MA’s and waiting for FOMC for a potential breakout. As usual, we have highlighted the key levels and added the red boxes for all of you to help navigate the movement should this not be priced in.
Also remember, there is a press conference after the release, this is usually the time the market will react to anything Powell says about future plans for the economy.
Now, looking at the 4H, we have support at the 3370-65 level and below that 3355. If these are attacked and give a RIP, opportunity for the long trade may be available into the 3395 red box which price will need to break to go higher. If we can break above this red box, we can then look to attempt higher price with the levels 3430, 3445 and above that 3455-60 on the horizon. It’s that red box sitting higher up around the 3470-75 region which needs to be watched if we do get up there as an opportunity to attempt the reverse trade may present itself from there depending on the volume.
So in summary, we have 3 key levels in play, ideally a move upside and rejection from the 3400-6 level giving a further dip would suit buyers to get better pricing.
KOG’s RED BOX TARGETS:
BREAK ABOVE 3395 for 3404, 3406, 3410, 3420, 3430, 3435 and 3459 in extension of the move
BREAK BELOW 3380 FOR 3375, 3364, 3351, 3342, 3333 AND 3327 IN EXTENSION OF THE MOVE
LEARN AND GENERATE YOUR OWN SIGNALS. You don't need any of us to guide you.
Please do support us by hitting the like button, leaving a comment, and giving us a follow. We’ve been doing this for a long time now providing traders with in-depth free analysis on Gold, so your likes and comments are very much appreciated.
As always, trade safe.
KOG

GDP and price range accumulated above 3300⭐️GOLDEN INFORMATION:
Gold prices held firm during the North American session on Wednesday, climbing over 0.30% as easing tensions between Israel and Iran boosted risk sentiment. Meanwhile, disappointing US housing data could prompt future action from the Federal Reserve (Fed). However, Fed Chair Jerome Powell's continued hawkish stance has limited further upside for the precious metal.
At the time of writing, XAU/USD is trading around $3,334, up 0.34%, as the US Dollar pares earlier gains and Wall Street posts modest advances.
⭐️Personal comments NOVA:
moving in accumulation range following 2 trend lines, trading above 3300
⭐️SET UP GOLD PRICE:
🔥SELL GOLD zone: 3364- 3366 SL 3371
TP1: $3352
TP2: $3345
TP3: $3330
🔥BUY GOLD zone: $3302-$3300 SL $3295
TP1: $3315
TP2: $3328
TP3: $3340
⭐️Technical analysis:
Based on technical indicators EMA 34, EMA89 and support resistance areas to set up a reasonable BUY order.
⭐️NOTE:
Note: Nova wishes traders to manage their capital well
- take the number of lots that match your capital
- Takeprofit equal to 4-6% of capital account
- Stoplose equal to 2-3% of capital account

XAUUSD Channel Up bottomed, giving a strong buy signal.Gold (XAUUSD) has been trading within a 1-month Channel Up since the May 20 low and right now it is consolidating within and just outside the 4H MA50 (blue trend-line) and 4H MA100 (green trend-line) zone. At the same time, it has touched the bottom of the Channel Up.
This is exactly the kind of price action the pattern had during its previous bottom formation following a Higher Low (June 9-11). With the 4H RSI having also formed a Higher Low pattern consistent with all previous 3 Lows, we expect the price to start its new Bullish Leg now. Our Target is 3495 (+4.75% from the bottom).
-------------------------------------------------------------------------------
** Please LIKE 👍, FOLLOW ✅, SHARE 🙌 and COMMENT ✍ if you enjoy this idea! Also share your ideas and charts in the comments section below! This is best way to keep it relevant, support us, keep the content here free and allow the idea to reach as many people as possible. **
-------------------------------------------------------------------------------
Disclosure: I am part of Trade Nation's Influencer program and receive a monthly fee for using their TradingView charts in my analysis.
💸💸💸💸💸💸
👇 👇 👇 👇 👇 👇

Gold Peaked, Deep Analysis: MACD & RSI, Targets: $3,131 & $2,904Gold (XAUUSD) already peaked. The 22 Apr session was a clear top signal. A very strong one at that. The chart is showing a lower (red arrows) and overall distribution channel. Trading volume continues to drop. Bearish volume is predominant.
Gold produced a strong rally, it lasted 159 days. Total growth amounts to +39% from bottom to top, starting November 2024, end April 2025.
It's been 64 days since the all-time high. No new highs, no bullish momentum. Geopolitical factors that would push Gold to new all-time highs, a war, did show up recently, a surprise event and yet Gold's price failed to move higher. This is a warning signal.
The RSI is weak now. Gold is trading very high, a very strong price but with a risk RSI. This is another warning signal, a strong one. Bullish would be the contrary, low price with a strong RSI. A weak RSI at this point can be interpreted as the bullish force being exhausted.
The daily MACD is pretty bad. Trending fully down with no possibility of anything bullish. Here is the chart.
This is a friendly reminder. Switch to Crypto.
You've been warned.
Namaste.

Gold Breakout Done New Short Entry Valid To Get 200 Pips !Here is my opinion on gold at he moment , in 15 mins T.F wr have a fake breakout but 3343.00 forced the price to go down which is a great res for this pair and we have avery good bearish price action and good closure below my res level 3341.00 so it`s my num 1 place to enter a sell trade if the price go back to retest it , and if not , 3383.00 will be my best place to sell it .

Hanzo | 30-Min Setup / incoming 300 Pip After Break Out Time Frame: 30 -Minute Warfare
Entry Mode: Only after verified Break out
🩸Bullish Break : 3338 : 3342.5
Price must break liquidity with high volume to confirm the move.
➕ Hanzo Protocol: Dual- Entry Intel
Zone Activated: Deep Analysis ( 3338 ) Point
why we did chose it ?
Solid Key level
➗1st Wick Touch (11 Jun /2025)
➗2nd Wick Touch (12 Jun /2025)
➗3rd Wick Touch (24 Jun /2025)
Deep Analysis ( 3338 ) Point
why we did chose it ?
➗1st Wick Touch (11 Jun /2025)
➗2nd Wick Touch (11 Jun /2025)
➗3rd Wick Touch (11 Jun /2025)
➗4th x2 Wick Touch (20 Jun /2025)
➗5th x2 Wick Touch (24 Jun /2025)
🔖That means we created a Solid Zone (3338 : 3342) of Breakout on the 30-min Chart -
Price must break liquidity with a clear 30-min candle to confirm the move.

GOLD Made Double Top Reversal Pattern , Ready For Sell ?Here is My 15 Mins Chart On Gold and we have a very good reversal Pattern , double Top , if we have a 15 mins closure below neckline 3326.00 we can enter a sell trade and targeting at least 100 pips as scalping , we can enter direct if you are aggressive trader or if you not you can wait the price to retest neckline and then enter .

Gold on a decline / Fundamentals critically BullishTechnical analysis: The Price-action respected my Resistance zone limit projection as Gold is testing #3,352.80 local Low’s, and #3,377.80 Resistance in extension as a new viable Target for Buyers before aggressively pulling back to possible #3,320’s level (Gold is turning from Bearish to Neutral on the Short-term if market closes above #3,377.80 fractal, very slim chances). Once more Gold is being utilized as a safe-haven as the equity markets suffer significant losses. However as discussed before, I am making use of the DX as my key indicator to suggest the underlying trend of Gold, turned / switch from Bullish Short-term to Bearish as Gold didn’t managed to maintain Higher levels above #3,377.80 / my Resistance for the fractal. DX made an solid Technical Lower High’s Upper zone and didn’t rebounded strongly, which is confirmation of Selling sustainability on Gold (Gold couldn’t stage Bullish reversal until DX lost value and vice-versa). I expect late sessions of the week to maintain this momentum, so that by Friday’s session, Gold can test my #3,327.80 Target extension (posing as an important benchmark).
My position : Besides all Fundamental factors / escalation, Gold isn't soaring as one could expect. Therefore I will continue Scalping #3,352.80 - #3,377.80 Neutral belt and will Trade the break-out. #3,352 towards #3,327.80 or #3,377.80 to the upside however with DX rising, I give more probabilities to the downside.

GOLD Price Forecast: Is the Pullback Over? | Weekly OutlookWill XAUUSD resume its bullish trend, or is more downside ahead?
In this video, I break down last week’s gold price movement and the current market reaction to rising geopolitical tensions between Iran and Israel, now with the U.S. joining the conflict. We also assess the impact of the Fed’s recent rate hold, weak retail sales, and upcoming high-impact U.S. economic events like PMI, GDP, and Core PCE.
💡 Here’s what you’ll learn:
✅What caused gold’s pullback last week
✅Why institutional traders shake out retail buyers
✅Key fundamentals driving gold right now
✅How to position yourself smartly for the upcoming trading week
🔔 Don’t forget to like the video in support of this work.
Disclaimer:
Based on experience and what I see on the charts, this is my take. It’s not financial advice—always do your research and consult a licensed advisor before trading.
#goldanalysis, #xauusd, #goldforecast, #goldpriceprediction, #forexanalysis, #fundamentalanalysis, #forextrading, #tradinggold, #goldnews, #federalreserve, #marketpsychology, #tradingstrategy, #geopoliticalrisk, #usdata, #iranisraeltensions, #goldbullish, #goldbearish, #forexmentor, #xauusdforecast, #tradingview

GOLD THE united state interest rate stands at 4.25%-4.5%
the US10Y open the day at 4.293% and closes 4.26% a significant drop from may high of 4.62%
the dollar index is heading to 96$ after open 97.611$ to close 97.313$.
Final GDP q/q
Actual: -0.5%
Forecast: -0.2%
Previous: -0.2%
The US economy contracted by 0.5% in the first quarter, worse than the expected 0.2% decline, indicating a sharper slowdown than anticipated.
2. Unemployment Claims
Initial Claims: 236,000
Forecast: 244,000
Previous: 245,000
Initial jobless claims fell by 10,000 to 236,000, lower than forecast and near historically low levels, suggesting that layoffs remain relatively subdued despite economic challenges.
3. Core Durable Goods Orders m/m
Actual: +0.5%
Forecast: +0.1%
Previous: +0.2%
Core durable goods orders, which exclude transportation, rose 0.5% month-over-month, beating expectations and signaling some resilience in business investment.
4. Durable Goods Orders m/m
Actual: +16.4%
Forecast: +8.6%
Previous: -6.3%
Total durable goods orders surged 16.4%, a strong rebound following a prior decline, indicating a pickup in demand for long-lasting manufactured goods.
5. Final GDP Price Index q/q
Actual: 3.7%
This measure of inflation in the GDP deflator remains elevated, reflecting persistent price pressures in the economy.
Summary of Market Implications:
The larger-than-expected GDP contraction signals economic weakness, which could increase expectations for accommodative Fed policy.
The drop in initial jobless claims supports the view that layoffs are limited, but rising continuing claims suggest some labor market softness ahead.
Strong durable goods orders point to underlying business investment strength, providing a mixed but cautiously optimistic outlook.
Elevated inflation as shown by the GDP price index keeps inflation concerns alive.
Overall, the data presents a complex picture of a slowing economy with pockets of resilience and ongoing inflationary pressures
the interest rate remains 4.24%-4.5% ,the bond market remain weak on fiscal policy challenges and pending rate outlook.
the 10 year bond yield is trading around 4.291% -4.26% and edge lower from fundamental outlook.
gold on ascending trendline connecting April till June and found support at 3312-3314.
buyers during newyork session will build momentum on technical to bridge 3350 supply .
break below 3311-3314 will heading to my demand floor .
#gold .

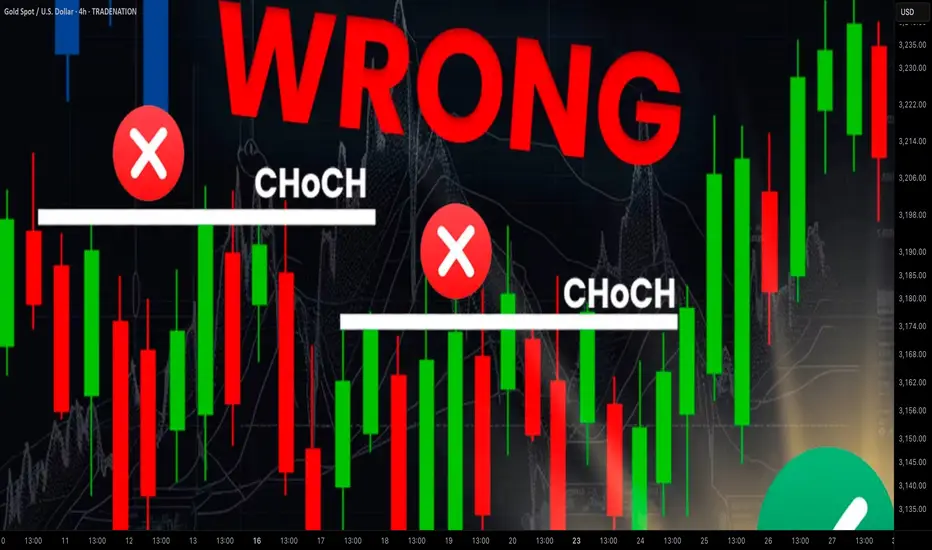
Learn Best Change of Character CHoCH Model in Trading with SMC
Most of the SMC traders get Change of Character CHoCH WRONG!
In this article, I will share with you Change of Character models that have a low accuracy and better to be avoided.
I will teach you the best CHoCH model for Forex Gold trading and show you how to identify it easily.
Let's start with the basic theory first and discuss what Change of Character signifies.
Change of Character in Bearish Trend
In a downtrend, Change of Character CHoCH is an important event that signifies a violation of a bearish trend.
CHoCH is confirmed when the price breaks and closes above the level of the last lower high.
Above, is a text book Change of Character model in a bearish trend.
For the newbie traders, such a price action provides a strong signal to buy while it fact it is NOT .
One crucial thing is missing in this model to confirm a bullish reversal.
According to basic trend analysis rules, we say that the market trend is bullish if the price forms a bullish impulse, retraces and sets a Higher Low HH , forms a new bullish impulse with a new Higher High HH.
Only then, we can say that the market is trading in up trend.
CHoCH model above confirms a bearish trend violation BUT it does not confirm a trend change.
Such a model may easily signify a deeper correction.
Look what happened with GBPNZD.
Though the price formed a confirmed bearish CHoCH, it was a false signal and just an extended correction.
That's a perfect bullish reversal model.
It combines CHoCH and conditions for a bullish trend.
Such a union is extremely accurate in predicting up movements.
Examine a price action on USDJPY.
Not only the price formed a confirmed CHoCH but also we see a start of a new bullish trend.
Change of Character in Bullish Trend
In an uptrend, Change of Character CHoCH is a significant event that signifies a violation of a bullish trend.
CHoCH is confirmed when the price breaks and closes below the level of the last higher low.
Above is a typical model of a bearish CHoCH.
For many traders, that is the signal to open short.
However, it is not that accurate and one important component is missing there.
According to basic price action rules, the market trend is bearish
if the price forms at least 2 bearish impulses with Lower Lows LL and a pullback between them with a Lower High LH.
Only when these 3 conditions are met, a bearish trend is confirmed .
Perfect bearish Change of Character model should include both CHoCH and a bearish trend price action. That will confirm a violation of a bullish trend and start of a new bearish trend.
EURCAD has a very strong potential to continue falling:
not only we see a valid bearish Change of Character but also
a start of a new bearish trend based on a price action.
Next time when you identify CHoCH on forex market, make sure that you check the preceding price action. It will help you to more accurate assess reversal probabilities and make a wiser trading decision.
❤️Please, support my work with like, thank you!❤️
I am part of Trade Nation's Influencer program and receive a monthly fee for using their TradingView charts in my analysis.
Next Week Gold Trend Forecast & Trading TipsDuring this round, the price was sold off sharply from the historical high of 3,500 to 3,120 before rebounding. After consecutive rallies, it faced pressure and fell back to 3,452 due to the fading of market risk aversion. On Friday, it rebounded from a low of 3,340. The daily chart recorded a consolidative bearish candle, with the K-line combination leaning bearish, while the 4H chart showed signs of stopping the decline.
In the short term, it is expected to consolidate below 3,400 next week. For the medium term, attention should be paid to the geopolitical crisis and the Federal Reserve's July interest rate decision. A breakthrough node will be ushered in after confirming the resistance above 3,400.
On the short-term 4-hour chart, the support below is focused around 3,340-45, and the short-term resistance above is around 3,380-85. The key focus is on the suppression at the 3,400-05 level. The overall strategy of going long on pullbacks within this range remains unchanged. For medium-term positions, it is advisable to stay on the sidelines, avoid chasing orders, and patiently wait for entry at key levels.
Investment itself is not the source of risk; it is only when investment behavior escapes rational control that risks lie in wait. In the trading process, always bear in mind that restraining impulsiveness is the primary criterion for success. I share trading signals daily, and all signals have been accurate without error for a full month. Regardless of your past profits or losses, with my assistance, you have the hope to achieve a breakthrough in your investment.

GOLD MARKET ANALYSIS AND COMMENTARY - [Jun 23 - Jun 27]This week, after opening at $3,369/oz, OANDA:XAUUSD prices fluctuated within a fairly narrow range, from only $3,340-$3,374/oz, and closed at $3,368/oz. The fact that gold prices closed this week close to the opening price shows that investors are hesitant in the current context.
The reason why gold prices are still fluctuating within a narrow range this week is because US President Donald Trump gave Iran a 2-week deadline to consider negotiating an end to the conflict with Israel, even though the Israel-Iran conflict is still raging.
In addition, on June 12, the Fed kept interest rates unchanged at 4.25% - 4.5%, while adjusting its forecast for US GDP growth lower and raising its estimate for near-term inflation. Fed Chairman Jerome Powell acknowledged that tariffs would push up prices and weigh on economic activity. Although two rate cuts are expected before the end of the year, Powell said the Fed may wait for more clarity before cutting rates.
Next week, the Fed Chairman will hold two semiannual monetary policy hearings before the US House and Senate committees on Tuesday and Wednesday. If Fed Chairman Powell hints at a rate cut in September 2025, the USD could fall against other major currencies, causing gold prices to rise next week. Conversely, if the Fed Chairman emphasizes that they will continue to prioritize controlling inflation and is in no hurry to cut interest rates, the USD will rise, thereby pushing gold prices down next week.
📌Technically, the gold price on the H4 and D1 charts is stuck between the range of 3295-3450, which is an important support level around 3295, and the resistance level at 3450.
The current price is moving sideways and accumulating in smaller time frames, and the trend has not been clearly defined when it has not broken through the above two resistance levels.
There are two scenarios for gold.
In the long-term framework, if it breaks through the 3450 zone and breaks the trend at the same time, it is expected that the gold price will set a new high.
In the case that the gold price trades below the 3300 round resistance, and at the same time the 3295 support zone is broken, it is easy to form a head and shoulders pattern on the H4 chart.
Notable technical levels are listed below.
Support: 3,350 – 3,320 – 3,300USD
Resistance: 3,371 – 3,400 – 3,435 – 3,500USD
SELL XAUUSD PRICE 3412 - 3410⚡️
↠↠ Stop Loss 3416
BUY XAUUSD PRICE 3294 - 3296⚡️
↠↠ Stop Loss 3290
