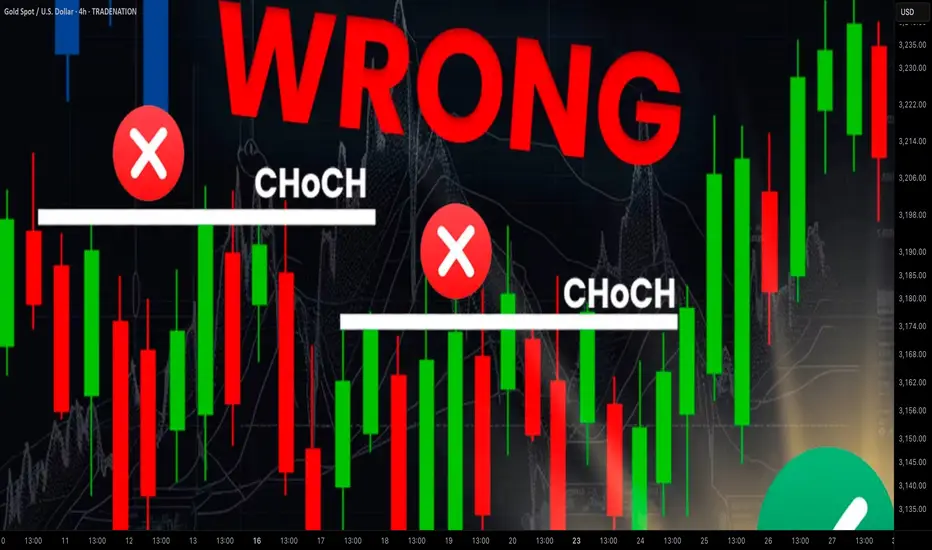
Learn Best Change of Character CHoCH Model in Trading with SMC
Most of the SMC traders get Change of Character CHoCH WRONG!
In this article, I will share with you Change of Character models that have a low accuracy and better to be avoided.
I will teach you the best CHoCH model for Forex Gold trading and show you how to identify it easily.
Let's start with the basic theory first and discuss what Change of Character signifies.
Change of Character in Bearish Trend
In a downtrend, Change of Character CHoCH is an important event that signifies a violation of a bearish trend.
CHoCH is confirmed when the price breaks and closes above the level of the last lower high.
Above, is a text book Change of Character model in a bearish trend.
For the newbie traders, such a price action provides a strong signal to buy while it fact it is NOT .
One crucial thing is missing in this model to confirm a bullish reversal.
According to basic trend analysis rules, we say that the market trend is bullish if the price forms a bullish impulse, retraces and sets a Higher Low HH , forms a new bullish impulse with a new Higher High HH.
Only then, we can say that the market is trading in up trend.
CHoCH model above confirms a bearish trend violation BUT it does not confirm a trend change.
Such a model may easily signify a deeper correction.
Look what happened with GBPNZD.
Though the price formed a confirmed bearish CHoCH, it was a false signal and just an extended correction.
That's a perfect bullish reversal model.
It combines CHoCH and conditions for a bullish trend.
Such a union is extremely accurate in predicting up movements.
Examine a price action on USDJPY.
Not only the price formed a confirmed CHoCH but also we see a start of a new bullish trend.
Change of Character in Bullish Trend
In an uptrend, Change of Character CHoCH is a significant event that signifies a violation of a bullish trend.
CHoCH is confirmed when the price breaks and closes below the level of the last higher low.
Above is a typical model of a bearish CHoCH.
For many traders, that is the signal to open short.
However, it is not that accurate and one important component is missing there.
According to basic price action rules, the market trend is bearish
if the price forms at least 2 bearish impulses with Lower Lows LL and a pullback between them with a Lower High LH.
Only when these 3 conditions are met, a bearish trend is confirmed .
Perfect bearish Change of Character model should include both CHoCH and a bearish trend price action. That will confirm a violation of a bullish trend and start of a new bearish trend.
EURCAD has a very strong potential to continue falling:
not only we see a valid bearish Change of Character but also
a start of a new bearish trend based on a price action.
Next time when you identify CHoCH on forex market, make sure that you check the preceding price action. It will help you to more accurate assess reversal probabilities and make a wiser trading decision.
❤️Please, support my work with like, thank you!❤️
I am part of Trade Nation's Influencer program and receive a monthly fee for using their TradingView charts in my analysis.
GOLDMINICFD trade ideas
GOLD → Hunting for liquidity before continued growthFX:XAUUSD has been correcting since the start of the session. The fundamental background is complicated due to the escalation of the conflict in the Middle East.
The price of gold briefly retreated from a two-month high above $3,450 amid a recovery in the dollar and investor caution. Escalating tensions between Israel and Iran are dampening risk appetite, while markets await decisions from the Fed and the Bank of Japan. Expectations of a dovish Fed continue to support interest in gold, but fresh impetus is needed for further gains.
Technically, the market is bullish. Gold is forming a correction to the key support and liquidity zone amid an uptrend. The price is within the range, and a retest of 3400 could trigger growth.
Support levels: 3408, 3400
Resistance levels: 3446, 3500
A retest of support and liquidity capture amid the current challenging situation (high interest in the metal) and a bullish trend could support the price, allowing gold to continue its growth.
Best regards, R. Linda!

Best Free Volatility Indicator on TradingView for Gold Forex
This free technical indicator will help you easily measure the market volatility on Forex, Gold or any other market.
It will show you when the market is quiet , when it's active and when it's dangerous .
We will go through the settings of this indicator, and you will learn how to set it up on TradingView.
Historical Volatility Indicator
This technical indicator is called Historical Volatility.
It is absolutely free and available on TradingView, MetaTrader 4/5 and other popular trading terminals.
TradingView Setup
Let me show you how to find it on TradingView and add it to your price chart.
Open a technical price chart on TradingView and open the "Indicators" menu (you will find it at the top of the screen).
Search "Historical Volatility" and click on it.
It will automatically appear on your chart.
"Length" parameter will define how many candles the indicator will take for measuring the average volatility. (I recommend keeping the default number, but if you need longer/shorter-term volatility, you can play with that)
Timeframe drop-down list defines what time frame the indicator takes for measuring the volatility. (I recommend choosing a daily timeframe)
And keep the checkboxes unchanged .
How to Use the Indicator
Now, let me show you how to use it properly.
Wider the indicator and analyse its movement at least for the last 4 months.
Find the volatility range - its low levels will be based on the lower boundary of the range, high levels will be based on its upper boundary.
This is an example of such a range on USDCAD pair.
When the volatility stays within the range, it is your safe time to trade.
When volatility approaches its lows, it may indicate that the market might be slow .
Highs of the range imply that the market is very active
In-between will mean a healthy market.
The Extremes
The violation of a volatility range to the downside is the signal that the market is very slow . This would be the recommended period to not trade because of high chance of occurrence of fakeouts.
An upward breakout of a voliatlity range is the signal of the extreme volatility . It will signify that the market is unstable , and it will be better to let it calm down before placing any trade.
Volatility Analysis
That is how a complete volatility analysis should look.
At the moment, volatility reached extreme levels on CADJPY pair.
The best strategy will be to wait till it returns within the range.
Remember This
With the current geopolitical uncertainty and trade wars, market volatility reaches the extreme levels.
Such a volatility is very dangerous , especially for newbie traders.
Historical volatility technical indicator will help you to easily spot the best period for trading and the moment when it is better to stay away.
❤️Please, support my work with like, thank you!❤️
I am part of Trade Nation's Influencer program and receive a monthly fee for using their TradingView charts in my analysis.

Next Week Gold Trend Forecast & Trading TipsDuring this round, the price was sold off sharply from the historical high of 3,500 to 3,120 before rebounding. After consecutive rallies, it faced pressure and fell back to 3,452 due to the fading of market risk aversion. On Friday, it rebounded from a low of 3,340. The daily chart recorded a consolidative bearish candle, with the K-line combination leaning bearish, while the 4H chart showed signs of stopping the decline.
In the short term, it is expected to consolidate below 3,400 next week. For the medium term, attention should be paid to the geopolitical crisis and the Federal Reserve's July interest rate decision. A breakthrough node will be ushered in after confirming the resistance above 3,400.
On the short-term 4-hour chart, the support below is focused around 3,340-45, and the short-term resistance above is around 3,380-85. The key focus is on the suppression at the 3,400-05 level. The overall strategy of going long on pullbacks within this range remains unchanged. For medium-term positions, it is advisable to stay on the sidelines, avoid chasing orders, and patiently wait for entry at key levels.
Investment itself is not the source of risk; it is only when investment behavior escapes rational control that risks lie in wait. In the trading process, always bear in mind that restraining impulsiveness is the primary criterion for success. I share trading signals daily, and all signals have been accurate without error for a full month. Regardless of your past profits or losses, with my assistance, you have the hope to achieve a breakthrough in your investment.

GOLD MARKET ANALYSIS AND COMMENTARY - [Jun 23 - Jun 27]This week, after opening at $3,369/oz, OANDA:XAUUSD prices fluctuated within a fairly narrow range, from only $3,340-$3,374/oz, and closed at $3,368/oz. The fact that gold prices closed this week close to the opening price shows that investors are hesitant in the current context.
The reason why gold prices are still fluctuating within a narrow range this week is because US President Donald Trump gave Iran a 2-week deadline to consider negotiating an end to the conflict with Israel, even though the Israel-Iran conflict is still raging.
In addition, on June 12, the Fed kept interest rates unchanged at 4.25% - 4.5%, while adjusting its forecast for US GDP growth lower and raising its estimate for near-term inflation. Fed Chairman Jerome Powell acknowledged that tariffs would push up prices and weigh on economic activity. Although two rate cuts are expected before the end of the year, Powell said the Fed may wait for more clarity before cutting rates.
Next week, the Fed Chairman will hold two semiannual monetary policy hearings before the US House and Senate committees on Tuesday and Wednesday. If Fed Chairman Powell hints at a rate cut in September 2025, the USD could fall against other major currencies, causing gold prices to rise next week. Conversely, if the Fed Chairman emphasizes that they will continue to prioritize controlling inflation and is in no hurry to cut interest rates, the USD will rise, thereby pushing gold prices down next week.
📌Technically, the gold price on the H4 and D1 charts is stuck between the range of 3295-3450, which is an important support level around 3295, and the resistance level at 3450.
The current price is moving sideways and accumulating in smaller time frames, and the trend has not been clearly defined when it has not broken through the above two resistance levels.
There are two scenarios for gold.
In the long-term framework, if it breaks through the 3450 zone and breaks the trend at the same time, it is expected that the gold price will set a new high.
In the case that the gold price trades below the 3300 round resistance, and at the same time the 3295 support zone is broken, it is easy to form a head and shoulders pattern on the H4 chart.
Notable technical levels are listed below.
Support: 3,350 – 3,320 – 3,300USD
Resistance: 3,371 – 3,400 – 3,435 – 3,500USD
SELL XAUUSD PRICE 3412 - 3410⚡️
↠↠ Stop Loss 3416
BUY XAUUSD PRICE 3294 - 3296⚡️
↠↠ Stop Loss 3290

6.27 Gold rebounds and adjusts, don't chase shorts at low levelsGold fell below this week's low of 3295 today. As of now, gold has hit 3285 and is fluctuating. Don't chase the short position and short it when it rebounds. Now you can only wait patiently for the rebound before entering the short position. Be a steady hunter and wait patiently for the appearance of prey!
Gold is now focusing on the short-term suppression of the upper 3301-3306 line, focusing on the suppression of the upper 3314-16 line, and the support below is 3276-80. Short it when it rebounds.
Strategy ideas:
1. Gold rebounds to 3301-3306 line and shorts lightly, rebounds to 3314-16 line to cover short position, stop loss 3324, target 3280-85 line;

Gold Trade Plan 26/06/2025Dear Traders,
Price Still Range 3310-3350 ( Channel movement)
i expect price will be start Correction to 3330-3320 and its time of Correction of DXY,
Regards,
Alireza

Hanzo / Gold 15 min - ( most accurate Reversals Levels ) 🔥 Gold – 15 Min Scalping Analysis
⚡️ Objective: Precision Reversal Execution
Time Frame: 15 -Minute Warfare
Entry Mode: Only after verified Reversals
👌Bullish Reversal : 3333
Price must break liquidity with high volume to confirm the move.
👌Bearish Reversal : 3346
Price must break liquidity with high volume to confirm the move.
👌Bearish Reversal : 3396
Price must break liquidity with high volume to confirm the move.
☄️ Hanzo Protocol: Dual-Direction Entry Intel
➕ Zone Activated: Strategic liquidity layer detected — mapped through refined supply/demand mechanics. Volatility now rising. This isn’t noise — this is bait for the untrained. We're not them.
🦸♂️ Tactical Note:
The kill shot only comes after the trap is exposed and volume betrays their position.
5
Hanzo / Gold 15 min - most accurate Reversals ( Zones )

Potential bullish rise?The Gold (XAU/USD) is reacting off the pivot and could rise to the 1st resistance.
Pivot: 3,334.86
1st Support: 3,315.22
1st Resistance: 3,356.66
Risk Warning:
Trading Forex and CFDs carries a high level of risk to your capital and you should only trade with money you can afford to lose. Trading Forex and CFDs may not be suitable for all investors, so please ensure that you fully understand the risks involved and seek independent advice if necessary.
Disclaimer:
The above opinions given constitute general market commentary, and do not constitute the opinion or advice of IC Markets or any form of personal or investment advice.
Any opinions, news, research, analyses, prices, other information, or links to third-party sites contained on this website are provided on an "as-is" basis, are intended only to be informative, is not an advice nor a recommendation, nor research, or a record of our trading prices, or an offer of, or solicitation for a transaction in any financial instrument and thus should not be treated as such. The information provided does not involve any specific investment objectives, financial situation and needs of any specific person who may receive it. Please be aware, that past performance is not a reliable indicator of future performance and/or results. Past Performance or Forward-looking scenarios based upon the reasonable beliefs of the third-party provider are not a guarantee of future performance. Actual results may differ materially from those anticipated in forward-looking or past performance statements. IC Markets makes no representation or warranty and assumes no liability as to the accuracy or completeness of the information provided, nor any loss arising from any investment based on a recommendation, forecast or any information supplied by any third-party.

Confirming only the 4th capital rotation into gold in history?We're on the verge of confirming only the 4th capital rotation into gold in history.
What follows? Multi-year bull eras in silver, uranium, copper, oil & friends.
But there's a catch: the missing ingredient is a stock market bear...

Today's gold trading strategy, I hope it will be helpful to you Influencing Factors on Gold Prices:
- Geopolitical Factors:
Trump announced a comprehensive ceasefire between Israel and Iran, which will greatly ease tensions in the Middle East. The market's safe-haven demand triggered by the Israel-Iran conflict will drop significantly, and investors' safe-haven buying of gold will correspondingly decrease, thus exerting downward pressure on gold prices. Historical experience shows that when there was an expectation of a ceasefire agreement between Israel and Hezbollah in Lebanon, gold prices once fell significantly due to the reduction in safe-haven demand.
- Market Expectation Factors:
Although Fed Governor Bowman hinted at a possible rate cut in July, which is positive for gold, the impact of the ceasefire news may be more direct and significant. Currently, market expectations for a Fed rate cut remain uncertain—CME data shows the probability of a rate cut in July is only 8.3%. In this context, the cooling of risk aversion triggered by the ceasefire may temporarily dominate the trend of gold prices, causing gold to face correcton pressure.
- Technical Aspects:
Before the ceasefire news emerged, gold prices fluctuated in the range of $3,350-$3,395, with $3,350 providing certain support and $3,400 serving as the upper resistance level. It is expected that after the ceasefire news is announced, gold prices may test the support at $3,350. If the support fails, they may further fall to around $3,300.
Today's gold trading strategy, I hope it will be helpful to you
XAUUSD sell@3365~3355
SL:3380
TP:3345~3330

XAU/USD: The truth may be late, but it will never be absent.Trump tweeted late at night that a ceasefire had been reached between Israel and Iran, causing gold and crude oil prices to crash straight away.
So far, neither side has officially announced the ceasefire, and new explosions continue to be reported, with the situation likely to reverse at any moment. Market sentiment runs faster than the truth, but the truth will catch up sooner or later.
Key Focus Points:
1.Monitor the authenticity of the ceasefire
2.Track Fed dynamics: If the Fed hints at rate cuts under pressure, the bullish logic for gold will remain intact.
XAUUSD
sell@3365-3375
tp:3340-3330
buy@3330-3340
tp:3360-3370
I am committed to sharing trading signals every day. Among them, real-time signals will be flexibly pushed according to market dynamics. All the signals sent out last week accurately matched the market trends, helping numerous traders achieve substantial profits. Regardless of your previous investment performance, I believe that with the support of my professional strategies and timely signals, I will surely be able to assist you in breaking through investment bottlenecks and achieving new breakthroughs in the trading field.

XAUUSD Ready bounce back?XAUUSD 3295.00 is an important weekly and daily key level price has just bounced back from the key level with double bottom formation. It is possible for the price to continue to bounce back to daily resistance level?
While was in down trend price has left significant imbalance in the market showing possible uptrend with the filling of FVG.
A buy trade with strong liquidity grab is high probable.

GOLD 1. Final GDP q/q
Actual: -0.5%
Forecast: -0.2%
Previous: -0.2%
The US economy contracted by 0.5% in the first quarter, worse than the expected 0.2% decline, indicating a sharper slowdown than anticipated.
2. Unemployment Claims (Week ending June 21)
Initial Claims: 236,000
Forecast: 244,000
Previous: 245,000
Initial jobless claims fell by 10,000 to 236,000, lower than forecast and near historically low levels, suggesting that layoffs remain relatively subdued despite economic challenges.
Context:
Despite the drop in new claims, continuing claims (people receiving ongoing benefits) rose to about 1.97 million, the highest since November 2021, indicating some softening in the labor market. Economists expect the unemployment rate to edge up slightly to around 4.3% in June from 4.2% in May.
3. Core Durable Goods Orders m/m (May 2025)
Actual: +0.5%
Forecast: +0.1%
Previous: +0.2%
Core durable goods orders, which exclude transportation, rose 0.5% month-over-month, beating expectations and signaling some resilience in business investment.
4. Durable Goods Orders m/m (May 2025)
Actual: +16.4%
Forecast: +8.6%
Previous: -6.3%
Total durable goods orders surged 16.4%, a strong rebound following a prior decline, indicating a pickup in demand for long-lasting manufactured goods.
5. Final GDP Price Index q/q (Q1 2025)
Actual: 3.7%
This measure of inflation in the GDP deflator remains elevated, reflecting persistent price pressures in the economy.
Summary of Market Implications:
The larger-than-expected GDP contraction signals economic weakness, which could increase expectations for accommodative Fed policy.
The drop in initial jobless claims supports the view that layoffs are limited, but rising continuing claims suggest some labor market softness ahead.
Strong durable goods orders point to underlying business investment strength, providing a mixed but cautiously optimistic outlook.
Elevated inflation as shown by the GDP price index keeps inflation concerns alive.
Overall, the data presents a complex picture of a slowing economy with pockets of resilience and ongoing inflationary pressure.
#GOLD

Gold Holds the Line – Will It Break Above $3,500?Gold continues to maintain its long-term uptrend after a technical pullback toward dynamic support around $3,325, aligning with both the EMA34 and the rising trendline.
If price rebounds from this zone and breaks above the key resistance between $3,460 and $3,500, a strong rally toward $3,600 could unfold in the medium term.
However, upcoming U.S. economic data—including GDP and the Fed’s preferred inflation gauge, Core PCE—will be critical in determining whether gold has the momentum for a breakout or remains in consolidation.
Are you holding gold, or waiting on the sidelines?

Gold at 3330… I’ll take that bet.Price tapped into demand with multiple rejections.
Targeting 3,330. Clean setup, clear risk. Let’s see if the bulls got something left.

Excellent session yesterdayAs discussed throughout my yesterday’s session commentary:” My position: Besides all Fundamental factors / escalation, Gold isn't soaring as one could expect. Therefore I will continue Scalping #3,352.80 - #3,377.80 Neutral belt and will Trade the break-out. #3,352 towards #3,327.80 or #3,377.80 to the upside however with DX rising, I give more probabilities to the downside.“
I have firstly engaged many Scalping orders from #3,377.80 - #3,382.80 Scalp re-Buy zone towards #3,392.80 and closed all with Profit. Then late U.S. session delivered #3,352.80 benchmark test which I re-Bought in repetition and closed my Scalp orders on #3,358.80 - #62 belt. Also my Selling Swing projection was delivered (#3,327.80 test).
Technical analysis: Gold is taking strong Intra-day hits in form of Three Black Crows candlestick formation and most likely Selling sequence is not stopping here. The Hourly 4 chart’s Resistance cluster has rejected the Price-action twice already which gives a updated Targets with a potential extension towards #3,200.90 psychological benchmark if #3,322.80 - #3,327.80 Support zone gives away. Only if #3,352.80?mark breaks to the upside and market closes (especially Weekly (#1W) closing) above, I will contemplate Buying the market as at the moment / Hourly 1 chart’s reveals no clues nor configuration is not worth entering / only Sell orders both Scalp / Swing are suitable. I don't expect today’s session Fundamental reports to be relevant, as I await Support extension test (Selling on every local High’s) due ceasefire talks / deal.
My position: I will Sell every High’s on Gold especially if #3,352.80 benchmark is not recovered waiting for #3,300.80 benchmark test.

Gold is showing potential signs of a bullish reversalGold is showing potential signs of a bullish reversal after a prolonged bearish trend. The price recently rejected strongly from a key resistance level, triggering a sharp internal liquidity sweep followed by a fast downside move. This indicates that smart money may have cleared out weak hands.
Resistance zone 3335 / 3360
Support zone 3300 / 3285
Currently, the market appears to be compressing, forming a potential bullish structure. If this consolidation holds and breaks to the upside, it may confirm the beginning of a bullish leg.
You may find more details in the chart Ps Support with like and comments for more analysis/

Wait for the key points to be confirmed before taking actionThe trend of gold on Friday is still in line with my analysis. Before the market opened, I suggested that gold would rebound from the bottom. Considering the resistance level, I would arrange short orders with a light position. I clearly emphasized that I should not chase short orders at low levels. The actual market price fluctuated upward after hitting the 3340 line at the lowest point, and maintained a range-bound fluctuation pattern as a whole. We arranged long orders in batches at 3342-3353, successfully stopped profit near 3358, reversed shorting, and stopped profit again at 3342. After that, the market hit the top again and was blocked. Short orders were arranged at 3370-3375. It is not recommended to hold positions over the weekend. I have already left the market with a small profit near 3365. Although there was no significant breakthrough, all ended with profit, but it was quite satisfactory for Friday's market.
News: Gold prices were stable on Friday, but fell 1.8% this week. It closed at 3368. The latest Federal Open Market Committee (FOMC) statement reinforced the Fed's cautious stance, keeping interest rates in the 4.25%-4.50% range. However, the statement also lowered the number of expected rate cuts this year, which put downward pressure on gold prices. In addition, U.S. Treasury yields did not change much but rose slightly, reflecting the stabilization of market risk sentiment. The 10-year Treasury yield rose by more than 2 basis points to 4.421%, and the 30-year Treasury yield rose to 4.924%. Rising yields often put pressure on non-yielding assets such as gold, further suppressing the upward momentum of gold prices. The Fed's failure to immediately launch an easing policy, coupled with a stronger dollar and a reduced urgency of geopolitical risks, have all exacerbated selling pressure. Unless tensions escalate again or the Fed unexpectedly turns, short-term gold price forecasts point to further weakening.
The price of gold has rebounded since it fell from its historical high of 3500 to 3120, After continuous rise, due to the decline of risk aversion in the market, it fell under pressure at 3452. It rebounded to 3340 on Friday. The K-line combination arrangement was bearish. The 4H chart showed a stop-loss signal. It is expected that the market will consolidate below 3400 in the short term. In the medium term, attention should be paid to the geopolitical crisis and the July interest rate decision of the Federal Reserve. It will break through the node after confirming the upper resistance of 3400. In the short-term 4-hour chart, the lower support is around 3340-3345, and the upper short-term resistance is around 3380-3385. Focus on the suppression of the 3400-05 line. The overall idea of retracing back to long positions remains unchanged, and the middle area is mainly kept on the sidelines. Be cautious in chasing orders and wait patiently for the key points to be confirmed before intervening. If the upper resistance is not broken, you can still consider light positions to arrange short orders, and pay attention to the bottom for the specific entry point.

XAUUSD Broken from ascending channel with big bearish candle📉 XAUUSD (Gold) Technical Breakdown – 1H Time Frame
Gold has broken down from the hourly bullish channel and is showing strong selling pressure.
💥 Sell Entry: 3365
🎯 Targets:
1️⃣ 3345
2️⃣ 3323
3️⃣ 3295
Bearish momentum is building—watch these levels closely for potential moves.
📊 Like, Follow, and Comment 💬
🚀 Join us for more live trade ideas and updates!
By Livia 😜

The Direction After Sideways Fluctuation at 3330Trump's announcement of an Israel-Iran ceasefire dented safe-haven sentiment, curbing safe-haven buying 🛑. Gold opened with a sharp plunge, then extended losses as Powell later stated that more time is needed before considering rate cuts—dovish expectations eased, sending gold further lower ⬇️. The price briefly fell below the 3,300 level, nearing 3,295 at its lowest, but failed to breach the 3,290-3,300 support zone 📊. As I indicated yesterday, traders could test rebound strength near support; once news impacts faded, gold rebounded to close at 3,323 🔄.
Currently trading sideways around 3,330, gold faces resistance at 3,350 while downside support remains at 3,290-3,300 📈📉. We therefore maintain a bearish stance
⚡️⚡️⚡️ XAUUSD ⚡️⚡️⚡️
🚀 Sell@3345 - 3335
🚀 TP 3325 - 3315 - 3305
Accurate signals are updated every day 📈 If you encounter any problems during trading, these signals can serve as your reliable guide 🧭 Feel free to refer to them! I sincerely hope they'll be of great help to you 🌟 👇

Gold price PMI positive, slight increase⭐️GOLDEN INFORMATION:
Gold prices (XAU/USD) edge higher toward $3,375 in early Asian trading on Monday, driven by heightened geopolitical tensions following US President Donald Trump’s decision to intervene militarily in the Israel-Iran conflict. The move significantly escalates the situation in the Middle East, fueling demand for safe-haven assets like gold.
The US launched airstrikes on three Iranian nuclear facilities early Sunday, marking a direct entry into the conflict despite Trump’s prior pledges to avoid new overseas wars. The intensifying turmoil has sparked a wave of risk aversion, supporting bullion prices amid rising uncertainty. Meanwhile, investors will closely monitor the preliminary S&P Global US Purchasing Managers’ Index (PMI) for June, due later in the day, for further market direction.
⭐️Personal comments NOVA:
Gold prices continue to be supported around the 3340 mark, positive with today's US PMI news data
⭐️SET UP GOLD PRICE:
🔥SELL GOLD zone: 3380- 3382 SL 3387
TP1: $3370
TP2: $3360
TP3: $3350
🔥BUY GOLD zone: $3318-$3316 SL $3311
TP1: $3326
TP2: $3338
TP3: $3349
⭐️Technical analysis:
Based on technical indicators EMA 34, EMA89 and support resistance areas to set up a reasonable BUY order.
⭐️NOTE:
Note: Nova wishes traders to manage their capital well
- take the number of lots that match your capital
- Takeprofit equal to 4-6% of capital account
- Stoplose equal to 2-3% of capital account

DeGRAM | GOLD bullish takeover from support📊 Technical Analysis
● The XAUUSD 4-hour chart, as shown in the upper right corner, presents a clear bullish structure within a well-defined rising channel. Price action has consistently respected both the lower and upper boundaries of this channel, with multiple bounces off support levels reinforcing the trend. Recently, the chart highlights a “bullish takeover” after a brief pullback, where price found support at 3,345.47 and quickly reclaimed ground above the channel’s median. The forecasted path, illustrated by the projected arrows, suggests a continuation toward the resistance zone at 3,431.14, with the channel’s upper boundary acting as a dynamic target. The presence of higher lows and the swift recovery from the latest dip further confirm the underlying bullish momentum.
● The technical setup is strengthened by the clear identification of support and resistance levels. The 3,293.50 area has repeatedly served as a strong base, while the 3,431.14 level is marked as the next significant resistance. The rising channel itself provides a visual framework for the ongoing uptrend, and the recent bullish engulfing pattern at support signals renewed buying interest. The chart’s structure, with its clean trendlines and labeled zones, points to a high-probability scenario for further gains as long as price remains within the channel.
💡 Fundamental Analysis
● Recent fundamentals support the technical case for continued upside in gold. As of June 22-23, 2025, gold is trading near 3,364, with market sentiment buoyed by ongoing geopolitical tensions in the Middle East and persistent global economic uncertainty. While Citi has revised its long-term gold forecasts downward, Bank of America maintains a bullish outlook, citing safe-haven demand amid US military actions and inflation concerns. Additionally, the latest data shows that gold remains above key moving averages, and the Relative Strength Index (RSI) is holding near neutral, suggesting room for further upside. The combination of technical resilience and supportive macro factors continues to attract buyers to gold as a hedge against volatility.
✨ Summary
● XAUUSD is poised for a move toward 3,431.14, with the rising channel and recent bullish takeover pattern supporting the case for further gains. The bullish scenario remains valid as long as price holds above 3,345.47, with 3,293.50 serving as a critical support. A sustained break above resistance could open the path to new highs, while a drop below channel support would warrant a reassessment of the trend.
-------------------
Share your opinion in the comments and support the idea with a like. Thanks for your support!
