GOLD 2 Best Places For Sell Very Clear , Don`t Miss 300 Pips !Here is my opinion on Gold at the moment after the price moved very hard to downside as i mentioned in the last update , now we have a very good 2 places to sell it again , the first one @ 3326.00 , it`s a very good place to sell it cuz it was a very good support and the price break it and now it will play as a good res so we can sell from it , and if the price go higher we can sell from area between 3350 : 3345.00 , it will be a great place to sell it also , and if the highest place who force the price to downside we can add another sell entry from 3326.00 if we have a daily closure below it .
GOLDMINICFD trade ideas

GOLD The US 10-year Treasury yield is approximately 4.29%-4.37%
The US Dollar Index (DXY) is trading near 97.877, showing relative stability with minor fluctuations
Impact on Markets Today
The slight decline in the 10-year yield suggests modest easing of bond market pressure, possibly reflecting cautious investor sentiment amid ongoing fiscal concerns and expectations of Fed rate cuts later this year.
The DXY near 97.9 indicates a moderately strong dollar, though recent trends show some weakening due to fiscal worries and softer economic data.
Together, a stable-to-slightly weaker dollar and a modestly lower 10-year yield can support safe-haven assets like gold, though elevated yields still pose a headwind. But despite the dips of both the 10 year us government bond yield and the dollar index ,GOLD lost over 500pips from Asian session to Newyork session trading on cease fire deal between Israel and Iran by united states of America.
In brief: The US 10-year yield’s slight dip combined with a steady DXY reflects a market balancing inflation, fiscal concerns, and Fed policy outlook. This environment supports cautious risk-taking with safe-haven demand still relevant.
follow zone of buy and sell for educational purpose only.
#gold #dollar

Gold BuysH4 structure we are bullish, M15 we chOch and wait for pullback then continue with buys. With the iraq wars, investors are looking for a save haven and saving their cash in gold. We are bullish for the week
Today's gold trading strategy, I hope it will be helpful to you Investment Opportunities Amid Geopolitical Risks and Recession Expectations
I. Fundamental Support: Persistent Geopolitical Risks and Escalating Recession Expectations
Middle East Situation: Potential Risks Not Fully Priced
Although Iran's threat to block the Strait of Hormuz has not yet translated into actual action, its strategic value as an "ultimate deterrent" has been partially recognized by the market. Historical data shows that during Iran's two blockade threats in 2011 and 2018, gold rose by an average of 8.7%. However, the current price range of $3,380-$3,400 only reflects the direct impact of the Israeli airstrikes on the 14th, and has not fully incorporated the risk premium for potential retaliatory actions by Iran. Once "quasi-actions" such as tanker seizures or partial strait blockades occur, gold prices may quickly break through $3,450.
Fed Policy: Dual Drivers of Rate Cut Expectations and Economic Weakness
Although the Fed kept rates unchanged at its June meeting, the dot plot showed that 7 out of 19 committee members expected "zero rate cuts" for the whole year, conflicting with the market's 61.7% probability of a rate cut in September. The essence of this divergence is the game between "high tariff inflation pressures" and "economic slowdown"—when the median GDP forecast is revised down from 1.7% to 1.4%, and the Atlanta Fed model predicts that Q1 growth may turn negative, the long-term trend of declining real interest rates remains unchanged, and gold's "recession-resistant" attribute will gradually emerge.
Correlation Effect Between Crude Oil and Gold
Currently, WTI crude oil maintains a 3.7% gain, and Brent crude fluctuates around $76/barrel. Tensions in the energy market provide indirect support for gold. Historical data shows that when crude oil rises by more than 5% in a week, gold has a 72% probability of rising simultaneously, as both share the logic of "geopolitical risk premium". If Iran takes subsequent actions against oil tankers, the two assets may experience a resonant rally.
Today's gold trading strategy, I hope it will be helpful to you
XAUUSD buy@3365~3375
SL:3350
TP:3385~3395

XAUUSD: Trend changed to bearish. Significant downside potentialGold turned neutral again on its 1D technical outlook (RSI = 49.253, MACD = 18.142, ADX = 16.679) as it crossed below both the 4H MA200 and 1D MA50. The two form a Bearish Cross. Technically a Channel Down has emerged, no different than those that emerged after rejections on the R1 Zone (like now). As long as the 4H MA50 acts as a Resistance and holds, we will be bearish, aiming at the S1 level (TP = 3,245).
## If you like our free content follow our profile to get more daily ideas. ##
## Comments and likes are greatly appreciated. ##

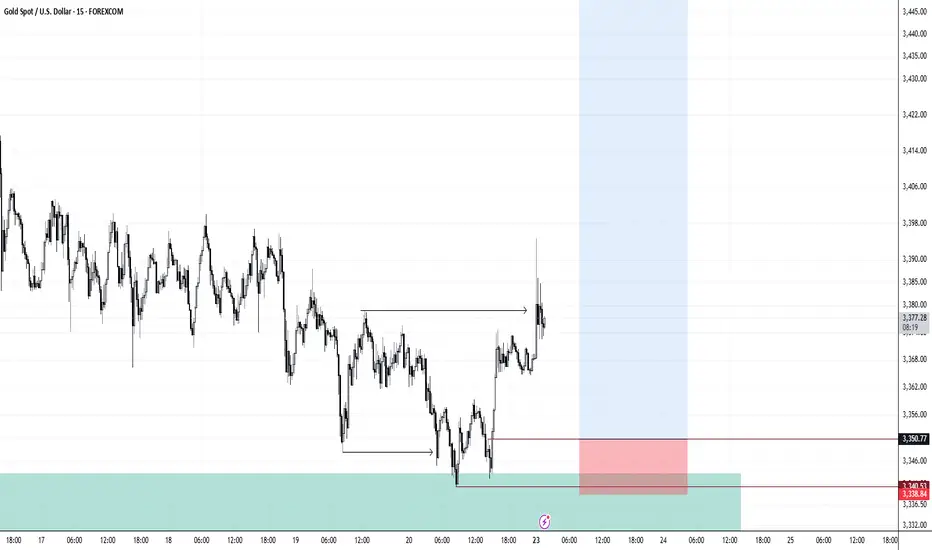
Excellent Scalp opportunities As discussed throughout my yesterday’s session commentary: “My position: I assume no new orders as I will await where Gold will turn next / reveal major move. Either #3,327.80 - #3,332.80 break-out towards #3,352.80 benchmark or big Sell towards #3,300.80 benchmark first, then if #3,292.80 gives away, #3,252.80 benchmark. Trade accordingly.”
I have engaged firstly #3,328.80 aggressive Scalp Sell order and closed it on #3,316.80. As I expected DX to touch #52-Week Low’s, I Bought Gold multiple times first from #3,314.80 twice towards #3,319.80 and #3,321.80, also had Swing order (Lower Volume order) on #3,312.80 which was closed on #3,324.80 as I was confident that Gold will stage relief rally due DX taking strong hits. Another excellent session.
Technical analysis: The Price-action is basically consolidating again on Hourly 1 chart back within well known range of #3,322.80 - #3,327.80 - #3,342.80 giving Scalpers excellent opportunities for Intra-day Profit as Scalpers are getting most of the returns of current Price-action. Hourly 1 chart is an healthy Ascending Channel already and as weekend break is approaching I may be getting a break-out (the pattern usually breaks to the upside). I am currently on the sidelines, earlier simply holding whatever I have Bought Lower and Sold Higher. I need to state for the record (again) that when I mention pull backs on my analysis I am not suggesting Traders to Short right away, always await my confirmation. We are on a overall Bull market and I have stated since the start of the Year that my strategy is to be Buying (and accumulating) on pull-backs. Those who've been following me for Years are well aware that there was a time for Shorting back when Gold was below #2,000.80 benchmark. Keep in mind that I anticipated that DX could test #52-Week Low’s (currently delivered) and that’s why I have aggressively Bought Gold yesterday.
My position: Gold is Trading on relief rally and it is now whether #3,352.80 benchmark will break to the upside and extend the relief rally or reversal there and another decline. I personally lean more to the Bullish side with DX chart as main pointer for Gold on current session.

3333 Gold SellSell gold here at 3333, targeting 3303 and below. Bearish flag on display signaling a possible continuation of the strong bearish momentum since ceasefire was announced.

Gold: Resistance Validated, Short at 3340-3350 Tomorrow📈 Gold Trading Recap & Tomorrow's Strategy: Resistance Holds, Short Opportunities Persist
💎 Today's newly updated live short strategy hit the TP target successfully! As mentioned earlier, when gold failed to break the support level, we anticipated it to range around 3330—today's trades were precisely centered on this logic. The 3350 resistance was also validated firmly during the session.
💎 Expect further upside in tomorrow's Asian session—recommend continuing short positions within the 3340-3350 range 🚀
🚀 Sell@3350 - 3345
🚀 TP 3335 - 3325 - 3315
Accurate signals are updated every day 📈 If you encounter any problems during trading, these signals can serve as your reliable guide 🧭 Feel free to refer to them! I sincerely hope they'll be of great help to you 🌟 👇

#3,300.80 tested as expectedAs discussed throughout my yesterday's session commentary: "My position: I will Sell every High’s on Gold especially if #3,352.80 benchmark is not recovered waiting for #3,300.80 benchmark test."
I have announced #3,300.80 test throughout yesterday's session commentary with engaging excellent Selling orders (mostly aggressive Scalps) until #3,300.80 benchmark isn't achieved.
Technical analysis: Strong rejection from late yesterday's session local High’s on increased Volume indicating that Sellers are strongly positioned at that mark, which is Technically the Support fractal on the neckline of former Bullish structure / pattern over Neutral High’s / Low’s. However a strong Support presence is seen at current #3,292.80 - #3,302.80 levels where Gold rebounded on an Hourly 4 chart’s Doji Star Bullish reversal candle many times in near past. This decline is temporarily confusing the patterns but with a new Higher Low’s and as long as the Lower Low’s Upper zone stays intact, I will regardless remain Bearish awaiting retracement to test #3,300.80 psychological benchmark once again. One must be fast to adapt on market changes which are the case lately in order not to hold worthless positions. Bond Yields however climbed to fresh Annual High’s above (# +4.5%) while DX is following the sequence on parabolic downtrend delivering #3-session Selling spree on Gold. Price-action remains contained near Hourly 1 chart's #3,327.80 as my main point of interest.
My position: I assume no new orders as I will await where Gold will turn next / reveal major move. Either #3,327.80 - #3,332.80 break-out towards #3,352.80 benchmark or big Sell towards #3,300.80 benchmark first, then if #3,292.80 gives away, #3,252.80 benchmark. Trade accordingly.

GOLD BUY BIAS • Demand Zone (Grey Box):
Price tapped into a clear demand/support zone around 3300–3310, showing rejection wicks and slowing bearish momentum.
• Reversal Expectation:
Bullish projection drawn on the chart suggests a potential rally if price holds above this zone.
• Upside Targets:
• First target: ~3390 (previous structure high)
• Next: ~3410–3440 (liquidity sweep area)

GOLD - Near to CUT n REVERSE Area? What's next??#GOLD... market placed a very reasonable high that is around 3338-39 around
Keep close that area because if market holds then drop expected otherwise not..
Note: we will go for cut n reverse above 3338-39 on confirmation.
Good luck
Trade wisely

Confirming only the 4th capital rotation into gold in history?We're on the verge of confirming only the 4th capital rotation into gold in history.
What follows? Multi-year bull eras in silver, uranium, copper, oil & friends.
But there's a catch: the missing ingredient is a stock market bear...

XAUUSD Broken from ascending channel with big bearish candle📉 XAUUSD (Gold) Technical Breakdown – 1H Time Frame
Gold has broken down from the hourly bullish channel and is showing strong selling pressure.
💥 Sell Entry: 3365
🎯 Targets:
1️⃣ 3345
2️⃣ 3323
3️⃣ 3295
Bearish momentum is building—watch these levels closely for potential moves.
📊 Like, Follow, and Comment 💬
🚀 Join us for more live trade ideas and updates!
By Livia 😜

XAUUSD: Accumulation in process,Waiting for Bullish DistributionHello,
Today, we will analyse the key points of each significant move.
Following the price’s all-time high at $3500, it experienced a sharp decline and failed to maintain that level. A substantial 2400 pips would have resulted in significant losses for many accounts. Initially, it was perceived as a minor correction, with the expectation of further price appreciation. However, this assumption proved incorrect. After reaching an even higher peak, the price invariably undergoes a more substantial correction.
At 3260, substantial bullish volume surged into the market, necessitated by the presence of a fair value gap. Subsequently, the price experienced a decline, reflecting the prevailing bearish trend, which favoured the bears. However, at 3200, a pivotal level representing a discounted price point, bull volume surged. This powerful bullish impulse propelled the price to 3432, ultimately confirming the bullish trend. AB=CD there recurring pattern emerged weekly. When the price reached the 3432 level as a fair value gap, the CD pattern commenced.
AB=CDTheHeyIndeed, we have identified a recurring pattern. It appears to be an equal move in any direction, and it has manifested precisely as anticipated. We were aware that the price would reject at 3120, and it did so accordingly. Currently, the market is in our favour. Upon market opening, it exhibited a positive gap, propelling the price to 3450. However, it subsequently declined, reaching 3384.
Presently, we find ourselves in the accumulation phase, poised for distribution. This distribution is anticipated to be substantial, potentially leading to another record high, potentially reaching 3650.
Moving forward, the price could continue towards our target from its current position. Alternatively, there exists a possibility that it may drain the sell-side liquidity and reverse from 3360-3370.
Our take-profit levels are set at 3450, 3490, 3520, and finally, 3600. When entering the market, it is advisable to employ a short time frame. It is important to note that this analysis is merely our opinion, and market conditions may deviate from expectations.
We extend our best wishes for success and safe trading. If you wish to demonstrate your support, you may consider liking, commenting, or sharing this analysis with others.
Sincerely,
Team Setupsfx_

GOLD REVERSAL POINT [Bearish Bias]According to this analysis, today I'm expecting a sell opportunity. So here we're analyze 1H time frame, Price is currently moving near a strong order flow area, and has also SIBI is pending. If price faces clear rejection from this key levels, So there is a high probability that the market may decline from this level. Wait with patient and maintain discipline, confirmation is key.
Now let's see how our sell zone plays out.
Always use stoploss for your trade.
Always use proper money management and proper risk to reward ratio.
#GOLD 1H Technical Analysis Expected Move.

Will the 3300 support hold today?Due to the sudden ceasefire agreement between Iran and Israel today, the gold market quickly flipped from bullish to bearish — when gold tested the 3300 support level just now, it rebounded near 3315 📈.
It may challenge the 3290-3300 support range again later: if it effectively breaks below, the next target is the strong support at 3265, and it may eventually dip to 3200 before starting a rebound 🔄.
If the breakout fails, it may consolidate near 3330, waiting for further market guidance 📊
⚡️⚡️⚡️ XAUUSD ⚡️⚡️⚡️
🚀 Sell@3330 - 3320
🚀 TP 3310 - 3305

GOLD- at CUT n REVERSE Region? What's next??#GOLD - perfect drop after Iran Israel casefire and now market just reached at his current ultimate swing region.
That is around 3343 to 3346-47
Keep close that region and only hold buying positions above tha.
NOTE: we will go for cut n reverse belowt that in confirmation .
Good luck
Trade wisely

GOLD - Its breakout? What's next??#GOLD... market broke our resistance area that is 3338 around
So keep close now and sustain above means a bounce expected.
Good luck
Trade wisely

Gold Price Analysis June 27Daily Trend Analysis:
The price has reacted strongly at the 3348 level, forming a clear and sustainable bearish structure. The 3296 zone is now a critical level — a confirmed breakout below this area could lead to a deeper decline, especially with limited potential for recovery on Friday.
Today, the bearish trend is likely to face less resistance compared to the bullish side. As such, a move toward the support zones at 3278 and 3255 is highly probable.
Any bullish retracement during the European session should be viewed as a good opportunity to look for SELL setups, targeting 3278 and 3255.
As previously analyzed, SELL zones are clustered around key resistance levels. Traders should closely watch price reactions in these areas for potential entry signals.
🔹 Breakout key level: 3296
🔹 Support zones: 3278 – 3255
🔹 Resistance zones: 3300 – 3312 – 3325 – 3336 – 3348 – 3363

XAUUSD Bullish OutlookThis chart captures a highly strategic bullish setup on XAUUSD, rooted in Smart Money Concepts (SMC) and institutional trading principles. The market has performed a major liquidity sweep, dipping below previous lows to collect resting sell-side liquidity before reacting sharply from a key demand zone.
Why Bullish? The Confluences:
Liquidity Sweep:
Price manipulated below a significant structural low to trap late sellers and activate institutional orders. This move into deeper liquidity suggests the smart money is building long positions.
Extreme P.O.I. + Demand Zone:
The blue zone marks a high probability reversal area where demand outweighs supply. This zone is validated by historical reactions and refined to align with an Order Block (OB) a clear footprint of institutional accumulation.
Bullish Structure Anticipation:
After the reaction, price is expected to form a series of higher highs and higher lows, confirming bullish market structure. Multiple resistance levels are in sight, each one representing an objective for price to reach in its journey upward.
Entry Point: $3,343 – $3,330
Located inside the OB and demand zone, this is where price is likely to build a base for upward continuation.
Stop Loss: Below $3,324
TP1: $3,363 (first internal structure break)
TP2: $3,375 (mid range target)
TP3: $3,383 (structural high retest)
TP Final: $3,405 (liquidity target above EQH)
Remember confirmation is key before execution.
#GOLD 2H Technical Analysis Expected Move.

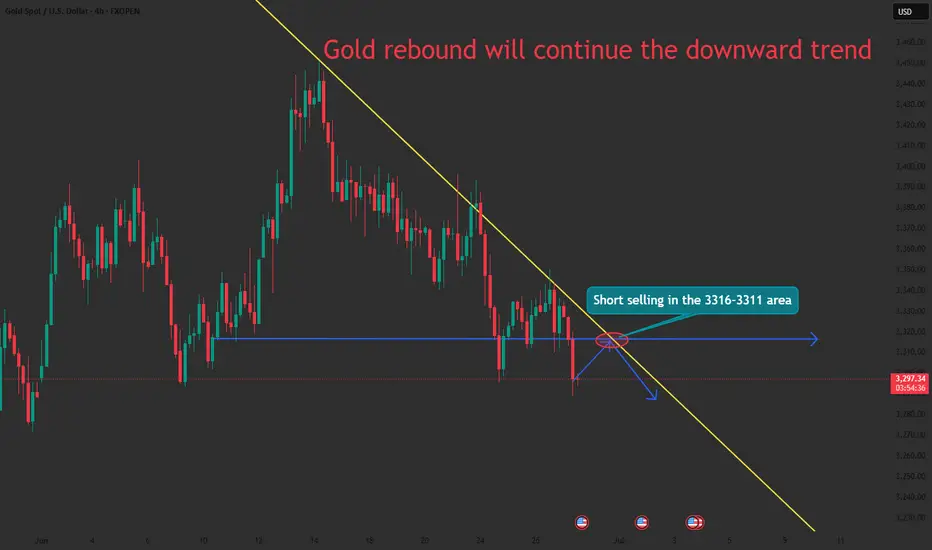
Gold prices are consolidating at a low level!International spot gold continued to fluctuate and fall. Looking back at the market performance on Thursday, gold prices maintained a narrow range of consolidation. Investors focused on the upcoming US inflation data to judge the direction of interest rate policy, while paying close attention to signs of easing geopolitical tensions in the Middle East. The current gold market is facing the influence of multiple factors: in the short term, PCE inflation data will become a key variable in determining the trend of gold prices. If the data is lower than expected, the market will strengthen the Fed's expectations of rate cuts, thereby supporting the upward trend of gold prices; on the contrary, if the inflation data exceeds expectations, it may delay the Fed's pace of rate cuts, resulting in pressure on gold prices. From a medium- and long-term perspective, the low interest rate environment, continued geopolitical risks and the potential weakening trend of the US dollar jointly provide structural support for gold prices. In addition, it is necessary to focus on the capital diversion effect that may be caused by the rising heat of the platinum and palladium markets. It is recommended to closely track the changes in capital flows in the precious metals sector.
From the analysis of the gold 4-hour level chart, today's gold price showed a downward trend at the opening, and the lowest fell to around US$3289.25 and then temporarily stabilized at US$3298. Technical indicators show that the 4-hour moving average system shows a dead cross arrangement, the MACD indicator dead cross continues, the gold price has fallen below the lower track support of the Bollinger Band, and the Bollinger Channel shows a narrowing trend, and the short-term price is in a low-level weak consolidation pattern. In view of the fact that the weekly line is about to close this week and the volatility of the end-of-month market is intensifying, it is necessary to focus on preventing the risk of a second bottoming out of the price. Comprehensively judged, the current gold trend is bearish, and the operation strategy is recommended to focus on rebound shorting.
Operation strategy:
1. It is recommended to short gold in the rebound area of 3311-3316, with a stop loss at 3324 and a target of 3300-3290
XAU / USD 4 Hour ChartHello traders. Although I did not take the trade, my last analysis lined up perfectly for the scalp Sell trade. Not being boastful, just showing my skill set. Big G gets a shout out. Happy Tuesday. Be well and trade the trend.

XAUUSD Analysis todayHello traders, this is a complete multiple timeframe analysis of this pair. We see could find significant trading opportunities as per analysis upon price action confirmation we may take this trade. Smash the like button if you find value in this analysis and drop a comment if you have any questions or let me know which pair to cover in my next analysis.
