It’s the right time to make a golden layout!Last Friday, the overall gold price continued to be suppressed and fell back to fluctuate and adjust. Finally, it stabilized at the 3340 mark before closing and rebounded and fluctuated. The daily K line closed with a fluctuating number K. The overall gold price continued to be suppressed and fluctuated in the near term. However, the US military attacked Iran's nuclear facilities over the weekend, exacerbating geopolitical tensions in the Middle East, and the market's risk aversion sentiment heated up. Today, the gold price jumped high and fell back into a volatile state. In the short term, the gold price is likely to continue the wide range of long and short fluctuations, and continue to trade time for space. Although gold opened high and went low, it still did not break the bullish trend channel. Looking for opportunities to go long after stepping back is also the current trend.
From the current market trend, today's technical support below is around 3345-3355, focusing on the gains and losses of the 3340 line; the upper short-term resistance is around 3380-3385, focusing on the 3395-3405 line. Relying on this range to maintain the main tone of high-altitude low-multiple cycle participation during the day, the middle position is always more watchful and less active, cautious pursuit of orders, and patiently waiting for key points to enter the market.
Gold operation strategy: go long when gold falls back to around 3350-3355, and add to long positions when it falls back to 3340-3345. The target is 3370-3380.Counter-trend short orders will be entered at an appropriate time based on market changes, and the specific points will be subject to the bottom 🌐 notification.
GOLDMINICFD trade ideas

The current price of gold is 3330-3335, go short directly!Gold rebounded after hitting the bottom of 3295. At present, gold is just a rebound, not enough to reverse directly. Gold rebounds and continues to be short. After all, the daily line has fallen continuously, so the short momentum of gold is still there. In the short term, the rebound of gold is just a repair after oversold. Gold is currently priced at 3330-3335 and is directly short.
The 1-hour moving average of gold continues to be arranged in a short position downward. After gold fell below the previous low of 3340 yesterday, gold has not been able to rebound again. In the short term, 3340 has become the key to long and short positions. In the short term, gold rebounds below 3340 and continues to be shorted. If gold breaks through and stabilizes at 3340 again, then gold may start to fluctuate again. Before breaking through 3340, gold is still weak and continues to maintain a short trend.

Gold selling plan!Gold has plunged to $3,290/oz, breaking the key psychological level of $3,300 as the US dollar strengthened and Treasury yields ticked higher. Market sentiment has turned defensive ahead of Friday’s US PCE inflation data, with expectations that the Fed may maintain its hawkish stance for longer.
📉 Technical Analysis:
• Key Resistance: $3,310 – $3,325
• Nearest Support: $3,285 – $3,272
• EMA09: Price is currently below the 9-period EMA, confirming short-term bearish momentum.
• Candlestick / Volume / Momentum:
o H1/H4 charts show a series of long bearish candles, with rising volume → strong selling signal.
o RSI is approaching oversold levels (~28), MACD remains in a widening bearish divergence → downward pressure is still dominant.
📌 Outlook:
Gold is in a clear downtrend and may extend its decline toward $3,285 – $3,272 unless a reversal is triggered by weaker-than-expected PCE data or renewed geopolitical tensions. In the near term, any technical rebound is likely to offer sell opportunities rather than a trend reversal.
💡 Suggested Trade Setup:
🔻 SELL XAU/USD
• Entry: $3,300 – $3,305 (on technical retracement)
• 🎯 TP: $3,285 – $3,272
• 🛑 SL: $3,315
🔺 BUY XAU/USD (high risk)
• Entry: $3,272 – $3,277 (short-term bottom catching)
• 🎯 TP: $3,295 – $3,305
• 🛑 SL: $3,262

Hanzo / Gold 30 Min ( Accurate Tactical Break Out Zones )🔥 Gold – 30 Min Scalping Analysis (Bearish Setup)
⚡️ Objective: Precision Breakout Execution
Time Frame: 30-Minute Warfare
Entry Mode: Only after verified breakout — no emotion, no gamble.
👌Bullish After Break : 3374
Price must break liquidity with high volume to confirm the move.
👌Bearish After Break : 3338
Price must break liquidity with high volume to confirm the move.
☄️ Hanzo Protocol: Dual-Direction Entry Intel
➕ Zone Activated: Strategic liquidity layer detected — mapped through refined supply/demand mechanics. Volatility now rising. This isn’t noise — this is bait for the untrained. We're not them.
🦸♂️ Tactical Note:
The kill shot only comes after the trap is exposed and volume betrays their position.

Gold: update hello friends✋️
According to the recent growth of gold, you can see that it is constantly resisting and forming a falling pattern.
For this reason, it can be a warning that the fall can continue and the price will fall to the specified limits.
🔥Follow us for more signals🔥
*Trade safely with us*

THE KOG REPORT - UpdateEnd of day update from us here at KOG:
Price moved well today sticking to the bias level and completing the first two TP levels we had shared. The path illustrated yesterday also worked well giving the move into the support level, then the bounce upside into resistance before then resuming the move.
With FOMC tomorrow we can expect any sharp movement to happen in the late session and Asia, otherwise the pre-event price action has begun, we have a range in play with resistance above at the 3395 level and support below 3355-60 which has been highlighted. The bias will stand for now but we're going to take a back seat.
Price: 3382
KOG’s Bias of the day:
Bearish below 3401 with targets below 3365, 3358 and below that 3350
Bullish on break of 3401 with target above 3410 and above that 3425
RED BOXES:
Break above 3395 for 3406, 3410, 3416 and 3419 in extension of the move
Break below 3378 for 3368✅ and 3355 in extension of the move
As always, trade safe.
KOG

Gold 1H Intra-Day Chart 23.06.2025Huge push up on Gold on market open due to Israel- U.S. war tension.
Option 1: Gold rejects from CMP and moves higher towards $3,416.
Option 2: Gold keeps dropping lower towards $3,290 for a deep liquidity grab.
Which scenario do you find more likely?

GOLD 30M ANALYSIS (LONG)In this analysis we're focusing on 30Min time frame. If we look in this 30Min chart, we have supply area and demand area. And we have also a minor resistance level. Now what I'm looking for that price move impulsively upside after sweeping all SSL. I'm expecting that price will come back and retest (3310 - 3305) area at least. So keep an eye on these level, confirmation is key.
Second Condition:
If price break above 3332 and close above 3332 with strong momentum than we will plan a buy trade on retracement.
Always use stoploss for your trade.
Always use proper money management and proper risk to reward ratio.
#XAUUSD 30M Technical Analysis Expected Move.

XAU/USD) Back Bullish trand Read The captionSMC Trading point update
Technical analysis of Gold (XAU/USD) on the 3-hour timeframe based on a price action setup within a rising channel and a key support zone. Here's a breakdown of the analysis:
---
Technical Overview:
Trend Structure:
The price is moving within a rising channel (marked by the black trendlines). Recent touches on both the top and bottom of the channel suggest that it is being respected.
Key Support Zone (Yellow Box):
Price recently tested a strong support zone around $3,338 – $3,350, which aligns with:
Historical price reaction area.
The 200 EMA (blue line).
An uptrend line support.
A bullish reaction (green arrow) confirming demand.
Bear Trap Breakout:
There’s a false breakout below the support followed by a sharp reversal (green arrow), which could indicate a bear trap, often followed by a bullish rally.
Price Projection:
The projected move suggests a bullish rally toward $3,478.89, offering a potential 3.97% gain (~133 points).
The path includes a possible consolidation before a breakout (illustrated by the wavy arrow).
RSI Indicator:
RSI is recovering from the oversold zone (~45), indicating increasing bullish momentum.
Mr SMC Trading point
---
Trade Idea Summary:
Bias: Bullish
Entry Zone: Around $3,350–$3,370 (post-retest of support)
Target: $3,478.89
Confirmation: Bullish price action at support, 200 EMA bounce, RSI reversal
---
Please support boost 🚀 this analysis)

LONG WEEKFor me the bias is bullish for next week and beyond.
Weekly support tapped and 3500 is next big restance for a PB.
Then ATH.
Good area to look for swing longs, possible longtime runners.

Gold Market Analysis and Trading Recommendations for TodayLast Friday, the overall gold price on the technical side continued to be under pressure, retracing and oscillating in adjustment. Eventually, it stabilized at the 3340 level before the close, rebounding and oscillating to close. The daily K-line reported an oscillating digital K. The overall gold price continued the recent suppressed oscillating consolidation.
However, over the weekend, the US military attacked Iranian nuclear facilities, intensifying geopolitical tensions in the Middle East, and market risk-aversion sentiment heated up. This morning, the gold price gapped up, piercing the 3390 level, reaching a high of around 3398 before retracing and falling into oscillation.
In the short term, it is highly probable that the gold price will continue to operate in a wide-ranging oscillating interval between long and short positions, continuing to trade time for space. Although the gold price opened high and moved low, it still has not broken the long-term trend channel. Looking for opportunities to go long on retracement is also the current trend.
From the current market trend, today's technical support on the downside focuses on around 3350 - 3345, and the short-term resistance on the upside is around 3380 - 3385, with a key focus on the 3395 - 3405 level. For the day, first, rely on this interval to maintain the main tone of participating in the long - short cycle. For positions in the middle range, always observe more and trade less, and be cautious about chasing trades. Patiently wait for key points to enter the market.
XAUUSD
buy@3345-3355
tp:3370-3390-3410
Investment itself is not the source of risk; it is only when investment behavior escapes rational control that risks lie in wait. In the trading process, always bear in mind that restraining impulsiveness is the primary criterion for success. I share trading signals daily, and all signals have been accurate without error for a full month. Regardless of your past profits or losses, with my assistance, you have the hope to achieve a breakthrough in your investment.

Gold reaches the lower support and makes a bold attemptWith the official ceasefire in the Middle East, risk aversion has returned to normal. Russia and Ukraine are now expected to return to the negotiation table. The situation that was in full swing last week has suddenly become calm. Then the focus of market attention has shifted again to the Federal Reserve's monetary policy. Federal Reserve Powell reiterated in his testimony to the Senate Committee on the semi-annual monetary policy report that there is no rush to act. The tariffs are unprecedented and it is difficult to predict the impact on inflation. Consumers may have to bear part of the tariffs. The trade agreement may make the Federal Reserve consider cutting interest rates, continuing its previous hawkish tone and suppressing the rebound in gold prices.
Gold hourly chart;
Short-term analysis of gold; The recent fluctuations of 1-200 US dollars have greatly increased the difficulty of trading for retail investors. It seems that there are many opportunities in a day, but in fact, the big market mainly appears in a few times. If you can't keep up in time, you can only watch the price jump up and down. The most feared thing is not to keep up with the market, but the price returns to the same point, but the principal is gradually reduced.
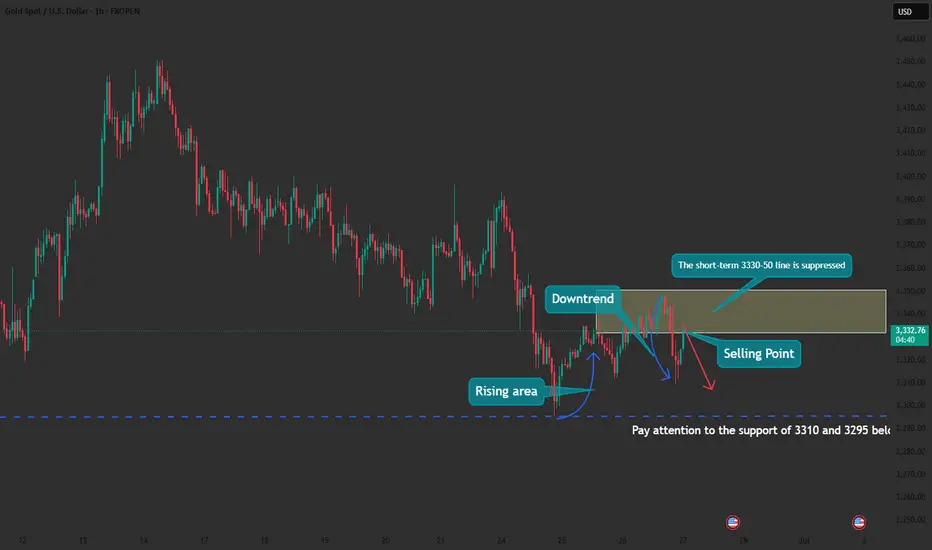
From the 4-hour analysis of gold, there are repeated resistances from the bulls before the downward break; once the downward break, the market will go further short, and pay attention to 3280 below. The upper short-term 3330-50 line is the key to suppression. Only by breaking the bulls can the rebound continue. In terms of operation, sell high and buy low, and pay attention to the breakthrough!
There are too many long orders at high levels of gold at present, and the market will not rise easily. The current international situation is so tense, and gold is still slowly declining. It is difficult to rebound sharply in this situation.
DeGRAM | GOLD descending wedge📊 Technical Analysis
● Price is compressing in a descending wedge at the channel floor (3 343-3 350). Repeated long-tailed rejections hint at seller exhaustion while RSI makes higher lows, flagging hidden strength.
● A 30 min close above the wedge roof (≈ 3 357) should trigger a measured move to the intra-channel resistance band at 3 371, then the prior pivot at 3 383.
💡 Fundamental Analysis
● Thursday’s softer US Philly Fed index and a slip in 2-yr real yields cooled the dollar, reviving bullion bids; meanwhile Chinese customs data show May gold imports up 18 % m/m, underscoring physical demand.
✨ Summary
Buy 3 345-3 355; wedge breakout >3 357 targets 3 371 ➜ 3 383. Long view void on a 30 min close below 3 335.
-------------------
Share your opinion in the comments and support the idea with a like. Thanks for your support!

Bullish journey from here 24 th juneMarket in the last 2 weeks was on a bearish journey and it's time now ready for it's bullish move. Now the market at 4 hour chart and it's strong support and eventually will take it's turn heading towards 3390. So it's good to trigger your buy ordered around 3330-3326 area

GOLD recovers market overview, key outlookOANDA:XAUUSD is under downward pressure, and ended last week's trading session with a decline. With tensions in the Middle East easing slightly and the Federal Reserve giving a hawkish signal, the safe-haven demand in the gold market tends to weaken, and investors' profit-taking intentions increase, these are the main reasons why gold recorded a significant correction this week.
Gold prices fell last week as safe-haven demand weakened as tensions in the Middle East temporarily eased. President Trump said he would decide on military action against Iran in the next two weeks, a concession that helped ease fears of an escalation. Although Iran continued to launch missiles at Israel, the situation has not spread. However, the Middle East conflict remains risky and is unlikely to end completely.
Gold prices are under pressure due to the Fed's hawkish tone. Although the Fed kept interest rates unchanged, Chairman Powell warned of inflation risks, especially from Trump's new tax policies. At the same time, Mr. Chris Waller's statement showed that the possibility of a July interest rate cut also depends on the inflation situation, causing market expectations to decrease and negatively affecting gold - a non-interest-bearing asset.
Central banks and institutions maintain bullish medium- and long-term expectations
Despite short-term pressures, most institutions maintain positive medium-term expectations for gold. Goldman Sachs reiterated its target of $4,000/oz by 2025, while Citigroup believes gold could fall below $3,000/oz by 2026.
Technical Outlook Analysis OANDA:XAUUSD
Gold has once again bounced from the EMA21 and reached its initial upside target at the 0.236% Fibonacci retracement of $3,371, as noted in previous editions. For now, for gold to qualify for its next upside target at the raw price of $3,400, it needs to sustain price action above the 0.236% Fibonacci level, which means the 0.236% Fibonacci level is also the closest resistance at present.
Once gold breaks above the raw price point of $3,400, it will be in a position to continue its short-term rally with a target of around $3,435, rather than the all-time high of $3,500.
In terms of overall structure, gold still has a bullish outlook with the price channel as the main trend and RSI remaining above 50 and well away from the overbought zone, suggesting that there is still plenty of upside ahead.
In the case of a sell-off, if gold is sold below the EMA21, it could test the $3,320 support in the short term, more so the 0.382% Fibonacci retracement level converging with the lower edge of the price channel. Therefore, early long positions may be considered in terms of volume as well as protection of open positions.
Finally, technically, gold is still trending with an overall bullish outlook, with notable positions listed as follows.
Support: $3,350 – $3,320 – $3,300
Resistance: $3,371 – $3,400 – $3,435 – $3,500
SELL XAUUSD PRICE 3406 - 3404⚡️
↠↠ Stop Loss 3410
→Take Profit 1 3398
↨
→Take Profit 2 3392
BUY XAUUSD PRICE 3312 - 3314⚡️
↠↠ Stop Loss 3308
→Take Profit 1 3320
↨
→Take Profit 2 3326

XAUUSD – Bearish Setup Following Liquidity Trap and Channel BreaGold has confirmed a bearish setup after breaking down from the ascending trend channel and trapping buyers near 3,390.
Technical breakdown:
Price engineered a liquidity trap above equal highs, inducing breakout longs near 3,390.
The rejection from that level triggered a clear change of character (CHoCH) and subsequent breaks of structure (BOS) to the downside.
The ascending channel, respected since early June, has now been invalidated with strong bearish momentum.
Lower highs are forming beneath key supply zones around 3,340, reinforcing institutional sell pressure.
Bearish bias:
Price is currently retesting a minor supply zone with signs of weakness.
As long as price holds below 3,340, bearish continuation is likely.
Targeting the strong low at 3,261, followed by the next demand at 3,205 if momentum persists.
This setup reflects smart money principles: engineered liquidity, structure shift, and supply-driven order flow.
Invalidation:
A clean break and close above 3,390 with BOS to the upside would invalidate this setup.

GOLD Gold’s retreat is directly linked to the Israel-Iran ceasefire, which has eased geopolitical tensions and prompted a shift in investor risk appetite away from gold and into equities and other risk-on assets...watch 3243-3224 zone #gold #shavyfxhub

gold bullish trading idea gold trading idea gold follow bullish channel gold make higher high and higher low now gold make higher high 3480

XAUUSD-Potential bearish drop off major support?The Gold (XAU/USD0 has broken out of the pivot which acts as an overlap support and could drop to the 1st support which has been identified as an overlap support.
Pivot: 3,374.04
1st Support: 3,341.44
1st Resistance: 3,398.38

Gold Trade Plan 27/06/2025Dear Traders,
📉 XAUUSD Technical Analysis – June 27, 2025
On the 4-hour chart, Gold has faced selling pressure after testing the resistance at 3359, and is now correcting down toward the key support zone at 3250–3280.
📌 Key Support Zone: 3250 – 3280
📌 Major Resistance: 3359
🔹 The price is currently testing the lower edge of this support zone. If we see bullish reversal candles (such as a hammer or bullish engulfing) in this area, we may expect a bounce back toward the rising trendline or even a retest of the 3359 level.
🔻 However, if the 3250 support fails to hold, a deeper drop toward 3200 or lower could follow.
🛑 The U.S.–China agreement news could have a direct impact on gold’s corrective trend. Caution is advised when entering trades.

Expected reversal/resistance zone price may react here with sellChart Overview:
Instrument: Gold Spot / U.S. Dollar (XAU/USD)
Timeframe: 4-hour
Price at time of screenshot: 3,321.910 USD
🔍
Key Zones & Labels:
🟡
Supply Zone
(Top - Yellow Area):
Around 3,440 – 3,460
Expected reversal/resistance zone; price may react here with selling pressure.
🟩
Strong Support
(Green Area):
Near 3,390 – 3,400
Former support zone that may act as resistance on retracement (support-turned-resistance).
🟧
Demand Zone
(Bottom - Pink Area):
Around 3,280 – 3,310
Strong buying interest shown; price likely to reverse or consolidate in this zone.
🧠
Annotated Insights:
BOS (Break of Structure):
Indicates a bearish structure shift before price tapped into the demand zone.
Liquidity Sweep:
The note says:
“They sweep the Liquidity right now it’s going to bullish”
Suggests stop-losses below demand were taken out (liquidity grab), hinting at a potential bullish reversal.
Projection (Gray Arrows):
Shows two possible price paths:
Rejection at strong support and continuation to supply zone.
Direct move from demand to supply zone.
📌
Purpose of Chart:
This chart is likely used for Smart Money Concept (SMC) or Institutional Order Flow analysis, showing:
Liquidity zones
Structure breaks
Probable bullish reversal

High Probability BUY Zone at The Edge📍 XAUUSD – High Probability BUY Zone at The Edge
Gold is currently reacting at a high probability BUY area, supported by multiple technical confluences:
✅ $3,300 Round Number: Psychological level and historical reaction zone
✅ Completion of 2nd Bearish Leg: A classic two-leg correction often signals exhaustion
✅ Retest of Uptrend Boundary: Long-term ascending trendline that has supported price since March
📌 Entry: Current price zone
🎯 TP1: Local highs ($3,353)
🎯 TP2: Mid-channel or upper resistance zone ($3,398)
❌ SL: 3263
This is a textbook trend continuation setup — the structure remains bullish unless proven otherwise.
Wait for confirmation or manage your risk accordingly.
—
#XAUUSD #Gold #ForexTrading #MJTrading #TechnicalAnalysis #BuyZone #SwingTrade #SupportZone #TrendlineSupport #SmartMoney #PriceAction #ForexSignals #CommodityTrading #MarketStructure #RiskReward #ChartSetup #ForexCommunity
