6.26 Gold intraday operation strategy, rebound 42-48 line shortFrom the 4-hour analysis, the upper resistance is around 3342-48. The intraday rebound relies on this position to continue to be short and follow the trend to fall. The short-term support below is around 3314-3316 integers. The upper pressure is around 3342-48. The overall support relies on this range to maintain the main tone of high-altitude low-multiple cycles. The short-term long-short watershed is 3370. It is difficult to say that it is strong before the daily level breaks through and stands on this position. I will remind you of the specific operation strategy during the session, so please pay attention to it in time.
Gold operation strategy:
1. Short the gold rebound at 3345-48, stop loss at 3356, target 3317-3325, and continue to hold if it breaks;
GOLDMINICFD trade ideas

Gold Under Pressure – Will the 3,385 Zone Hold?Hello everyone, let’s dive into gold price action together!
Following decisions from the Fed, BOE, and SNB to hold interest rates steady, gold continues to face downward pressure. High interest rates reflect a firm stance on inflation, pushing short-term capital away from non-yielding assets like gold.
On the chart, gold closed the session near $3,368, showing little change from previous candles. The precious metal is still being rejected at a key confluence resistance zone (EMA 34, EMA 89, and a prior consolidation area). As long as price fails to break above $3,385, the downside scenario remains favored.
If this resistance holds, my next move would be to sell, targeting a drop to $3,300—a zone where buyers previously stepped in.
What about you? Do you see gold heading lower too?

June 23, 2025 - XAUUSD GOLD Analysis and Potential OpportunitySummary:
Trump’s firm stance on Iran continues to provide support for gold.
Until new fundamental developments emerge, the strategy remains: Buy the dip on pullbacks to support.
🔍 Key Levels to Watch:
• 3406 – Range top
• 3400 – Psychological level
• 3396 – Resistance
• 3386 – Bull-bear divider
• 3380 – Resistance
• 3371 – Support
• 3365 – Intraday key support
• 3350 – Midpoint support
• 3342 – Support
📉 Intraday Strategy:
SELL if price breaks below 3365 → target 3362, then 3358, 3350, 3342
BUY if price holds above 3380 → target 3386, then 3391, 3396, 3400
👉 If you’d like to see how I enter and set stop-losses, drop a like! If I get enough interest, I’ll prioritize a detailed post this week.
Disclaimer: This is just my personal opinion, not financial advice. Please manage your risk carefully.
Gold's Battle at Key Support: Bounce or Breakdown?Hey Traders,
OANDA:XAUUSD has recently found support at a crucial demand zone around 3351.75, bouncing off this level with a sharp rejection wick, signalling buyer interest. The price action now shows a potential shift toward bullish structure with an expected retest and continuation toward higher resistance levels.
Current Market Conditions:
Price is rebounding from the 3351.75 support area, which has acted as a demand zone in recent weeks.
The recent bullish candle suggests buyers may be stepping back in, aiming to reclaim lost territory.
Short-term structure favours a possible higher low formation before continuation toward the 3403.47 and 3431.49 levels.
A break below 3351.75 would invalidate this bullish setup.
Fundamental Analysis/Outlook:
Today’s bullish sentiment in gold is fueled by the renewed geopolitical tensions in the Middle East and Fed Chair Powell’s cautious tone on policy rates. The market remains sensitive to inflation expectations and risk sentiment. As long as inflation persists and global uncertainty lingers, gold could continue to attract safe-haven demand, supporting upside scenarios.
Targets:
TP1: 3375.91
TP2: 3403.47
TP3: 3431.49
Risk Management:
Stop-loss: Below 3351.75 (key invalidation level)
Maintain a minimum 1:2 R:R ratio. Adjust position size accordingly based on volatility and support behaviour.
Technical Outlook:
The structure suggests a potential breakout continuation if buyers hold above 3351. Look for confirmation through higher low formations and bullish momentum candles before scaling in further. Price needs to reclaim 3368–3375 levels to accelerate toward targets.
Conclusion:
Gold is poised at a key turning point. If bulls defend the support and reclaim 3368+, we could see a wave of upside into the 3400s. Keep your eyes on intraday momentum and global headlines, especially risk-off events.
Sign-off:
"In markets, clarity often lies just beyond the fear. Trade the levels, not the noise."
I would love to hear your thoughts in the comment section, and please hit boost and follow for more ideas. Thank you, and profitable trading to you all!

XAUUSD| Weekly OutlookStill holding the same idea going into this week — waiting on that 30-minute mitigation to confirm bullish intent.
Until price delivers that, I’m staying patient and letting the market open up. No need to force anything. Let structure lead.
Bless Trading!

GOLD - SHORT TO $2,800 (UPDATE)Here's an update from my video analysis yesterday. Gold buyers climbed up towards our sell zone of $3,350 last night, where we closed out our intra-day buy's at £2,500 profit.
Gold sellers so far have rejected that resistance zone & dropped down 400 PIPS! If price can hold steady below this zone we can see much more downside to come. But a break above that zone could push price back up towards $3,400 again.

XAU/USD: Long-Short Battle at $3,300 ThresholdAccurate Verification of Middle East Situation Analysis
Yesterday's morning strategy focused on analyzing the authenticity of the Middle East ceasefire agreement. By deconstructing the policy logic and strategic intent behind Trump's statement, we accurately predicted that the "Israel-Iran ceasefire" had not reached an official consensus. Although logical analysis confirmed doubts about the news, gold prices still broke below the psychological integer threshold of $3,300 driven by market sentiment, highlighting the irrational feature of "emotion dominating facts" in the current market.
Escalating Trade War Risks Intensify Market Volatility
While the Middle East conflict remains unresolved, the EU issued an official statement last night, clearly stating it will launch retaliatory tariffs to force the U.S. to reach more favorable trade agreements. This move marks a further escalation of transatlantic trade friction, and market concerns about global economic growth may resurface.
Three Key Events to Monitor Closely
Gold prices are currently in a long-short stalemate at the $3,300 threshold, with the following events set to determine the short-term trend:
1.Signals of Fed Policy Pivot
Focus on the degree of rate cut expectations released in Powell's speech. A dovish signal will strengthen gold's safe-haven appeal.
2.Progress of EU-U.S. Tariff Game
Whether the EU substantially initiates counter-tariffs directly affects market assessments of global trade system stability.
3.The Legislative Process of the One Big Beautiful Bill
If the act passes smoothly this week, it may reconstruct North American trade rules—be vigilant against sudden policy shocks.
Short-Term Market Outlook
Before the above events materialize, gold is likely to oscillate within the range of $3,280-$3,350. Traders are advised to adopt a "buy low, sell high" range strategy:
- Light short positions can be taken at the upper resistance of $3,350 with a stop-loss at $3,370.
- Long positions can be initiated at the lower support of $3,280, targeting $3,320.
Note: The current market is significantly driven by news. All operations must strictly set stop-loss orders, with position sizes controlled within 15%.
I am committed to sharing trading signals every day. Among them, real-time signals will be flexibly pushed according to market dynamics. All the signals sent out last week accurately matched the market trends, helping numerous traders achieve substantial profits. Regardless of your previous investment performance, I believe that with the support of my professional strategies and timely signals, I will surely be able to assist you in breaking through investment bottlenecks and achieving new breakthroughs in the trading field.

XAU/USD Bullish Reversal from Key SupportXAU/USD Bullish Reversal from Key Support 📈🟢
📊 Chart Analysis:
Rounded Bottom Structure ⬆️
The price has formed a rounded bottom pattern, indicating potential trend reversal from bearish to bullish.
Multiple bounces (🟠 circles) from the curved support trendline confirm the validity of this structure.
Support Zone Rejection ✅
Price recently rejected from a major horizontal support zone (around 3,303.796 USD) with a strong bullish wick.
This zone has acted as a springboard for prior upward moves.
Falling Wedge Breakout 💥
A falling wedge (bullish pattern) has formed and is breaking to the upside.
Breakout confirmation is underway, indicating momentum shift.
Target Projection 🎯
The projected move from the breakout suggests a potential target at 3,385.820 USD.
This aligns with previous resistance areas.
Key Levels to Watch:
Resistance: 3,385.820 USD (target) and 3,425–3,450 USD (major resistance zone)
Support: 3,303.796 USD (short-term), followed by 3,225–3,250 USD zone
🔔 Conclusion:
Price action suggests a bullish bias with a possible upward continuation if it sustains above the wedge breakout.
Confirmation above 3,330 USD with volume can fuel a rally toward the 3,385–3,400 USD target zone.
📌 Risk Management Tip: Watch for fakeouts near wedge resistance or a re-test of 3,303 USD for better entries.

GOLD BUY BIASThe on going geopolitical unrest such as the isreal-iran buildup and tension in ukraine hastriggered a surge in gold demand as investors seek portfolio insulation.
Technically, I am expecting Gold to push down into our H4 Demand level around 3330 where we would be looking for our buy opportunity.

Gold strategy analysis for next week, hope it helps youThe current gold price stands at $3,273, showing a significant decline from previous levels. Looking back at Friday's trading, the gold market was in a state of "unrelenting decline": during the early Asian session, gold attempted a rebound, edging up to around $3,328, but was quickly met with resistance and pulled back. The downward trend continued into the European session, and with the release of the U.S. May Personal Consumption Expenditures (PCE) price index data during the U.S. session, gold prices fell further, hitting a low of around $3,355. Although there was a small rebound in recovery afterward, it eventually closed near $3,274, forming a large阴线 with a long lower shadow on the daily chart.
**Factors Influencing the Trend**
Market sentiment has reacted strongly to the optimistic agreements reached on trade-related matters, which has significantly boosted risk appetite. Simply put, when people feel the market environment is safe and there are plenty of profit opportunities, they are less willing to park their money in safe-haven assets like gold, thus greatly reducing gold’s appeal as a safe haven.
**Technical Analysis**
- **Daily Chart**: Gold has broken below the 5-day moving average, and short-term moving averages have formed a "bearish alignment"—it’s like a group of friends who were originally running in the same direction suddenly all turned around and started running downward.
- **4-Hour Chart**: The Bollinger Bands have widened, and gold prices are like being pushed by a force, moving steadily downward along the lower band. The previous top-bottom conversion level at around $3,310 is crucial. If gold fails to reclaim this level next week, it will be like losing an important position in a battle, which will intensify short-term selling pressure and make it highly likely that the downward trend continues.
**Outlook for Next Week**
The market will be bustling next week:
- Major central bank governors worldwide will hold a panel discussion, like a gathering of "financial giants" to discuss important matters. Their remarks and consensus may have a significant impact on the market.
- The non-farm payroll data, long known as a "heavyweight bomb" in financial markets, will also be released. It reflects the state of the U.S. job market, which is closely linked to the economy and monetary policy, so its release often triggers sharp market fluctuations.
- Additionally, talks about whether Powell will resign may continue to ferment next week, stirring up the market.
Affected by these major events, gold prices are expected to fluctuate more violently around the lower Bollinger Band at $3,270 per ounce next week, and there is a need to be cautious of a second dip.
**Comprehensive Judgment**
The gold market faces high uncertainty next week, but the probability of an overall bearish trend is relatively high:
- **Upper Resistance**: Pay attention to the $3,310–$3,300 range in the short term, a key boundary between bulls and bears. A breakthrough here could bring a turnaround for gold.
- **Lower Support**: Focus on the $3,250 level in the short term. A break below this level may open up further downside space.
From the indicator signals:
- The MACD double line is running below the zero axis, forming a death cross, and the green energy column is continuing to expand—like a car stepping on the gas, accelerating downward.
- The RSI is operating in the oversold region around 39. Although there is a possibility of a short-term bottom, it also faces a pullback correction. However, the bearish momentum currently holds the upper hand.
Gold strategy analysis for next week, hope it helps you
XAUUSD sell@3290~3280
SL:3310
TP:3370~3350

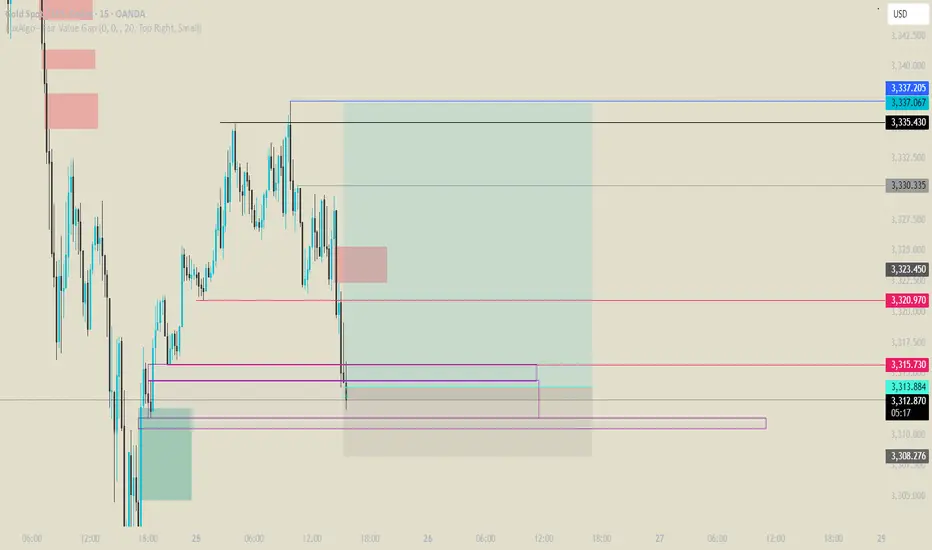
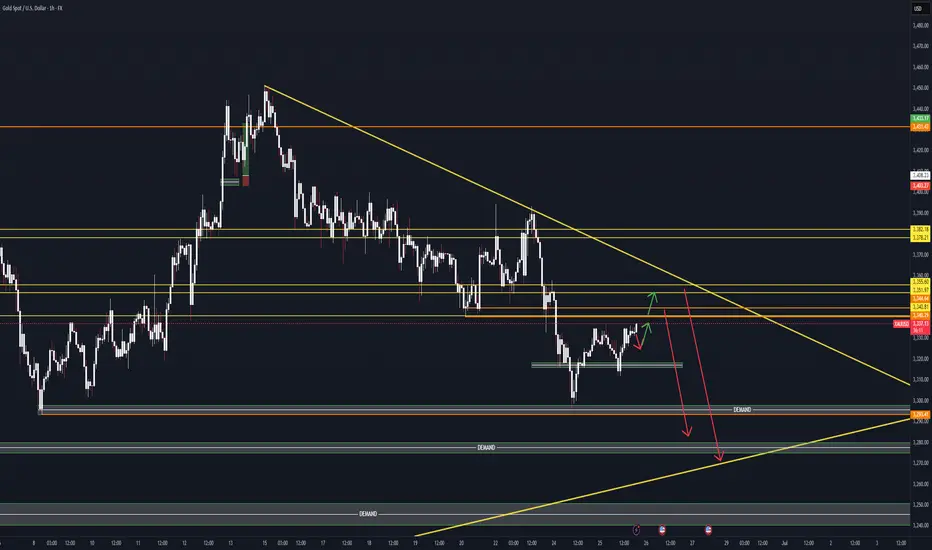
Scalping Strategy Using BOS & OB | Gold Spot | by Mohsen MozafarDescription:
> This is a 30-minute scalping setup on Gold Spot (XAU/USD), based on Smart Money Concepts (SMC) — focusing on Break of Structure (BOS) and Order Blocks (OB).
Analysis and strategy are prepared by Mohsen Mozafari Nejad.
---
📊 Market Context:
Current Structure: Bearish
Short-Term Market Structure: MSU (Market Structure Up)
Efficiency: Confirmed (clean price action & response zones)
---
🧠 Technical Highlights:
1. Double BOS confirms recent shifts in momentum
2. TLQ (Top Liquidity Quest) formed after HH (Higher High) and liquidity sweep
3. Key Demand OB identified (labeled A) — valid based on BOS confirmation
4. Expecting a bounce from OB (A) towards (B) as a reaction to unfilled imbalance
5. Potential drop from TLQ zone (B) to (C) if liquidity is fully absorbed
---
🎯 Scalping Plan:
Entry Zone:
Order Block at (A), waiting for CHoCH or bullish price action confirmation
(preferably on lower timeframe like M5)
Stop Loss:
Just below OB (around 3327)
Take Profits:
TP1: Near TLQ / Extreme zone (B)
TP2: Further liquidity grab or possible continuation above previous HH
---
❗ Alternative Bearish Scenario:
If price fails to hold at OB (A) and breaks below 3327 with BOS,
→ short opportunity opens toward new lows at 3314–3310 (labeled C).
---
✅ Summary:
This is a clean scalping setup following SMC principles:
BOS → OB → Liquidity → Reaction
Focus on structure, precision, and quick confirmation signals.
Prepared by:
📌 Mohsen Mozafari Nejad

Gold Pullback to Resistance – Bearish Setup in PlayOANDA:XAUUSD is staging a modest technical rebound after a strong breakdown, currently retesting the confluence zone of resistance and EMA on the 1H chart. This area around 3,351 USD marks a key selling region where bearish momentum may resume.
On the macro front, traders are eyeing the upcoming Core PCE data — the Fed’s preferred inflation gauge. A higher-than-expected reading could boost the US dollar and reinforce downward pressure on gold prices.
Technically, the recent breakdown followed by a retest of structure suggests bearish continuation. If gold fails to break above resistance, it may drop first toward the 3,304 USD zone (TP1) and potentially extend to the key support near 3,250 USD (TP2).
All eyes should be on how price reacts to resistance. A confirmed rejection could offer a high-probability short opportunity.

Gold on a decline / Fundamentals critically BullishTechnical analysis: The Price-action respected my Resistance zone limit projection as Gold is testing #3,352.80 local Low’s, and #3,377.80 Resistance in extension as a new viable Target for Buyers before aggressively pulling back to possible #3,320’s level (Gold is turning from Bearish to Neutral on the Short-term if market closes above #3,377.80 fractal, very slim chances). Once more Gold is being utilized as a safe-haven as the equity markets suffer significant losses. However as discussed before, I am making use of the DX as my key indicator to suggest the underlying trend of Gold, turned / switch from Bullish Short-term to Bearish as Gold didn’t managed to maintain Higher levels above #3,377.80 / my Resistance for the fractal. DX made an solid Technical Lower High’s Upper zone and didn’t rebounded strongly, which is confirmation of Selling sustainability on Gold (Gold couldn’t stage Bullish reversal until DX lost value and vice-versa). I expect late sessions of the week to maintain this momentum, so that by Friday’s session, Gold can test my #3,327.80 Target extension (posing as an important benchmark).
My position : Besides all Fundamental factors / escalation, Gold isn't soaring as one could expect. Therefore I will continue Scalping #3,352.80 - #3,377.80 Neutral belt and will Trade the break-out. #3,352 towards #3,327.80 or #3,377.80 to the upside however with DX rising, I give more probabilities to the downside.

Gold Gold haas been plummiting for the past week or 2 after soaring to new highs for weeks on end. Since there is so much geopolitical tensions around the world gold is seeming to bear the brunt of it.
After jobless claims came out significantly higher than expected gold took quite a fall and we can expect that fall to continue today with PPI news coming out today.
Remeber to trade Cautiously And Subscribe For More A+ Swing Setups
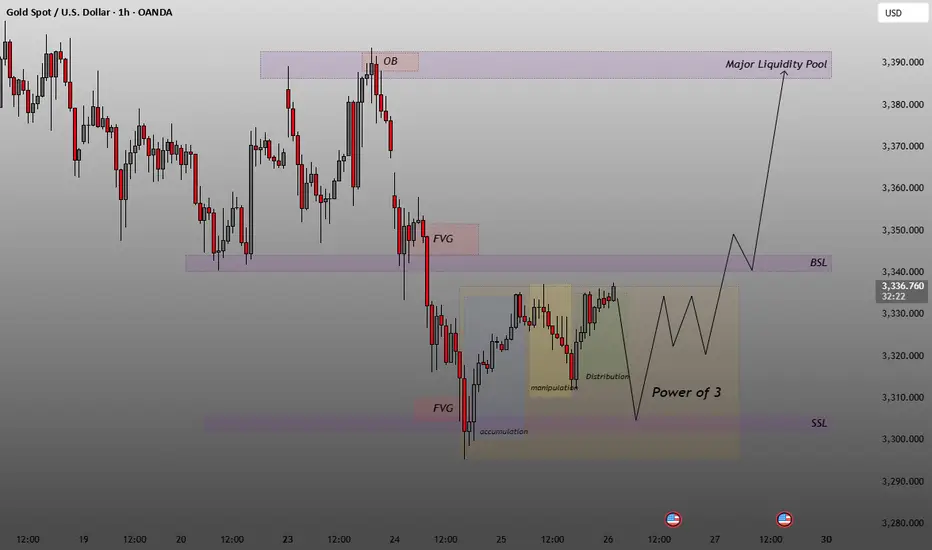
XAUUSD 1H–Power of 3, Liquidity Grab, FVG Fill & Bullish TargetThis is a classic Smart Money Concept (ICT) setup XAUUSD 1H – Power of 3, Liquidity Grab, FVG Fill & Bullish Targeting OB + Major Pool.
Accumulation at the bottom
Liquidity grab below SSL (Sell-Side Liquidity)
Expecting bullish expansion toward:
FVG fills
Break of BSL (Buy-Side Liquidity)
Tap or break of OB (Order Block)
Final target: Major Liquidity Pool ~3380–3390
🧠
Trade Plan:
Entry: After SSL sweep + bullish confirmation (FVG or MSB)
TP1: FVG fill
TP2: BSL break
TP3: OB or final pool zone
SL: Below manipulation wick.
GOLD GOLD ,the new resistance could be around 3370-3367 zone ,its expected to feel rejection as EMA+SMA on 4hrs suggest.
the demand floor 3330-3331 holds price and break below could be a change in bias .

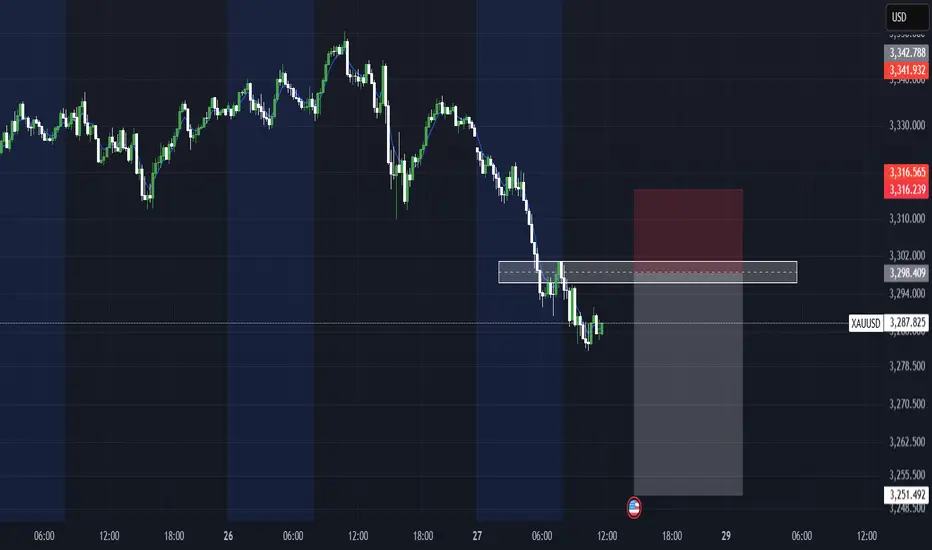
XAUUSD - Breakdown: - RISK OFF - Gold BearsGOLD has reached my previous analysis target ✅
Now seeing a pullback wave before potential continuation to the downside, keep in mind it is End of Month.
🎯 Pullback Zones:
1️⃣ 3340
2️⃣ Extended: 3350–3356
📉 If no new bullish fundamentals:
Next targets: 3293–3280
#XAUUSD #Gold #TechnicalAnalysis #Forex #Commodities #TradingLevels #MarketOutlook
Suppression remains unchanged, the latest layout of gold📰 Impact of news:
1. Powell's testimony
2. Geopolitical impact
📈 Market analysis:
The short-term rebound of gold is the release of energy for the accumulated bulls. From the current market trend, 3340 above is the key point of the short-term watershed between bulls and bears. The short-term resistance above is around 3342-3348, and the short-term support below is around 33220-3315. If it falls below this, it will continue to look towards yesterday's low of 3290-3280. The daily level is under pressure and continues to see a decline and adjustment. If it touches 3340-3350 above, you can try to short. After it retreats to 3320-3315 and obtains effective support, you can consider going long.
🏅 Trading strategies:
SELL 3340-3350
TP 3330-3320-3315
BUY 3320-3315
TP 3330-3340-3350
If you agree with this view, or have a better idea, please leave a message in the comment area. I look forward to hearing different voices.
OANDA:XAUUSD FX:XAUUSD FOREXCOM:XAUUSD FXOPEN:XAUUSD TVC:GOLD

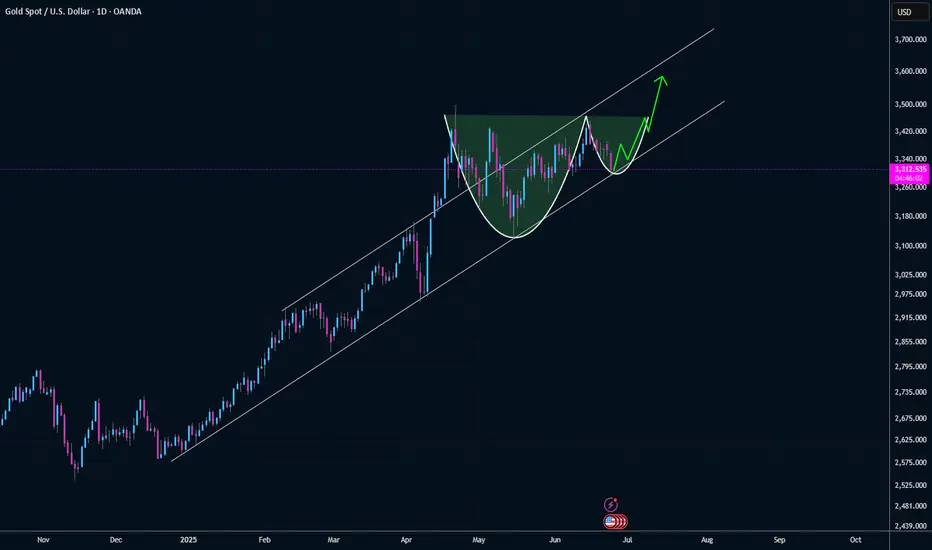
Gold Trend Still In TactPotential cup and handle formation as it the trend works into the bottom of the handle. Still think this comes back into play as the "big beautiful bill" comes back into focus and national debt is a topic of concern.
Gold is under pressure and continues to focus on weekly support
The Israeli-Iranian conflict that broke out on June 13th lasted for 12 days before a ceasefire agreement was reached. Iran retaliated against the US military base but did not block energy transportation. Trump called its response weak, and market concerns cooled. Gold and oil prices gave up their gains. Spot gold closed at $3,368.98 per ounce, close to flat. U.S. crude oil fell 9% from a 5% increase. Trump announced on Tuesday that Israel and Iran had reached a ceasefire agreement. After mediation by Qatar, Iran agreed, and Israel also hoped to end the conflict within a few days.
Gold fell as the situation eased and the demand for safe-haven assets weakened. Oil prices fell more due to the lack of risk in the Strait of Hormuz, and U.S. stock index futures rose. Federal Reserve Vice Chairman Bowman unexpectedly said that interest rates may be cut in July. U.S. Treasury yields fell and the U.S. dollar index fell, but did not support gold prices. The U.S. economy is facing inflation and growth slowdown pressure. If the situation in the Middle East worsens, oil prices may soar, exacerbating the risk of stagflation. Short-term ceasefires and differences with the Federal Reserve suppress gold prices. Medium- and long-term geopolitical risks and expectations of interest rate cuts support gold. Investors can pay attention to relevant developments and diversify their allocations.
In terms of gold, the overall price of gold fell on Monday. The highest price rose to 3396.68 on the day, and the lowest price fell to 3346.92, closing at 3368.94. On Monday, gold jumped higher in the early trading, and then came under pressure again. It continued to rise after the European and US trading to test the opening high. The price fell very weakly overnight, and finally ended with a big negative. At present, gold is still in a volatile decline.
From a multi-cycle analysis, first observe the monthly rhythm. The price ran according to the rhythm in May as the author said, and finally in a cross state. For June, focus on the gains and losses of the highs and lows in May. The price will only be a real break if it really closes above this position. The long-term watershed is at 2780. From a weekly level, the gold price is supported by the 3280 regional support level. From a mid-term perspective, we are still in a mid-term bullish position, but we need to pay attention to the market's retracement to the weekly support. At the same time, the price will be further under pressure only if it breaks the weekly support. From the daily level, the price breaks the 3365 daily watershed. The overall follow-up still focuses on the pressure performance, and the focus below is on the retracement to the weekly support. At the same time, according to the four-hour level, we need to pay attention to the 3360 position temporarily. Since gold is currently in a volatile decline, it will continue to be short before breaking 3405. In the short term, we will first focus on the four-hour and daily resistance pressure, and focus on the 3320 and 3280 area support below.
Gold 3360 and 3365 range is under pressure, and the target is 3320-3280

Analysis of gold market trend on June 23:
Core viewpoint:
Gold may continue to fluctuate at a high level and be weak next week, focusing on the breakthrough direction of the 3340-3395 range. The hawkish stance of the Federal Reserve suppresses gold prices, but geopolitical risk aversion and the decline of the US dollar form support. The technical side shows a long-short tug-of-war situation, and we need to be vigilant about the risk of breaking.
1. Analysis of key influencing factors
Federal Reserve policy suppression
The dot plot shows that there will be only two interest rate cuts in 2025, and long-term interest rate expectations will be raised, weakening the attractiveness of interest-free assets such as gold.
Risk point: If US economic data (such as PCE and unemployment rate) weaken significantly, hawkish expectations may be reversed.
Geopolitics and risk aversion
The situation in the Middle East, trade frictions and other events still provide bottom support for gold, limiting the downside space.
The trend of the US dollar is differentiated
The US dollar index rose and fell, and if it weakens further, it may ease the pressure on gold.
2. Key technical signals
The watershed between long and short positions
Support level: 3350-3340 (lower track of 4-hour channel), break down to 3250.
Resistance level: 3385-3395 (short-term trend line suppression), break through to test the previous high of 3450.
Indicator divergence
Weekly: MACD death cross appears initially, if confirmed, it will start mid-term adjustment.
Daily line: The momentum column turned to decline, but the volume did not fall, so be wary of false breakthroughs.
4 hours: The channel support near 3340 is the last line of defense for bulls, and if it fails, it will accelerate downward.
3. Trading strategy suggestions
Scenario 1: Range oscillation (probability 60%)
Operation logic: 3340-3395 range high sell low buy.
Short order: enter near 3385, stop loss above 3400, target 3350.
Long order: try long with a light position near 3340, stop loss 3320, target 3370-3380.
Scenario 2: Breaking support (30% probability)
Trigger condition: daily closing price is lower than 3340.
Follow-up strategy: short at 3360, stop loss at 3380, target 3250 (midline).
Scenario 3: Breaking resistance (10% probability)
Trigger condition: stand firm at 3395 and the dollar weakens.
Follow-up strategy: go long when it falls back to 3380, stop loss at 3365, target at 3450. Risk warning
Data risk: focus on US PCE inflation, GDP revisions and other data next week. If unexpectedly weak, gold may rebound.
Geopolitical emergencies: if the conflict escalates, safe-haven buying may push gold prices up rapidly.
Liquidity risk: month-end capital flows may amplify volatility, and positions need to be controlled.
Summary: Gold is short-term technically bearish but has not broken. It is recommended to focus on rebounding high and strictly stop loss. If 3340 is effectively broken, the trend will turn bearish; otherwise, if the support is held, there is still the possibility of a volatile upward trend.

THE KOG REPORT - UpdateEnd of day update from us here at KOG:
Price moved well today sticking to the bias level and completing the first two TP levels we had shared. The path illustrated yesterday also worked well giving the move into the support level, then the bounce upside into resistance before then resuming the move.
With FOMC tomorrow we can expect any sharp movement to happen in the late session and Asia, otherwise the pre-event price action has begun, we have a range in play with resistance above at the 3395 level and support below 3355-60 which has been highlighted. The bias will stand for now but we're going to take a back seat.
Price: 3382
KOG’s Bias of the day:
Bearish below 3401 with targets below 3365, 3358 and below that 3350
Bullish on break of 3401 with target above 3410 and above that 3425
RED BOXES:
Break above 3395 for 3406, 3410, 3416 and 3419 in extension of the move
Break below 3378 for 3368✅ and 3355 in extension of the move
As always, trade safe.
KOG
