June 27, 2025 - XAUUSD GOLD Analysis and Potential OpportunitySummary:
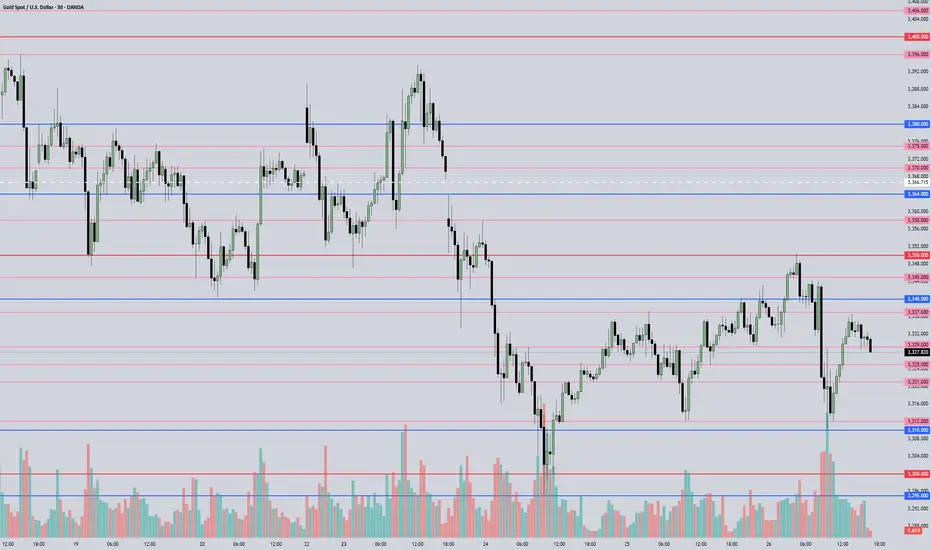
The 3310 zone has shown strong support. If this level breaks, bearish pressure is likely to increase.
On the upside, the 3350 area remains a strong resistance — if price approaches but fails to break through, it could offer a good short opportunity.
Keep a close watch on these two zones. Until a breakout occurs, treat price action as range-bound.
I'll be updating again during the London session — need a quick rest now 😴. Stay tuned!
🔍 Key Levels to Watch:
• 3364 – Resistance
• 3350 – Midpoint / Intraday Key Resistance
• 3345 – Resistance
• 3337 – Critical Resistance
• 3321 – Support
• 3310–3312 – Intraday Key Support
• 3300 – Psychological Support
• 3295 – Support
• 3285 – Support
📉 Intraday Strategy:
• SELL if price breaks below 3325 → watch 3321, then 3318, 3310, 3300
• BUY if price holds above 3337 → target 3343, then 3350, 3358, 3364
👉 If you want to know how I time entries and set stop-losses, hit the like button so I know there's interest — I may publish a detailed post by the weekend if support continues!
Disclaimer: This is my personal opinion, not financial advice. Trade with caution and always manage your risk.
GOLDMINICFD trade ideas
GOLD GOLD ,MARKET STRUCTURE +SMA+EMA =100 % accuracy without fundamental news out break.
but with news doesn't work best.
gold lower level buy at 3314 -3318 is valid based on 3hr structure.

Gold $3300 TestWith geopol tensions easing, gold prices have continued to pullback and this morning brought the first re-test of $3300 in a couple of weeks. So far, that support has held and with the Fed talking up rate cut potential even in light of higher inflation projections, that's a factor that could contribute to bullish moves in gold. The bigger question is price action related, however, and whether the build of short-term higher-lows at $3300 earlier today can lead to a larger tide of strength.
The prices of $3325.60 and $3350.02 are both key short-term resistance levels, and if bulls can power through that, the door opens for re-tests of $3400 and then $3435.
On the underside of prices, the $3250 level was a key swing of support as taken from prior resistance, and that's the next major spot below. - js

GOLD Ceasefire Violations Alleged:
Despite the ceasefire, both sides have accused each other of violations:
Israel reportedly struck a radar site north of Tehran just hours after the ceasefire was due to take effect, but refrained from further attacks following a direct call between Trump and Netanyahu.
Iranian missiles were fired toward Israel after the ceasefire announcement, but it is unclear if these were intentional breaches or operational delays.
GOLD safe haven appeal resumes buying in the face of war and geopolitical tension in middle east

GOLD - WAVE 5 BULLISH TO $3,734 (VIDEO UPDATE)Here’s an updated video analysis, as ‘Minor Wave 2’ is still forming & pulling back deeper into the $3,285 zone which I mentioned for you all last week.
We’ll be keeping an eye around this zone for a slow down in bearish momentum & if we get it, we’ll enter a buy trade. If momentum doesn’t slow down, we will let it go towards $3,245 & invalidate bullish structure. That way we know to look for sell’s 📉
TP1: $3,374
TP2: $4,300

GoldKey Data Points:
Current Price: 3,309.065 USD
Open: 3,358.435 USD
High: 3,363.900 USD
Low: 3,307.295 USD
Change: +1.77% (+59,760 points)
Volume: Not explicitly stated but implied by "1B" (likely 1 billion units).
Price Action & Technical Observations:
Trend:
The price is currently below the open (3,309.065 vs. 3,358.435), suggesting a pullback after an intraday high of 3,363.900.
The +1.77% daily gain indicates overall bullish momentum, but the candle shows rejection near highs (wick formation).
Support/Resistance Levels:
Resistance:
Immediate: 3,362–3,375 USD (previous highs/profit targets).
Strong: 3,406–3,425 USD (key profit levels).
Support:
Immediate: 3,288–3,265 USD (labeled "Entity" and "Profit" zones).
Strong: 3,250 USD (psychological level).
Profit Targets:
The chart marks three profit-taking levels:
3,323 USD (minor), 3,362 USD (mid), 3,406 USD (major).
This suggests traders are eyeing these levels for potential reversals or take-profit actions.
Volume & Momentum:
The "+59,760" change with "1B" volume implies strong buying interest, but the long upper wick hints at selling pressure near highs.
Potential Scenarios:
Bullish Continuation:
If price holds above 3,288–3,265 USD, a retest of 3,362–3,406 USD is likely.
Bearish Reversal:
A break below 3,265 USD could trigger a drop toward 3,250–3,225 USD.

Can XAUUSD Continue to Go Up?Last week was a bearish one for XAUUSD, following a strong bullish surge the week prior. The key question now is: can gold reclaim the highs it reached two weeks ago?
From a macro perspective, institutions remain net long and have even increased their long positions, signaling continued confidence in gold as a safe-haven asset. On the geo-economic front, tensions in the Middle East persist, with growing involvement from the U.S., adding to the uncertainty that typically supports gold prices.
Personally, I maintain a bullish bias on XAUUSD for now, supported by both fundamental and geopolitical drivers. However, if the landscape changes — whether through technical invalidation or shifts in sentiment — I’m prepared to adapt accordingly.

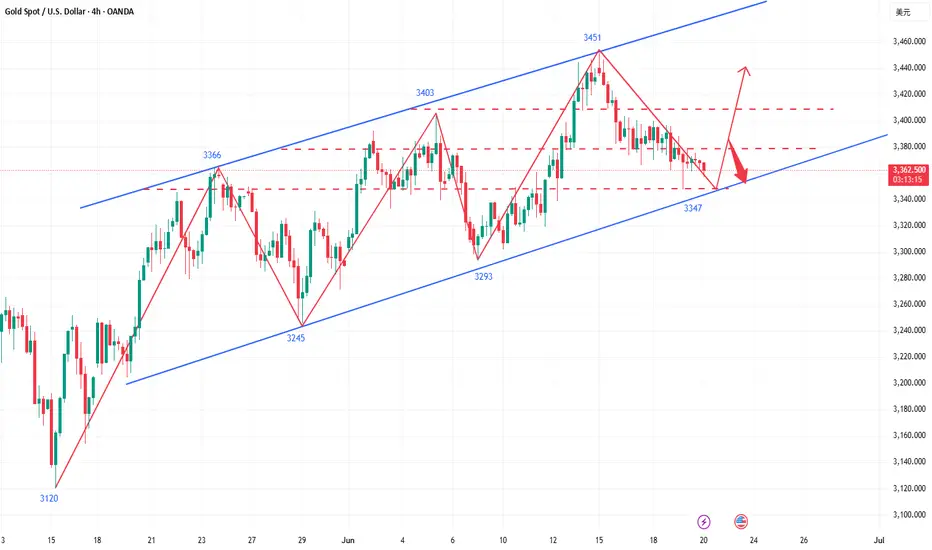
The bulls are not dead yet, it’s time to ambush at low levels!Gold only opened higher and rose on Monday this week, and then reached the highest level of 3452, and then started the road of shock and retracement this week. As of today, Friday, gold is still oscillating and adjusting in the lower range, but from the 4-hour market trend, the trend of gold is still dominated by bulls. In the short term, gold is oscillating and adjusting at a low level. Today, Friday, we will first focus on the support level of 3347-3353 below, which is also the starting point of the rebound yesterday. If this position is not broken today, Friday, we will mainly rebound and close.
From the 4-hour analysis, the support below focuses on 3347-3353, and the short-term resistance above focuses on the 3378-3385 level, with a focus on the 3408-3415 level. Continue to rely on this range to maintain the main tone of high-altitude low-multiple cycle participation unchanged, and the middle position is always more watchful and less active, cautiously chase orders, and patiently wait for key points to enter the market.
Gold operation strategy: Go long when gold falls back to 3347-3355, with a target of 3370-3380.
If you still lack direction in gold trading, you might as well try to follow my pace. The strategy is open and transparent, and the execution logic is clear and definite, which may bring new breakthroughs to your trading. The real value does not rely on verbal promises, but is verified by the market and time.
Gold Ready to Shine Again? Watch This Battle Zone Closely!Gold is consolidating above the 50% retracement (3372) after defending key structure at 3368–3378. Bullish momentum is building as Silver continues to lead, and the US Dollar (DXY) weakens post-FOMC. If buyers step in here, we could see a clean breakout toward 3415–3450 and beyond. But if 3368 breaks, the bull case is temporarily invalidated.
🧭 Technical Highlights:
✅ Support Zone: 3368–3378 (Fibonacci + bullish order block)
✅ Resistance Targets: 3395, 3415.84, 3451.84, 3470+
🔄 Silver Divergence: XAGUSD broke higher → leading XAU bullishly
🔼 Bias: Bullish (as long as 3368 holds)
🌐 Fundamental Drivers:
🏦 Fed dot plot turns dovish – Only 1–2 cuts, but no hikes planned; supports gold upside.
⚔️ Middle East tensions rising – Iran vs. Israel/US rhetoric keeps risk premium high.
📉 DXY weakens after Powell avoided hawkish tone; real yields remain capped.
💬 Silver outperforming on safe-haven + industrial hedge flows.
💡 Trading Plan Summary:
Buy Zone: 3372–3380
TP Zones: 3395, 3415, 3450+
Invalidation: Close below 3368
Confirmation: Break and close above 3395 with volume = signal to scale in
🔔 Keep an eye on:
US Jobless Claims, SNB & BoE Decisions
DXY 98.70 key level
Silver reaction near 36.70–37.20

XAUUSD Daily Sniper Plan – June 20, 2025🧭 Market Context
Following FOMC volatility and a Wednesday bullish reaction off 3351, XAUUSD is now hovering near 3370. The structure remains compressed between a flat EMA cluster and a key supply zone above. Thursday may bring low-to-moderate volatility early on, but watch for reaction after Philly Fed Manufacturing and CB Leading Index data during NY. Also, stay alert for a tentative Fed Monetary Policy Report release that may trigger later-session volatility.
🔍 Structural Overview
Daily Bias: Neutral-to-Bullish
H4 Trend: Still respecting higher lows but price is trapped under dynamic resistance
H1–M15: Consolidation between 3351 demand and 3388 supply
RSI: Mixed; compression between 47–55
EMA Flow: Flat on M30/H1; slight compression building for breakout
Liquidity Pools:
Resting buy-side above 3388
Resting sell-side below 3351 and deeper toward 3340
📍 Key Zones to Watch
🔵 BUY ZONE #1 – 3345–3352
🔹 Demand zone | Previous NY reversal base
🔹 M15 OB + EQ zone + liquidity sweep
🔹 Below full EMA stack → oversold entry if NY flushes pre-news
🔵 BUY ZONE #2 – 3328–3340
🔹 Deeper HTF demand + RSI oversold potential
🔹 Bullish CHoCH reaction zone from last week
🔹 High RR for recovery play if price collapses during NY news
🔴 SELL ZONE #1 – 3384–3395
🔸 Rejected on FOMC wicks
🔸 Key supply zone + EMA200 (M30/H1)
🔸 Fakeout zone → valid if price spikes before NY volatility
🔴 SELL ZONE #2 – 3405–3415
🔸 Secondary high liquidity trap
🔸 Last bullish FVG inefficiency
🔸 To be used only in case of irrational spikes post-data
🟠 FLIP ZONE – 3368–3375
🔸 Compression zone + recent CHoCH
🔸 EMA50 (M15–H1) aligning
🔸 Watch for breakout and real volume entry → flip zone into continuation
📌 Note:
Tomorrow’s news events:
Philly Fed Manufacturing Index
CB Leading Index m/m
Fed Monetary Policy Report (Tentative)
This could bring range plays early and a directional break later. Stay patient and wait for confirmation inside zones. Flip zone is ideal for quick scalps if volume picks up.
🔥 Stay sharp and don’t force trades in pre-news chop. Clean zones only.
Tag us if you’re using the plan, and don’t forget:
🧠 Think in structure. Enter in precision.
– GoldFxMinds
🟢 Disclosure: I am part of TradeNation's Influencer program and receive a monthly fee for using their TradingView charts in my analyses and educational articles.

Gold Holds Steady as Focus Shifts to Fed Policy Over GeopoliticaGold Holds Steady as Focus Shifts to Fed Policy Over Geopolitical Risk
- Gold prices remained resilient. The US Dollar Index slipped 0.23% to 97.74, while U.S. equities ended mixed as markets braced for Federal Reserve policy signals.
- The Israel-Iran ceasefire has eased geopolitical concerns, typically a bearish signal for gold. However, the metal’s continued strength, outperforming the weaker dollar, points to renewed institutional and retail accumulation. This highlights a key shift: investors are now prioritising monetary policy outlooks over crisis-driven moves.
- All eyes are on Fed Chair Jerome Powell’s congressional testimony, with particular focus on his comments regarding tariffs and interest rates. The CME’s FedWatch tool now shows a 24.8% probability of a July rate cut. Powell’s cautious tone—balancing inflation risks from potential tariffs against economic softness—has added uncertainty to the rate path, especially amid political pressure from the Trump administration.
- Gold’s recent price action suggests it’s evolving from a pure safe-haven asset into a hedge against broader monetary and economic instability. With geopolitical tensions easing, traders are now closely watching the Fed’s next steps and the dollar’s direction as key drivers of gold’s trajectory.

GOLD ROUTE MAP UPDATEHey Everyone,
Great start to the week with our chart idea playing out to perfection once again!!
We started with our Bullish target at 3440 hit followed with no ema5 cross and lock confirming the perfect rejection, showcasing the accuracy of our levels. This rejection went onto hitting our Bearish target, followed with ema5 cross and lock opening 3393, which was also hit perfectly.
We will now look for ema5 lock below 3393 to open the swing range or failure to lock below will see the upper Goldturns tested again.
We will see levels tested side by side until one of the weighted levels break and lock to confirm direction for the next range.
We will keep the above in mind when taking buys from dips. Our updated levels and weighted levels will allow us to track the movement down and then catch bounces up.
We will continue to buy dips using our support levels taking 20 to 40 pips. As stated before each of our level structures give 20 to 40 pip bounces, which is enough for a nice entry and exit. If you back test the levels we shared every week for the past 24 months, you can see how effectively they were used to trade with or against short/mid term swings and trends.
The swing range give bigger bounces then our weighted levels that's the difference between weighted levels and swing ranges.
BULLISH TARGET
3440 - DONE
EMA5 CROSS AND LOCK ABOVE 3340 WILL OPEN THE FOLLOWING BULLISH TARGETS
3463
EMA5 CROSS AND LOCK ABOVE 3463 WILL OPEN THE FOLLOWING BULLISH TARGET
3483
EMA5 CROSS AND LOCK ABOVE 3483 WILL OPEN THE FOLLOWING BULLISH TARGET
3508
BEARISH TARGETS
3418 -DONE
EMA5 CROSS AND LOCK BELOW 3418 WILL OPEN THE FOLLOWING BEARISH TARGET
3393 DONE
EMA5 CROSS AND LOCK BELOW 3393 WILL OPEN THE SWING RANGE
3372
3353
EMA5 CROSS AND LOCK BELOW 3353 WILL OPEN THE SECONDARY SWING RANGE
3330
3306
As always, we will keep you all updated with regular updates throughout the week and how we manage the active ideas and setups. Thank you all for your likes, comments and follows, we really appreciate it!
Mr Gold
GoldViewFX

There are opportunities for both bulls and bears in gold!Gold fell back and closed lower yesterday. The daily line closed with a negative cross overnight. The overall market has not changed much. The short-term repeated tug-of-war is temporarily consolidating. Today is the closing of the weekly line, and we will continue to maintain the volatile thinking. In the 4H cycle, the Bollinger Bands closed, temporarily exerting pressure on the middle track. After rebounding to 3350 yesterday, it failed to continue and remained in a weak shock pattern. Therefore, today's operation is mainly short and supplemented by long. The upper pressure is at 3328 and 3336. Short according to the rebound strength, pay attention to the rise and fall of 3310 below. A breakthrough may see the previous low of 3295. If the support is not broken, you can consider going long.🔔For more specific operation details and strategy updates, please pay attention to the notification 🌐 at the bottom.
Gold operation suggestion: short gold around 3328-3338, target 3315-3310.

XAUUSD long on market priceHere is the technical analysis for XAUUSD (gold).
Top down analysis show upward momentum:
Also on daily is bounced close to daily support-
On chart in the beginning it's visible that on 4H price has bounce from 4H support.
Market price: 3320
SL: 3280
TP1: 3360
TP2: 3400
Tp3: 3440

Geopolitical Hedging vs Monetary Policy: Gold Trading TipsGold prices continued this week's correction trend during Friday's Asian trading session, once falling near the one-week low. Although there was a slight rebound afterward, the overall trend remained in a weak adjustment pattern. This correction was mainly affected by the hawkish attitude of the Federal Reserve. At this week's policy meeting, the Fed kept interest rates unchanged, and the dot plot showed that only two rate cuts are expected by the end of 2025, while the rate cut expectations for 2026 and 2027 have been postponed. Even so, the US Dollar Index fell after hitting a weekly high, which provided some support for gold prices. In addition, growing trade concerns and escalating tensions in the Middle East have enhanced safe-haven demand, limiting the decline in gold prices.
From the 4-hour chart of gold, the current bullish momentum is dominant, and the resistance near 3375-3380 is clear. The pullback of gold prices has not broken through the upward channel for the time being, and the medium-to-long-term upward structure remains intact. If the Middle East conflict escalates or trade risks intensify, it may trigger a rebound and repair rally in gold prices. The daily chart closed in a doji star pattern, with prices retesting the middle 轨 of the Bollinger Bands, maintaining a volatile downward rhythm. The hourly chart shows significant downward characteristics, and a bearish strategy can be maintained before the resistance is broken. The resistance range is 3375-3380, and the support range is 3340-3345.
XAUUSD
sell@3070-3075
tp:3360-3350
Investment itself is not the source of risk; it is only when investment behavior escapes rational control that risks lie in wait. In the trading process, always bear in mind that restraining impulsiveness is the primary criterion for success. I share trading signals daily, and all signals have been accurate without error for a full month. Regardless of your past profits or losses, with my assistance, you have the hope to achieve a breakthrough in your investment.

XAU/USD) Back Bullish trand Read The captionSMC Trading point update
Technical analysis of Gold (XAU/USD) on the 3-hour timeframe based on a price action setup within a rising channel and a key support zone. Here's a breakdown of the analysis:
---
Technical Overview:
Trend Structure:
The price is moving within a rising channel (marked by the black trendlines). Recent touches on both the top and bottom of the channel suggest that it is being respected.
Key Support Zone (Yellow Box):
Price recently tested a strong support zone around $3,338 – $3,350, which aligns with:
Historical price reaction area.
The 200 EMA (blue line).
An uptrend line support.
A bullish reaction (green arrow) confirming demand.
Bear Trap Breakout:
There’s a false breakout below the support followed by a sharp reversal (green arrow), which could indicate a bear trap, often followed by a bullish rally.
Price Projection:
The projected move suggests a bullish rally toward $3,478.89, offering a potential 3.97% gain (~133 points).
The path includes a possible consolidation before a breakout (illustrated by the wavy arrow).
RSI Indicator:
RSI is recovering from the oversold zone (~45), indicating increasing bullish momentum.
Mr SMC Trading point
---
Trade Idea Summary:
Bias: Bullish
Entry Zone: Around $3,350–$3,370 (post-retest of support)
Target: $3,478.89
Confirmation: Bullish price action at support, 200 EMA bounce, RSI reversal
---
Please support boost 🚀 this analysis)

GOLD Finally Breakout , Short Setup Valid To Get 200 Pips !Here is my opinion , after this amazing 4H / Daily Breakout , we should sell Gold From Area Between 3377.00 / 3375.00 And Targeting 250 Pips At Least .


XAUUSD: Market strategy and analysis on June 24Gold technical analysis
Daily chart resistance 3400, support 3286
4-hour chart resistance 3345, support 3304
1-hour chart resistance 3335, support 3315
B2 bombing was carried out over the weekend, the scale of the war expanded, and the ceasefire was directly stopped on Monday. The news is changing at any time. Now the market risk aversion has subsided, and the gold price has fallen rapidly!
The 3400 mark has been under pressure for many times and failed to break through. With the news of the ceasefire agreement, the short-term correction pressure has increased.
Today, gold directly fell below the 3340 support. The loss here means that the shorts will further develop momentum downward. Next, gold will focus on the second highest point of the 1-hour line rebound 3357 as a defense point. If it continues to fall and test the 3300 integer mark, you can try to buy.
SELL:3340near
BUY:3300near

GOLDGOLD DEMAND FLOOR 3348-3350 could be the last defense in price for buy. after seeing 3358-3360 broken demand cross on 45 min ,sellers could be taking price beyond 3348-3350 if buyers don't demand coming.
geopolitical tension and 15min ascending trendline aligns with 3348 for buy entry.
if this layers fails wait at 3274-3285 zone .

Gold Cooling After Spike – $3375 Key Level to WatchBy analyzing the gold chart on the 4-hour timeframe, we can see that after surging to $3450 amid the Iran–Israel conflict, gold faced a pullback following a liquidity sweep above that level.
Currently, gold is trading around $3392, and after a potential correction down to $3375, I expect to see further upside movement.
⚠️ Stay cautious — gold remains highly volatile and sudden moves are likely!

There are still profit opportunities in short selling!As gold continues to rebound, bulls are reversing their decline. After gold broke through the 3370-3380 area, the current market consensus on 3350-3340 as the bottom area was strengthened. However, as gold fell back under pressure several times after the rebound, it proved that there was still a certain amount of selling pressure above, and it was obvious that the resistance was in the 3395-3405 area; once gold broke through this resistance area, gold bulls would regain the upper hand and are expected to continue to probe the 3320-3330 area. However, before gold effectively broke through the 3395-3405 area, bulls and bears would still fiercely compete for control, so it is still in a wide range of fluctuations.
Therefore, before gold broke through the 3395-3405 area, we can still appropriately short gold in the 3385-3395 area, and expect gold to retreat to the 3375-3365 area in the short term. In trading, we must pay attention to the changes in the rhythm of gold. Once gold chooses a direction and makes a breakthrough, we need to change our trading strategy!

XAUUSD Update 4th week of June 2025, WORSE CASE PlanIn this BIG ZONE range, if there's a continuation for a correction movement, the target could be 3000's area, 3020 most likely the last support.
This is a worse case plan as this year we are not found a big correction yet.
A major trend still bullish, but a big correction also needed and now it's the middle of the year.
Have a good luck !
