GOLD falls after Trump's statement, but skepticism remainsOn Tuesday (June 24) in the Asian market, spot OANDA:XAUUSD continued to decline. The current price of gold is around 3,340 USD/ounce, down sharply by about 30 USD. Gold traders are awaiting congressional testimony from Fed Chairman Jerome Powell as the ceasefire between Iran and Israel takes place.
On Monday evening local time, US President Trump announced that Israel and Iran have reached a complete agreement to achieve a comprehensive ceasefire. After Trump announced the news, spot gold prices fell sharply by more than 30 USD in the early morning trading session in Asia on Tuesday, which lasted until the time of writing.
Federal Reserve Chairman Jerome Powell will deliver his semiannual monetary policy report before the House Financial Services Committee on Tuesday.
Looking ahead, all eyes will be on Federal Reserve Chairman Jerome Powell’s two-day congressional testimony starting on Tuesday for fresh clues on the timing of the next rate cut.
The market is now pricing in a 21% chance of a Fed rate cut next month, up from a 14.5% chance on Friday, according to CME Group’s FedWatch tool.
Additionally, markets will continue to closely monitor the Iran-Israel conflict to see if the ceasefire can hold. The Israeli military continues to report that Iran has launched ballistic missiles into Israel.
Technical Outlook Analysis OANDA:XAUUSD
Gold is down and operating around the EMA21 moving average and technically, gold is currently in the best support area. Specifically, gold is operating at the EMA21, the technical indicator is noted as an important support for the short-term uptrend, followed by the horizontal support of 3,320 USD. Combined with the price action position, the Relative Strength Index (RSI) is above 50, and 50 is now acting as a support in terms of momentum for the possibility of price increase.
However, if gold sells below the 0.382% Fibonacci retracement level, it could be bearish, with the next target being the 0.50% Fibonacci retracement level at $3,228. Therefore, the area of the $3,300 base point is a very important support area for the long-term uptrend.
Intraday, with the current position, gold can still increase in price with the short-term target at $3,371 followed by the $3,400 base point.
Notable positions will also be listed as follows.
Support: $3,300 – $3,292
Resistance: $3,350 – $3,371
SELL XAUUSD PRICE 3407 - 3405⚡️
↠↠ Stop Loss 3411
→Take Profit 1 3399
↨
→Take Profit 2 3393
BUY XAUUSD PRICE 3304 - 3306⚡️
↠↠ Stop Loss 3300
→Take Profit 1 3312
↨
→Take Profit 2 3318
GOLDMINICFD trade ideas

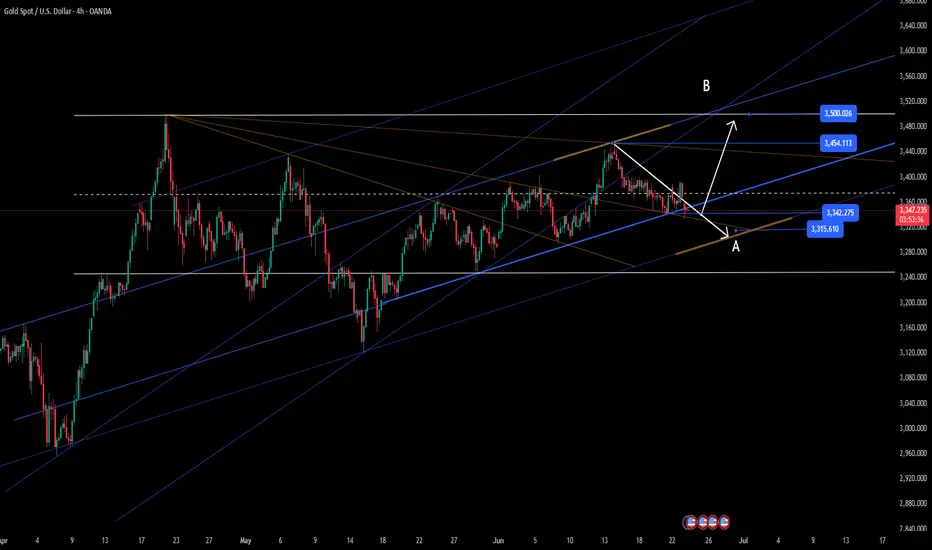
XAU / USD 4 Hour ChartHello traders. Taking a look at the 4 hour chart, I have marked my current area of interest. It is only Monday so I am not trying to force or rush a trade. Small pip, scalp trades in either direction are out there. Lower time frame confirmation is a must. This is just a general chart of what I am looking at, not advice to take a trade. Let's see how things play out. Big G gets a shout out. Be well and trade the trend.

6.23 Gold Short-term Technical AnalysisStimulated by geopolitical conflicts such as the US airstrike on Iran's nuclear facilities on Monday, gold opened $24 higher at 3398 in the early trading. However, it failed to continue the upward trend and quickly fell back to the 3360-65 area. Retrieve all the gains!
Technical analysis: 4-hour head and shoulders top pattern: right shoulder 3373 neckline 3340 MACD dead cross diverges downward Bollinger band opening expansion and price running near the lower track, short-term trend is bearish, and the daily line is still in the rising channel!
Short-term operation:
SELL: 3375\3385 Stop loss: 3390
$1:3360 $2:3340
BUY: 3338\3345 Stop loss: 3353
$1:3380 $2:3400
Operation suggestion: High-altitude is the main, low-multiple is the radiation

simple uptrend structureI see the potential for an uptrend. I have identified the important points for the uptrend structure, which is L-H-HL-HH. So, I see the potential for gold to rise. In addition, the fundamentals with the turbulent world situation of the Iran-Israel war are also factors in choosing a buy position.

gold bearish trading ideagold bearish trading idea gold breakdown traingle now gold next move [possible to sell target 3170
GOLD China Hong Kong gold vault hints at a geopolitical shift, as the Shanghai Gold Exchange's expansion, aims to enhance China's gold trading infrastructure and challenge Western dominance, potentially impacting demand and supply of physical gold need.
3380-3385 triggered but be cautious
wait at 3350-3355 as next demand zone for 70pips or more

XAU/USD: Range Trading Awaiting BreakoutCore Logic:
1.Macro Drivers: Powell's dovish remarks continue to reverberate, with U.S. Treasury yields declining, the U.S. Dollar Index breaking below 97, and the debt ceiling extended to July 24—safe-haven demand props up gold prices.
2.Technical Outlook:
Currently trading in a $3,300–$3,350 range, with shrinking volume reflecting market caution.
Trend Projection:
- Likely to remain range-bound between $3,300–$3,350; a breakout will depend on progress in previously mentioned catalysts.
- If data misses expectations or geopolitical risks (e.g., Iran tensions) escalate, gold may rally to $3,360; otherwise, it could test $3,300 support.
Trading Strategies:
- Long positions: Enter lightly at $3,300–$3,310, stop-loss at $3,290, target $3,340.
- Short positions: Sell on rejection above $3,345, stop-loss at $3,360, target $3,320.
- Risk management: Cap single-trade exposure ≤3% to mitigate data-driven volatility.
I am committed to sharing trading signals every day. Among them, real-time signals will be flexibly pushed according to market dynamics. All the signals sent out last week accurately matched the market trends, helping numerous traders achieve substantial profits. Regardless of your previous investment performance, I believe that with the support of my professional strategies and timely signals, I will surely be able to assist you in breaking through investment bottlenecks and achieving new breakthroughs in the trading field.

6/26 Gold Analysis and Trading ViewGood morning, everyone!
Yesterday, gold rose to around 3336 before pulling back, then revisited the same level again. The buy-on-dip strategy performed well, delivering solid profits.
At today’s open, prices have moved slightly higher but remain near resistance. Technically, there’s potential to test the 3350 area, and if the move is strong, a rally toward 3370 is also possible.
If gold reaches this zone, it may present a favorable short-term selling opportunity. Therefore, today's trading strategy should focus on range-based trading between 3326-3368, selling near resistance and buying near support.
Key levels to watch:
Resistance: 3348–3352
Support: 3326–3318
Lastly, be mindful: if a trending move emerges, adjust your strategy accordingly and avoid counter-trend trades. Stay flexible and manage risk wisely.

Analysis and layout of the latest gold trend in the evening📰 Impact of news:
1. The ceasefire agreement reached earlier did not take effect, and Trump believed that both sides violated the agreement
2. Federal Reserve Chairman Powell delivered a speech 3 hours later
📈 Market analysis:
After falling below the 3300 mark, gold hit the 3295 line and then rebounded. However, there are too many long orders at the current high level of gold, and the market will not rise easily. The current international situation is so tense, and gold is still slowly declining. It is difficult to rebound sharply in this situation. In the short term, focus on 3290-3280 below. If effective support is obtained, you can go long and look towards 3300-3310. If it falls below the support line of 3290-3280, the downward channel of gold will be opened and it is expected to reach 3265. At the same time, pay attention to the 3328-3338 resistance range on the upside. If the first rebound in the evening encounters pressure and resistance here, you may consider shorting.
🏅 Trading strategies:
SELL 3328-3338-3400
TP 3310-3300-3295
BUY 3290-3280
TP 3300-3310
If you agree with this view, or have a better idea, please leave a message in the comment area. I look forward to hearing different voices.
TVC:GOLD FXOPEN:XAUUSD FOREXCOM:XAUUSD FX:XAUUSD OANDA:XAUUSD

SHORT GOLDAfter retesting trend line break at 3386 we are expecting sells unti 3295. With first entry at 3341 second entry at the FVG at 3340 both stop losses at 3352 and TP at 3295
June 24, 2025 - XAUUSD GOLD Analysis and Potential OpportunitySummary:
Iran agreeing to a ceasefire is fundamentally bearish for gold.
From a technical perspective, price is still consolidating within the 3340–3400 range.
A break below 3340 could signal increased bearish momentum.
🔍 Key Levels to Watch:
• 3400 – Psychological resistance
• 3396 – Resistance
• 3380 – Resistance
• 3365 – Key resistance
• 3350 – Midpoint (bull-bear line)
• 3340 – Critical intraday support
• 3328 – Support
• 3315 – Support
• 3300 – Psychological support
📉 Intraday Strategy:
SELL if price breaks below 3340 → target 3328, then 3319, 3310, 3300
BUY if price holds above 3350 → target 3356, then 3365, 3370, 3375
👉 If you want to know how I time entries and set stop-losses, hit the like button so I know there's interest — I may publish a detailed post by the weekend if support continues!
Disclaimer: This is my personal opinion, not financial advice. Trade with caution and always manage your risk.
Short gold, gold still has at least one chance to pullback!At present, gold has rebounded to the 3370-3380 area again, which largely confirms that 3350-3340 is the bottom area at this stage. However, what we still cannot underestimate is that even with the support of safe-haven, gold has still failed to effectively break through the resistance of 3385-3395-3405 area, and even fell under pressure several times. To a certain extent, it weakened the willingness and confidence of bulls, so it aggravated the trend of wide fluctuations in the short term. During this period, we must pay attention to the rhythm change of gold.
According to the current bullish strength of gold, I think gold does not have the conditions to directly break through the heavy resistance of 3385-3395-3405 area for the time being, so gold still needs at least one retracement expectation, so I think we can still try to short gold in the 3375-3385 area, but the retracement expectation should not be too large, 3365-3355 is enough!

Gold in a Tug of War – Consolidation or Comeback?After a quiet trading week, XAUUSD is hovering around 3,368 USD, trapped between hawkish central bank policies and prolonged geopolitical tension in the Middle East.
Despite safe-haven demand sparked by the Israel–Iran conflict, Fed, BOE, and SNB holding interest rates high conti
From a technical perspective, gold is struggling to break through the 3,385 USD confluence resistance zone. A rejection at this level could trigger a short-term pullback toward 3,330 USD or lower.
In my view, this is a healthy consolidation phase—not a reversal. Don’t underestimate the bulls. The long-term uptrenpullbacks may offer strate.
What about you—do you believe gold is gearing up for another rally? Drop your take below.

Gold (XAUUSD) Short SetupBearish Breakdown Below Triangle Pattern!
Hey traders! 👋 Gold has broken down from a symmetrical triangle formation, signaling a potential bearish move. Price is currently testing the retest zone near the entry point (~3,335). If the rejection holds, we could see a sharp drop toward the strong support area at 3,296. 📉
🔹 Entry: ~3,335
🔹 Target: ~3,296
🔹 Stop: Above ~3,352
🔹 Risk/Reward: Favorable setup
💬 Drop your thoughts in the comment section – do you agree with the short bias? Let's discuss!
🙏 Support this idea by liking and sharing. Your feedback means a lot!

Gold expectation 1HGold should retest this price support line (in green) in its route to rejoining the channel for its destination. It broke out of structure due to news that came out, but buyers are making it return to its original path. Some nice strong buys are expected, so please watch for confimations as we go. #BuyTheBull

GOLD - SHORT TO $2,800 (UPDATE)Here's an update from my video analysis yesterday. Gold buyers climbed up towards our sell zone of $3,350 last night, where we closed out our intra-day buy's at £2,500 profit.
Gold sellers so far have rejected that resistance zone & dropped down 400 PIPS! If price can hold steady below this zone we can see much more downside to come. But a break above that zone could push price back up towards $3,400 again.

XAUUSD: Market Analysis and Strategy for June 26Gold technical analysis
Daily chart resistance 3400, support 3295
4-hour chart resistance 3370, support 3312
1-hour chart resistance 3350, support 3328
The gold market has recently shown strong resistance to decline, showing signs of stopping the decline and stabilizing for two consecutive trading days. The low point of the hourly chart is gradually moving up. This positive signal further consolidates the support of the market bottom. Today's opening price is around 3330, and the highest point of the oscillation upward is 3350. The recent volatility has decreased. In the NY market, we will focus on today's opening price of 3330 as the dividing line between long and short. If it falls below this position, the lowest target can be seen near 3312. Before that, you can do scalp buying transactions above 3330.
Buy: 3330near
Buy: 3312near

#3,300.80 tested as expectedAs discussed throughout my yesterday's session commentary: "My position: I will Sell every High’s on Gold especially if #3,352.80 benchmark is not recovered waiting for #3,300.80 benchmark test."
I have announced #3,300.80 test throughout yesterday's session commentary with engaging excellent Selling orders (mostly aggressive Scalps) until #3,300.80 benchmark isn't achieved.
Technical analysis: Strong rejection from late yesterday's session local High’s on increased Volume indicating that Sellers are strongly positioned at that mark, which is Technically the Support fractal on the neckline of former Bullish structure / pattern over Neutral High’s / Low’s. However a strong Support presence is seen at current #3,292.80 - #3,302.80 levels where Gold rebounded on an Hourly 4 chart’s Doji Star Bullish reversal candle many times in near past. This decline is temporarily confusing the patterns but with a new Higher Low’s and as long as the Lower Low’s Upper zone stays intact, I will regardless remain Bearish awaiting retracement to test #3,300.80 psychological benchmark once again. One must be fast to adapt on market changes which are the case lately in order not to hold worthless positions. Bond Yields however climbed to fresh Annual High’s above (# +4.5%) while DX is following the sequence on parabolic downtrend delivering #3-session Selling spree on Gold. Price-action remains contained near Hourly 1 chart's #3,327.80 as my main point of interest.
My position: I assume no new orders as I will await where Gold will turn next / reveal major move. Either #3,327.80 - #3,332.80 break-out towards #3,352.80 benchmark or big Sell towards #3,300.80 benchmark first, then if #3,292.80 gives away, #3,252.80 benchmark. Trade accordingly.

Gold is bouncing from support.. Time frame m30🔍 1. Trend Analysis
Past Trend:
From June 10 to around June 14, the price was in a strong uptrend, moving within an ascending channel (highlighted in red and blue).
After mid-June, the trend reversed into a downtrend within a descending channel (also shown in blue).
Current Position:
Price is now breaking out of the descending channel, potentially signaling a trend reversal or short-term recovery.
---
📈 Support and Resistance Levels
Key Resistance Levels:
3,347.944 – Intermediate resistance.
3,373.423 – Major short-term resistance and target zone.
Key Support Levels:
3,306.252 – Immediate support below current price.
3,275.459 – Strong support zone (highlighted in red), price bounced here multiple times.
---
📉 Pattern Observations
Reversal Pattern:
The recent bounce from 3,275–3,280 region, with rounded bottoms and breakout from the falling channel, suggests a potential bullish reversal.
Fibonacci Retracement:
A retracement level around 0.8279 appears on the chart, indicating that the price has retraced deeply from a recent swing high—another bullish indicator.
---
📊 Projection and Trading Outlook
Bullish Scenario (as shown by the arrows on the chart):
If the price holds above 3,306.252, it may move toward:
Target 1: 3,347.944
Target 2: 3,373.423
These are marked in blue boxes on the chart.
Bearish Scenario:
If price fails to hold above 3,306.252 and breaks down again:
Next support is at 3,275.459 (major demand zone).
A breakdown below this zone could signal further downside.
---
🧠 Market Sentiment & Cues
Multiple Touchpoints (Orange Circles): Suggest validity of both uptrend and downtrend channels.
Volume Missing: No volume data is present, which would help confirm the breakout’s strength.
Risk Events (Flag icons): These may indicate upcoming US economic events, which could bring volatility.
---
✅ Conclusion
Neutral-to-Bullish Bias short term, especially if price holds above 3,306.
Watch for confirmation above 3,347 for further upside.
Risk increases if price drops back into the red demand zone (< 3,275).

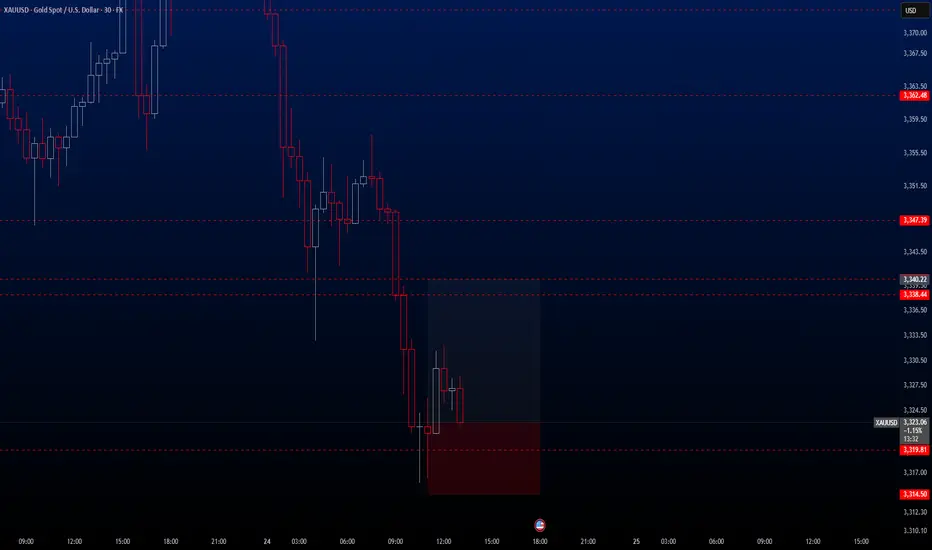
XAUUSD Hello traders. Today's second and also final trade opportunity comes from the XAUUSD pair. I consider this setup to be somewhat risky, so I recommend keeping your risk exposure at a minimum.
Earlier today, I shared a trade on GBPJPY, which has since experienced a strong upward move. As a result, I’ve updated the TP level for that trade. You can find the updated information noted under that specific post.
🔍 Trade Details
✔️ Timeframe: 30-Minute
✔️ Risk-to-Reward Ratio: 1:2
✔️ Trade Direction: Buy
✔️ Entry Price: 3323.09
✔️ Take Profit: 3340.22
✔️ Stop Loss: 3314.50
🕒 If momentum fades or the price consolidates in a tight range, I will keep this trade open only until 23:00 (UTC+4). After that, I’ll close it manually—whether in profit or loss—depending on how price action evolves.
🔔 Disclaimer: This is not financial advice. I’m simply sharing a trade I’ve taken based on my personal trading system, strictly for educational and illustrative purposes.
📌 Interested in a systematic, data-driven trading approach?
💡 Follow the page and turn on notifications to stay updated on future trade setups and advanced market insights.
Today's gold is waiting for low prices to go longToday's gold is waiting for low prices to go long
Gold price dynamics
International gold price: Today's spot gold fluctuated and weakened, once falling below $3,350/ounce, and the lowest hit $3,332.95, mainly affected by the ceasefire agreement in the Middle East.
Reasons for fluctuations: In the early trading, due to Iran's attack on the US military base, the gold price once soared to $3,398, but quickly fell back after Trump announced the ceasefire between Israel and Iran.
At present, the gold price fluctuates greatly, and the market has repeatedly washed the market.
Both the long and short sides have repeatedly washed the market, causing a huge impact on the market trading ecology. I believe that many people will encounter this unprovoked disaster again on Monday.
However, Iran's foreign minister subsequently denied the official ceasefire, and the situation remains unclear.
If the ceasefire agreement fails to be implemented, the gold price may rebound quickly to $3,400-3,450.
It seems that all choices of the direction of the war are left to traders like me.
Let's take a look at the interest rate cut situation:
Fed Vice Chairman Bowman made dovish remarks, saying that if inflation is mild, interest rates may be cut in July, and the US dollar index fell as a result.
The market currently expects a 23% chance of a rate cut in July and an 80% chance of a rate cut in September.
Fed Chairman Powell's testimony to Congress today is crucial, and if he sends a dovish signal, it may boost gold prices.
Remember the time: today
Technical analysis:
Technical analysis:
Support: $3300-3320 (200-day moving average).
Resistance: $3400-3450 (recent high).
Short-term (1-3 days):
If Powell's testimony is dovish, gold prices may rebound to $3380-3400.
If the ceasefire in the Middle East goes well, gold prices may fall to $3300.
My view:
Continue to go long at lows: 3330-3345 range layout
Final stop loss area: around 3315
Target: above 3400
XAUUSD Buy on WeaknessWaiting bulish confirmation candle at Moving Average 200 (blue), H4 timeframe
Disclaimer : Do your own Research

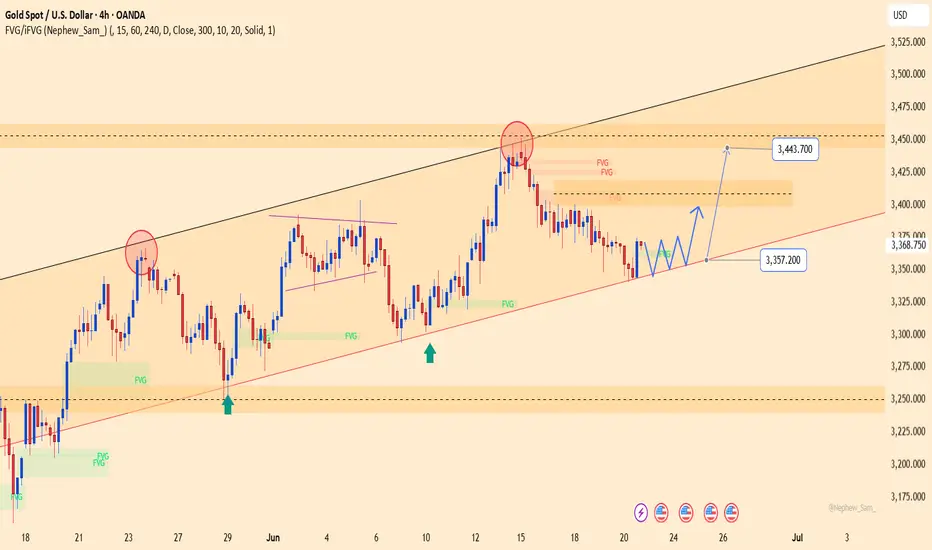
XAUUSD – Weak consolidation near 3,357, eyes on 3,443 retestYesterday, gold traded within the 3,344 to 3,371 USD range and closed at 3,368.75 USD (+0.72%). Despite the slight rebound, price action remains weakly consolidative within a broad ascending channel, repeatedly rejected at the 3,443 USD resistance area — where multiple FVGs (Fair Value Gaps) remain unfilled.
On the H4 chart, price is holding above the key confluence support at 3,357 USD, which aligns with the medium-term ascending trendline. If this level holds, a technical bounce back toward 3,443 USD is likely.
However, it's worth noting that recent upward moves have lost momentum near the upper FVG zones. Traders should wait for a clear confirmation signal — particularly a strong bullish candle at the current support — before considering entry.