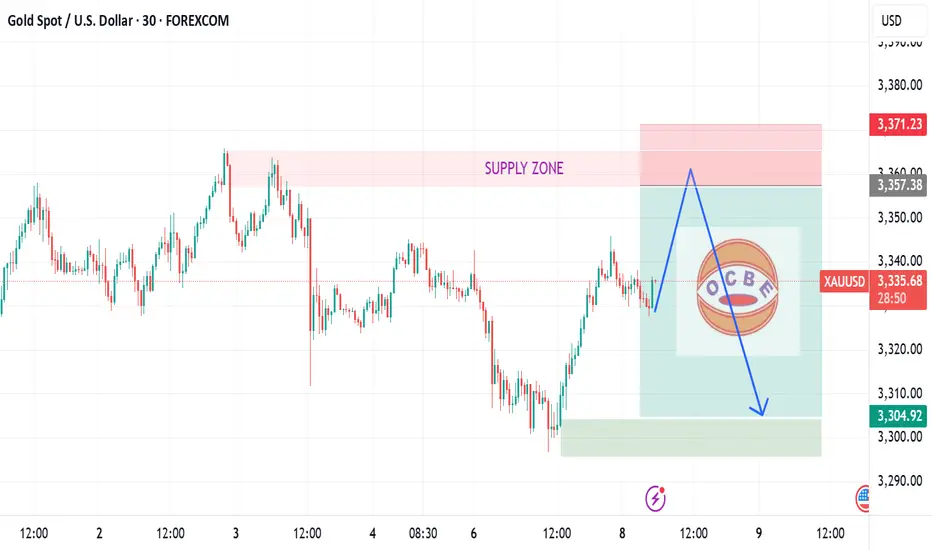
XAUUSD short movePrice is rising towards our supply zone, any bearish reaction cloud lead price to fall.
GOLDMINICFD trade ideas
Gold Breakout + Global News AlertGold has just broken out of a falling channel, pushing up to the 3337 level — a clear bullish move! ✅
But this isn't just technical... the news is backing it too 🔥
📢 The US has imposed a 30% tariff on South Africa and 25% on Malaysia and Kazakhstan 🇺🇸
Since South Africa is one of the world’s biggest gold producers, these tariffs could tighten global supply.
➡️ That means: Gold prices may rise further due to increased demand and reduced supply.
🔍 Technical View:
Resistance levels to watch: 3385 and 3437
Break above these could take gold towards 3540+
📊 This is a perfect example of how Technical + Fundamental = Powerful setup
Trade smart. Don’t just follow price — follow the reason behind it too! 💹
#GoldBreakout #MarketUpdate #SmartTrading #GoldNews #TariffImpact #RajasTrading

July 9, 2025 - XAUUSD GOLD Analysis and Potential OpportunityAnalysis:
Gold is currently in a choppy downtrend. Watch the 3300 level closely — if price holds above it, bulls may still have strength.
However, if it breaks below 3297, bearish momentum is likely to accelerate.
🔍 Key Levels to Watch:
• 3365 – Resistance
• 3350 – Resistance
• 3345 – Intraday key resistance
• 3330–3333 – Intraday key support zone
• 3322 – Short-term resistance
• 3310 – Resistance
• 3300 – Psychological level
• 3295 – Key support
• 3285 – Support
• 3275 – Support
📈 Intraday Strategy:
• SELL if price breaks below 3300 → watch 3295, then 3287, 3282, 3275
• BUY if price holds above 3310 → watch 3315, then 3322, 3330, 3337
👉 If you want to know how I time entries and set stop-losses, hit the like button so I know there’s interest — I may publish a detailed post by the weekend if support continues!
Disclaimer: This is my personal opinion, not financial advice. Always trade with caution and manage your risk.

Weekly range to be continued, gold short and long this weekLast week, gold opened high at 3280.9 at the beginning of the week and then fell back. The weekly low reached 3245.8, and then the market was strongly pulled up by the support of this round of trend line and fundamentals. On Thursday morning, the weekly high touched 3366, and then the market fell strongly under the strong influence of non-agricultural data. On Friday, the market consolidated in the range due to the holiday, and the weekly line finally closed at 3337.2. The weekly line closed with a medium-sized positive line with equal upper and lower shadows. After ending in this pattern, today's market continued to move in the range. In terms of points, the stop loss was still at 3346 after the short position at 3342 last Friday. Today, it first rose to 3342 and the short stop loss was still 3346. The target below is 3330 and 3322. If it falls below, the support of 3310 and 3300-3292 will be targeted.

XAUUSD is on fall 3280 on Mark !H4 Timeframe Analysis
Gold is currently holding the falling pattern & Range of 3330-3280 structural support.
H4 Timeframe Analysis
Gold is currently holding the falling pattern & Range of 3330-3280 structural support.
What's possible scanarios we have?
▪️As today we have seen implusive drop due to pause of Tarrifs by Trump side ,if h1-h4 Candle closes below 3330-3320 then we'll see gold to tap 3290 then 3280 as our optimal target for today.
Also we'll 3280 piviot point if it's break then again short towards 3250.
▪️exceptional Move of Day the H4 candle remains above 3330-3335 then keep your eyes at 3345 then 3365,3380.
#XAUUSD

Daily Analysis- XAUUSD (Monday, 7th July 2024)Bias: Bearish
USD News(Red Folder):
-None
Notes:
- Strong bearish momentum
on market open
-Looking for price to retest
4hr structure
- Potential SELL if there's
confirmation on lower timeframe
- Pivot point: 3345
Disclaimer:
This analysis is from a personal point of view, always conduct on your own research before making any trading decisions as the analysis do not guarantee complete accuracy.

Gold price trend forecast on July 8Gold price trend forecast on July 8
As of July 6, 2025, the international gold price fluctuates in the range of 3250-3350.
Affected by multiple factors, market sentiment is obviously divided.
The following are the key points and forecasts for next week's trend:
(1): Divergence in interest rate cut expectations: The probability of a rate cut in September has dropped to 47%.
(2): Weaker US dollar index: If the Fed postpones the rate cut, the US dollar may rebound in the short term, suppressing gold prices.
(3): Geopolitical risks: The situation in the Middle East has eased, and gold prices may fall due to safe-haven demand.
Russia-Ukraine conflict: If the ceasefire negotiations make progress, the safe-haven premium of gold may further subside.
(4): Central bank gold purchases and market supply and demand
Global central banks continue to increase their holdings: In the first quarter of 2025, global central banks net purchased 289 tons of gold, but the People's Bank of China has suspended its purchases for two consecutive months. The market is paying attention to subsequent trends.
Gold ETF fund outflow: SPDR Gold Trust holdings fell to 942 tons (the lowest since November 2024), indicating the withdrawal of short-term speculative funds.
(5) Technical analysis
Key support level: US$3,310. If it falls below, it may fall to US$3,280.
Resistance level: US$3,360. A new round of gains can only be confirmed if it breaks through US$3,400.
4. Investment advice
Short-term trading: Pay attention to the breakthrough of the US$3,300-3,350 range and adopt a high-sell-low-buy strategy.

Gold is bearish again.Next week I guess strong bearish rejection on gold. My expectation target is below 3100$ to pick up the liquidity before the next bull run regarding the fact of coming decreasing of interest rates.

XAUUSD (Upcoming Plan with 2 Scenarios) Analysis for the upcoming week (InShaaAllah) (2 Scenarios)
Breaking: Trump says tariff letters to 12 countries signed, going out Monday...
U.S. stocks are closed, how to operate gold volatility📰 News information:
1. Geopolitical situation
2. Tariff implementation and interest rate cut bill
📈 Technical Analysis:
Gold has maintained a volatile pattern recently, lacking a sustained unilateral trend. The unclear short-term direction of DXY has limited the volatility of gold. The market has repeatedly shown a mixture of high-rise decline and downward recovery. It is unable to effectively break through the previous high and lacks the momentum to break downward. The short-term pressure during the day is concentrated on the 3340-3345 line, and the upper middle track is at 3350. If it fails to effectively break above 3350, then gold may fall further. On the contrary, if it can stand above the middle track 33350, then gold may rise further. The short-term support below is near the 3323 line. If it fluctuates during the day, maintain a high-altitude low-multiple cycle.
🎯 Trading Points:
SELL 3340-3350
TP 3330-3320-3310
BUY 3320-3310
TP 3340-3350
In addition to investment, life also includes poetry, distant places, and Allen. Facing the market is actually facing yourself, correcting your shortcomings, confronting your mistakes, and strictly disciplining yourself. I hope my analysis can help you🌐.
FXOPEN:XAUUSD PEPPERSTONE:XAUUSD FOREXCOM:XAUUSD FX:XAUUSD OANDA:XAUUSD TVC:GOLD

BUY LIMIT - XAUUSDBUY LIMIT - XAUUSD @ 3326.00
TP: 3334.00
SL: 3321.00
Rather earn less, never more losses

XAUUSD – Bearish Month?🧭 Fundamental Bias: Bearish (-7/10)
– 🔥 NFP beat: 147K vs 110K → Fed cuts unlikely soon
– 💵 Dollar & Bond Yields UP
– 📈 Risk-on (Stocks ATH)
– 🛢️ Oil dropped = easing inflation
– 🏛️ No fresh Fed dovish hints
– 🕊️ Geopolitics stable for now (Iran/Trump)
📍 Technical View:
Price consolidating under supply zone (~3330).

Gold fluctuates, consolidation in the 3330-3310 range📰 News information:
1. Waller meeting on interest rate cuts
2. Trump tariff issues
📈 Technical Analysis:
Waller will participate in the meeting in more than two hours and pay attention to whether there is any news of interest rate cut. The key is to operate around the 3330-3310 range. Continue to pay attention to the support of 3310-3305 at night. If gold falls below 3310,-3305 again, the downward trend will continue, and it is expected to touch 3280 again, or even 3250. If it rebounds above 3330, it is likely to continue to rise.
In addition to investment, life also includes poetry, distant places, and Allen. Facing the market is actually facing yourself, correcting your shortcomings, facing your mistakes, and exercising strict self-discipline. I share free trading strategies and analysis ideas every day for reference by brothers. I hope my analysis can help you.
TVC:GOLD FXOPEN:XAUUSD FX:XAUUSD FOREXCOM:XAUUSD PEPPERSTONE:XAUUSD OANDA:XAUUSD

XAU / USD 30 Minute ChartHello traders. We see a nice push up into my current area of interest. Looking to see if we push up to fill the wicks and then reject and move back down, or keep pushing up. Be careful, NY trading volume is starting to thin. Big G gets my thanks.

XAUUSD Expecting bullish Movement Gold is showing potential for a bullish reversal from the key support zone between 3390 to 3395. Price has formed a base in this range, and if it holds, we may see an upside breakout above the descending trendline
Buy Zone: 3390 – 3395
First Target: 3355.50
Second Target: 3380.50
A successful breakout and hold above the trendline resistance could trigger a move toward our short-term targets. Watch for bullish confirmation before entering. Manage risk accordingly

GOLD - SHORT TO $2,800 (UPDATE)I know this constant whipsaw price action on Gold, of seeing it move up & down it testing a lot of peoples patience & liquidating short term buyers & sellers who keep buying at this level with no real trading plan.
But that is how I know the market is doing its job. Flushing out the weak, retail market traders before making its big move.


Gold 4-hour resistance point fluctuates, shorts comeOn Thursday (July 10), the 4-hour resistance point of gold price was formed before the US market. The logic of shorting at the resistance point can be considered. Spot gold maintained a strong trend in the European session, trading around $3,330. Although US President Trump's remarks on imposing a new round of tariffs on many countries triggered safe-haven demand, the FOMC meeting minutes showed differences in the path of interest rate cuts within the year, making gold bulls still cautious.
Spot gold continued to retreat after the previous high of $3,499.83, and has been blocked below $3,451.14 recently, forming a relatively obvious box consolidation structure. The current price is running below the middle track of the Bollinger Band at $3,343.69, indicating that the upward momentum of the bulls is weak. Analysts believe that the short-term key support level is at $3,250, which forms a resonance support with the previous low of $3,247.87. If it falls below, it may increase the downside risk.

$XAUUSD / Gold - Thursday July 10th OutlookYesterday’s price action gave us a clean 200 pip run from the break and retest of 3308, and today we’ve already caught 140 pips using yesterday’s high (3317.17) as intraday support.
But now we’re sitting at a critical inflection point.
📍 Key levels:
Safe Buys: Only looking to buy above Tuesday’s high of 3345.74, which gives room for a clean 200-pip move up toward last Thursday’s high.
Bearish Scenario: If we fail to break that high and instead break yesterday’s high of 3316.65, we may see a sharp 340 pip drop back down to 3282.83.
⚠️ Caution: The 4H bearish trendline from mid-June is still intact, and we're currently testing it. Wait for clear confirmation either way. Higher timeframes remain bullish, so we’re playing both scenarios carefully.

XAUUSD Analysis todayHello traders, this is a complete multiple timeframe analysis of this pair. We see could find significant trading opportunities as per analysis upon price action confirmation we may take this trade. Smash the like button if you find value in this analysis and drop a comment if you have any questions or let me know which pair to cover in my next analysis.


Gold swing( PRE/ DIS ) + PDA + Dealing rang (HTF )
( LTF ) PRE / DIS + PDA + Dealing range
FOMC High risk be carful im loonking to short GOLD and Hold it's a swing opportunity not for scalp SL gonna be bigger so manage risk for swing not scalp i told u

XAUUSD Loses Short-Term Support – Deeper Decline May FollowGold (XAUUSD) is showing clear signs of short-term weakness after losing a key support zone around 3,287 USD – which previously aligned with the rising trendline and the 61.8% Fibonacci retracement level (3,295.20 USD) of the prior downward move.
1. Price Structure and Current Pattern:
Price has formed a descending triangle and just broke below its lower boundary with strong bearish candles.
Consecutive bearish candles with short lower wicks indicate strong selling pressure with little buying interest.
After being rejected at 3,304.25 USD – the most recent swing high – price has dropped toward the 0.0% Fibonacci level at 3,280.57 USD.
2. Fibonacci and Key Price Zones:
The 3,295.20 area (Fibo 0.618) has now become a strong resistance after a failed recovery attempt.
The 3,280 – 3,275 zone is the next target for bears if no strong reversal appears in upcoming sessions.
A break below 3,275.73 may open the path for further downside toward 3,268 – 3,260.
3. Trendlines and Candle Behavior:
The short-term rising trendline (in red) has been broken alongside increasing sell volume.
The upper descending trendline (in light blue) remains intact, confirming that the overall structure is still bearish.
Suggested Trading Strategy:
Sell on rallies: Prefer short entries around 3,290 – 3,293, with a stop loss above 3,296.
Short-term target: Look for potential take-profit zones at 3,275 – 3,268.
Avoid bottom fishing unless there’s a strong bullish reversal signal such as an engulfing or hammer candle backed by volume.
Conclusion:
Gold is under visible downside pressure below key technical resistance. If the price fails to hold above 3,280, the downtrend could extend further. Traders should remain cautious of weak pullbacks and look to enter in line with the dominant bearish trend.

Focus on the Fed meeting minutesFrom a technical perspective, the trend of gold is obviously weak. In the morning trading yesterday, the price of gold failed to continue the previous day's rise, and the rebound high kept moving down. After breaking the key support level during the US trading session, it accelerated downward, and the daily line closed with a big negative line, and the short-selling force had the upper hand. Today's closing situation is crucial. If it continues to close with a negative line, the short-term downward trend may be established. The minutes of the Federal Reserve meeting will also bring new variables to the gold market. The policy direction may further affect the trend of gold prices. At present, the upper resistance is 3303-3308, and the lower support is 3284-3278. It is recommended to do more on the callback.
Operation strategy: It is recommended to do more on the callback of 3280-3275, with a target of 3295-3307 and a stop loss of 3370.
