"XAUUSD – Hidden Strength Within the Accumulation Zone"Hello everyone, how are you currently evaluating XAUUSD?
Yesterday, gold remained relatively stable without major volatility, yet continued to be supported by a favorable macro environment. Escalating tensions between Israel and Iran have sustained safe-haven demand. While the U.S. has yet to make a direct military move, President Trump’s emergency meeting and firm stance have increased market caution, which in turn boosted interest in gold.
At the time of writing, gold is trading around $3,368, and the long-term trend still favors the bulls. But why do I say that?
From both a technical and macro perspective, gold is in a healthy accumulation phase. Although it hasn’t broken above the record high, XAUUSD remains safely above key support zones — especially above the EMA 34 — which continues to affirm its bullish structure.
EMA 34 remains a strong dynamic support, with a clear separation from EMA 89, reinforcing the momentum. Even if we see short-term pullbacks in the next few sessions, they are more likely technical retests rather than signs of reversal.
Adding to that, the rising trendline, higher support levels, and bullish candlestick patterns all strengthen the case for continued upward movement. These combined factors paint a positive technical outlook for gold in the medium to long term.
From my perspective, I remain confident in gold’s long-term uptrend. What about you? Feel free to share your thoughts!
GOLDMINICFD trade ideas

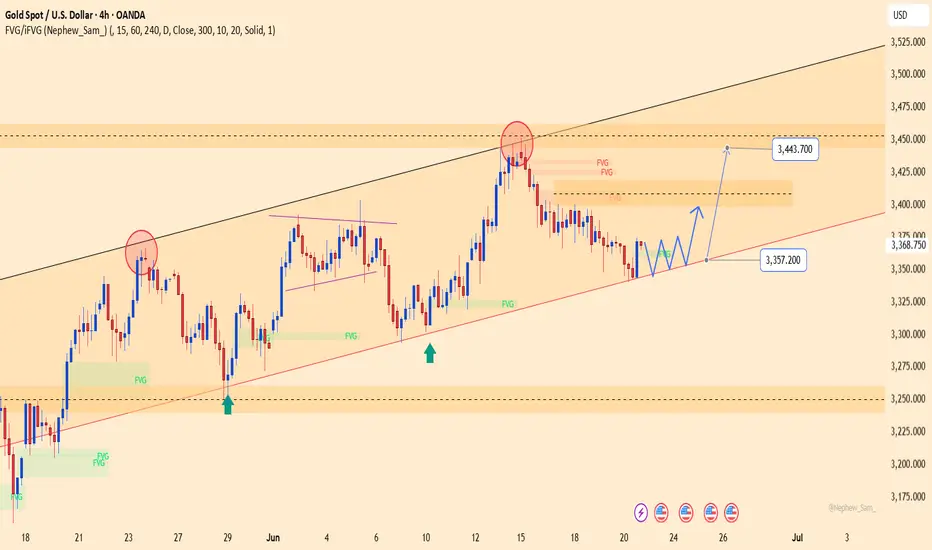
XAUUSD – Weak consolidation near 3,357, eyes on 3,443 retestYesterday, gold traded within the 3,344 to 3,371 USD range and closed at 3,368.75 USD (+0.72%). Despite the slight rebound, price action remains weakly consolidative within a broad ascending channel, repeatedly rejected at the 3,443 USD resistance area — where multiple FVGs (Fair Value Gaps) remain unfilled.
On the H4 chart, price is holding above the key confluence support at 3,357 USD, which aligns with the medium-term ascending trendline. If this level holds, a technical bounce back toward 3,443 USD is likely.
However, it's worth noting that recent upward moves have lost momentum near the upper FVG zones. Traders should wait for a clear confirmation signal — particularly a strong bullish candle at the current support — before considering entry.
Gold Continues to Fall Below $3,300As the week comes to a close, gold is on track for a decline of more than 1.5% during the latest trading session. So far, the bearish bias remains firmly in place in the movements of the precious metal, as demand for safe-haven assets continues to fade, mainly due to the ceasefire agreement in the Middle East conflict, which has helped restore market confidence. Since gold is a classic safe-haven asset, demand has steadily weakened in recent sessions, and as long as this situation holds, selling pressure on gold may continue to intensify.
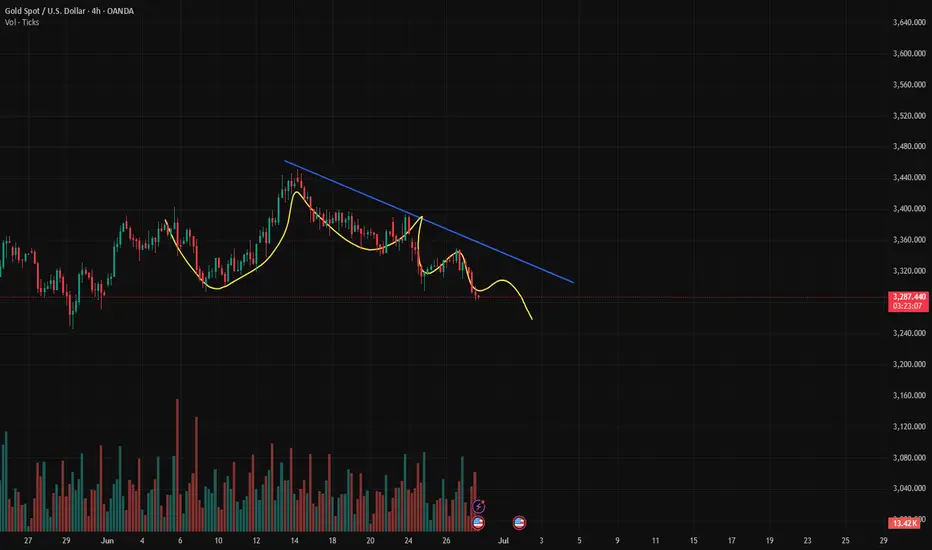
Uptrend Breaks:
Recent selling activity has played a crucial role, as it has led to a bearish breakout below the short-term trendline, which had been consistently holding on the chart. This breakdown has now opened the door for a lateral channel to form, suggesting that market sentiment has entered a more neutral zone in the short term. If bearish pressure continues, it could pave the way for a more dominant downtrend to take shape in the sessions ahead.
Indicators:
RSI: The RSI line has started oscillating steadily below the 50 level, signaling that downward momentum is beginning to dominate. If the line continues to move away from the neutral 50 level, we could expect more consistent bearish pressure on the chart.
MACD: A similar setup is emerging on the MACD. The indicator's histogram has dropped below the neutral line at zero and is showing persistent negative readings. This signals that selling momentum remains dominant, based on the average strength of the moving averages. If this continues, it would confirm a clear bearish bias.
Key Levels to Watch:
$3,300 – Current barrier: This level aligns with the midpoint of the short-term lateral channel. Price action around this area could reinforce the neutral outlook in the near term.
$3,400 – Key resistance zone: This level marks the historical highs of the gold market. A return to this level would revive the recently abandoned bullish trend and could reestablish a more optimistic outlook.
$3,200 – Critical support: This marks the lower boundary of the short-term channel. A breakdown below this level could trigger a fresh selling trend in the coming sessions.
Written by Julian Pineda, CFA – Market Analyst

XAUUSD/GOLD/SellThe pressure from the bears is too great. In the end, the pressure from above was not broken. Instead, it broke out and fell after being under pressure. The stop loss was hit.
The current price is 3285. After gradually boosting the US dollar index. The trend of gold prices has continued to fall. More importantly, the tariff issue has been eased. At the same time, geopolitical factors are also orderly and stable. This is the news that caused the bears to attack.
History has not become the savior because of repeating itself. Of course, this is also an emergency. In some transactions, the extremely low probability of causing losses is a common problem in transactions. However, our analysis team has stabilized a high trading win rate.
Then the next trading plan is still to focus on the pressure from above. If the London market rebounds above 3300. It is still mainly selling. 3314 is an important level for short-term rebound, and we need to pay attention. Although there is no obvious sign of rebound yet, the release of short-selling pressure has been alleviated because the decline is slow. Today's main trading idea is still to sell at high levels.
The target is to focus on the position of 3264-3248. Remember the risk of buying at low levels. Do not trade independently.
The data is negative. Will the price rebound from the bottom?Gold prices have continued to fall since the high near 3450. This trading day started the downward mode near 3328, and the European session continued to fall, breaking a new low. The negative PCE data also continued the downward mode. So far, it has rebounded after hitting the lowest level near 3255. However, the rebound is small, and the upper pressure is still very strong.
From the 4-hour chart, short-term resistance focuses on the vicinity of 3295-3300, followed by important pressure near 3315. The short-term support below focuses on the vicinity of 3265-3270. The overall strategy of shorting at high positions remains unchanged based on this range.
Operation strategy:
Short at the price rebound near 3295, short covering at the high point of 3315, stop loss 3325, profit range 3370-3360.
At present, the price fluctuates greatly. If you want to try scalping transactions, you can trade with a light position and float up and down 5 points to stop loss or profit in time.
This is the last trading day of this week. I hope you all will gain something and have a happy weekend with your family.

Gold fluctuated and fell, and the rebound was directly short
📣Gold News
Due to the easing of the situation in the Middle East, gold has fallen in the past few days, and the market has been eagerly looking forward to the interest rate cut, because the tariffs in the Trump era may push up inflation, but it has not come yet. "
On Thursday, the U.S. Department of Labor and Commerce issued key economic data, including initial jobless claims and the final value of real GDP in the first quarter. The number of initial jobless claims was 236,000, a decrease of 9,000 from 245,000 in the previous week, better than the market expectation of 245,000. At the same time, as of June 14, the number of continued unemployment claims in the week increased by 37,000 to 1.974 million, a new high since November 2021. Gold stopped below the moving average today. Gold did not continue the small positive line rise, and the decline continued during the U.S. trading period.
Today, focus on the continuation of short positions, comprehensive Labaron believes that gold is bearish today. For today's operation, consider rebound shorting as the main, and low long as the auxiliary.
📣 Pay attention to the resistance of 3330-3345 US dollars above
📣 Pay attention to the support of 3300-3280 US dollars below
💰 Go long near 3295-3285, target 3310-3320
💰 Go short near 3330-3340, target 3000-3290
If you have just entered the market, you are confused about the market of gold, oil and silver, and you always do the opposite operation direction and the entry price is unstable. I hope Labaron's article will help you.

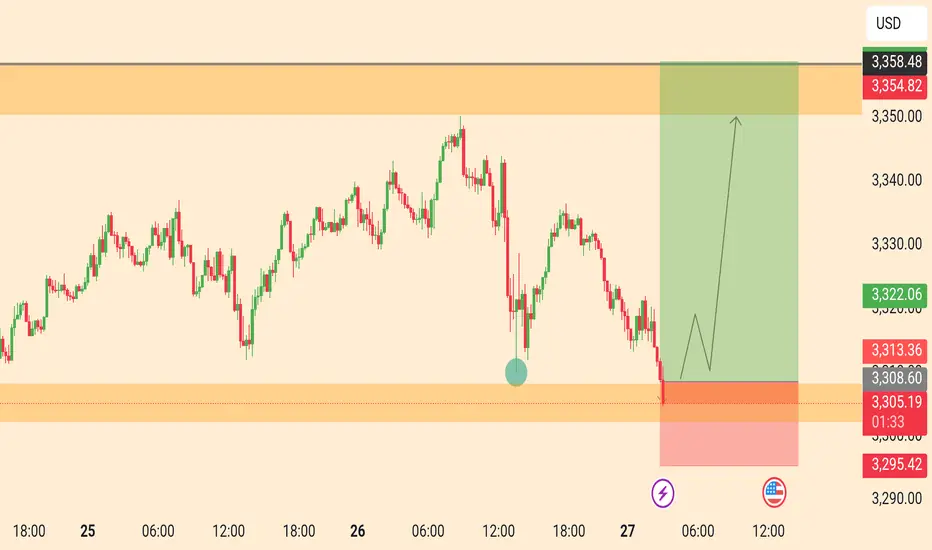
XAU/USD ANNALSIS OUTLOOK BULLISH MOVES POSIBLE 27/6/2025buy 3305
buy 3302
take profit 3310
take profit 3320
take profit 3330
stop los 3293
XAU/USD POTENTIAL BULLISH SHARK
This is my view on Gold, and as such it is not a recommendation for you to buy or sell XAUUSD, but this is what I'm expecting to happen on Gold in the next couple of days.

XAU/USD ANNALSIS OUTLOOK BULLISH Moves POSIBLE sell 3340 3345
take profit 3330
take profit 3320
take profit 3310
sl 3353

GOLD THE GOLD ,MARKET STRUCTURE +SMA+EMA =100 % accuracy without fundamental news out break.
but with news doesn't work best.
gold lower level buy at 3314 -3318 is valid based on 3hr structure.

Gold Spot / U.S. Dollar (XAU/USD) 4-Hour Chart Analysis4-hour chart from OANDA shows the recent performance of Gold Spot priced in U.S. Dollars (XAU/USD), with the current price at $3,313.650, reflecting a decrease of $9.800 (-0.29%). The chart highlights a recent upward trend followed by a pullback, with a support zone around $3,301.186 to $3,313.650 and a resistance level near $3,380.030. The inset provides a zoomed-in view of the price action, indicating potential volatility with a lightning bolt symbol and U.S. flags, suggesting significant market movements or news

GOLD UPDATE Looking for buying opportunities in case the support still holds
Follow for daily updates

Trap Above? Reversal Brewing or Just a Pullback?Gold (XAUUSD) continues to play mind games near a strong intraday resistance zone. Price formed a nice bullish channel and just tapped into the reversal zone near 3335, aligning with past supply and liquidity sweep potential.
⚔️ After a Ch.o.C (Change of Character) broke minor structure, it’s likely we see:
A deeper reversal toward support at 3323.450
Or a full breakdown heading into the FVG zone near 3308–3310
If we get a selling confirmation breakout, expect a flush back into imbalance & maybe beyond 👇
📉 Technical Bias: Bearish Rejection Setup
🧠 Sentiment: Watching for sell signals post-liquidation
📍 Key Zone: 3330–3335 = SELL Interest
🔔 Trigger: Watch 3323.450 for clean confirmation
💬 Note for traders: This could be the “trap” before NY liquidity kicks in — manage risk tight!

Dramatic change coming?In response to prospects of a de-escalation in the Middle East tensions, XAU/USD fell and has continued to decline throughout the day.
Despite the apparent breakthrough, Israeli Defense Minister Israel Katz ordered retaliatory strikes after claiming Iran violated the agreement hours after both nations agreed to the ceasefire, allegations that Tehran denies.
US President Donald Trump announced the initial ceasefire between Israel and Iran on Monday evening during an address at Capitol Hill, stating that “Stability in the Middle East is essential for global peace.”
The announcement followed Iranian missile strikes on US bases in Qatar, which were intercepted without casualties.
The ceasefire has pressured Gold and Crude Oil prices as traders unwind risk hedges tied to potential disruptions in the Strait of Hormuz, a critical chokepoint for roughly 20% of global Oil supply.
The reduced threat of supply disruption would help lower inflation expectations, a key theme for the Fed, which is facing pressure from Trump to cut interest rates.
However, investors expect the Gold price to get supported by a dramatic change in the Federal Reserve’s (Fed) stance on the monetary policy outlook. Fed Vice Chair Michelle Bowman stated in a gathering in Prague on Monday that monetary policy adjustments are becoming appropriate amid growing job market risks and expectations that the tariff policy announced by Donald Trump will have limited impact on inflation.
Tomorrow,Federal Reserve Chairman Jerome Powell testifies about the semiannual Monetary Policy Report before the US Senate Committee on Banking, Housing, and Urban Affairs.

Gold remains weak and is expected to fall below 3,300
Gold fell today due to the news of a comprehensive ceasefire in the Iran-Israel conflict. In addition, as Fed officials claimed that there was no need to cut interest rates at present, expectations of interest rate cuts fell, the dollar strengthened, and gold was under pressure. In the short term, it may continue to fall and further test 3291 to 3285. Therefore, today we should continue to operate short, pay attention to 3336-38 to suppress shorts, defend 3346, and look at 3300/3285 support.
Gold short-term trading: short near 3336, stop loss 3346, take profit 3300

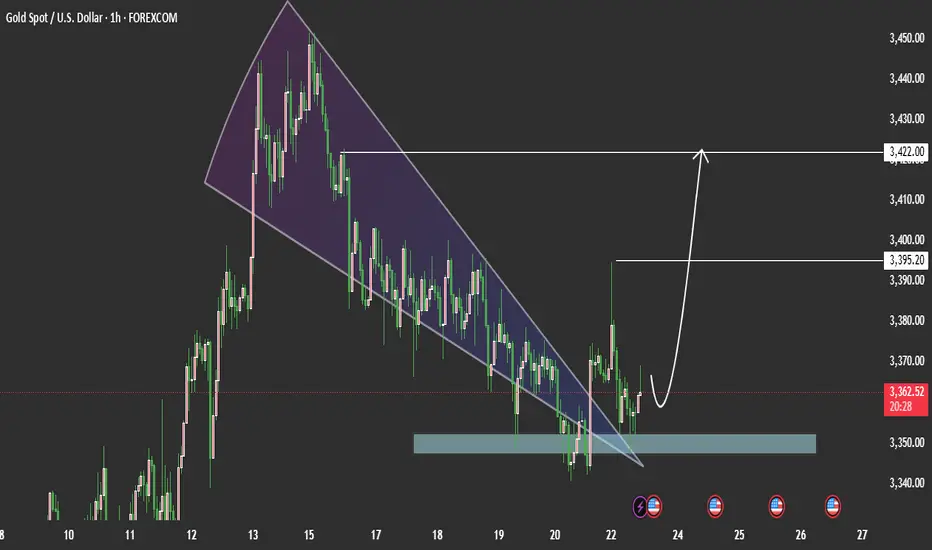
Gold) Technical Update – Market Subdued AheadXAUUSD Technical Update – Market Subdued Ahead of Key Data
Gold is currently trading with limited momentum, reflecting a subdued market sentiment despite escalating geopolitical tensions in the Middle East. Notably, the market has largely digested the recent U.S. airstrikes on Iranian nuclear facilities, showing a muted reaction to these developments.
Resistance levels 3395 / 3422
Support Levels 3355 /3350
Lets see more details in the chart Ps support with like and comments for more analysis Thanks
Report – June 23, 2025Geopolitical Shock: U.S. Strikes on Iran's Nuclear Sites Redefine Market Landscape
The Trump administration’s decision to authorize precision airstrikes on Iran’s nuclear facilities marks a major escalation in Middle East hostilities, significantly reshaping the global risk environment. Seven B-2 stealth bombers originating from Missouri carried out a long-range mission that deployed bunker-busting GBU-57 bombs on Iran’s underground nuclear installations in Fordow and Natanz. Additionally, Tomahawk cruise missiles launched from a U.S. submarine struck facilities in Isfahan. Pentagon officials describe “extremely severe damage,” though assessments remain preliminary. The attack also marks the first known combat use of the GBU-57, highlighting both the symbolic and tactical weight of the operation.
While the U.S. maintains it is not at war with Iran but targeting its nuclear program specifically, Iran's leadership views this as a red-line breach. Tehran's immediate retaliation has so far focused on Israeli targets, but broader reprisals against U.S. assets and personnel in the region appear imminent. The Revolutionary Guards and Houthi allies have threatened to strike U.S. vessels in the Red Sea and disrupt oil transit through the Strait of Hormuz, a critical chokepoint for global energy markets.
U.S. Secretary of State Marco Rubio stated that no additional strikes are planned unless American interests are targeted, yet the situation remains highly unstable. Trump’s narrative aims to project decisive strength while avoiding a prolonged conflict. However, whether this operation achieves a limited military objective or drags the U.S. into broader war remains uncertain.
Part 2: Energy Markets Under Siege – Oil Price Dynamics and Strategic Implications
The U.S. airstrikes on Iran have triggered a spike in oil prices as markets react to the heightened risk of regional escalation. West Texas Intermediate (WTI) and Brent crude futures climbed 2.5% and 2.4% respectively in early Asian trading, pricing in immediate geopolitical risk. Front-month Brent is now hovering around $78.89 per barrel, with analysts forecasting potential surges to $90–$100 per barrel should supply chains be disrupted, particularly through the Strait of Hormuz, the transit route for up to 30% of the world’s seaborne oil.
According to Danske Bank, a complete closure of the strait could slash global oil supply by over 18 million barrels per day, equivalent to nearly 20% of daily output. That would constitute the most severe supply shock since the 1970s oil crises. Phillip Nova and ANZ analysts stress that while prices have initially stabilized, much of the “war premium” has yet to fully materialize unless Iran retaliates aggressively or Western energy infrastructure is damaged.
OPEC+ spare capacity may act as a temporary buffer, but traders are increasingly positioning for long-term supply insecurity. The oil volatility index (OVX) has already surged to a five-year high, outpacing the VIX and reflecting concentrated hedging behavior via bullish options. Goldman Sachs reports an “extreme skew” in call options on crude futures, indicating strong institutional conviction for upward price movement.
Panmure Liberum projects that a sustained 20% increase in oil prices over the next three months could boost European energy sector returns by 7.8%, with EPS growth forecasts across the sector already at 18%. U.S. oil majors like Exxon Mobil, APA, Devon Energy, and Diamondback Energy are poised to benefit given their dividend discipline and asset-light structures. Exxon, for instance, is forecast to yield 3.5% while paying out ~60% of 2025 net income, higher than industry average but seen as sustainable in a $90 oil environment.
Part 3: Inflation Dynamics, Fed Strategy, and the Impact of Tariffs
Markets are navigating a complex monetary landscape as the Federal Reserve grapples with rising price pressures, many of which stem from tariff-induced cost increases and geopolitical instability. The next major indicator, May’s Personal Consumption Expenditures (PCE) data, is expected to show headline inflation at 2.3% year-on-year (up from 2.1% in April) and core PCE at 2.6% (from 2.5%). These figures, while modest, are significant because they suggest that President Trump’s April tariff hike is beginning to feed into real consumer prices.
Economists warn this is only the beginning. ING analysts describe the current calm as “the calm before the storm,” expecting tariff-driven price hikes to become visible from July onwards. If inflation accelerates further, it would seriously challenge the Fed’s ability to justify rate cuts, particularly as Powell continues to emphasize a “data-driven” and “risk-managed” approach.
Markets had been pricing in two rate cuts for 2025, beginning in October. However, stickier inflation and rising geopolitical risks make this increasingly uncertain. Powell recently admitted to being in a “very foggy time,” indicating that clear signals are lacking. Traders are now more cautious, and the Fed itself remains split: 10 out of 19 officials favor rate cuts this year, while 7 expect no cuts at all.
This divergence is exacerbated by real-world shocks, particularly Trump's foreign and trade policies. For example, the April 2 “Liberation Day” tariff package disrupted supply chains and added upward pressure on goods costs, despite some temporary demand surges as businesses front-loaded inventory. That trend has started to fade, and the inflationary effects are taking hold. Analysts like Krishna Guha of Evercore ISI suggest that unless the labor market deteriorates meaningfully, the Fed will be reluctant to stimulate and risk fueling further inflation.
Part 4: Global Trade Shifts, China’s Export Strategy, and the U.S.–China Financial Decoupling
In response to U.S. tariffs and geopolitical instability, China is aggressively reorienting its trade and capital strategies. Trade data shows a sharp decline in Chinese exports to the U.S., but a simultaneous and strategic pivot toward Europe, Southeast Asia, and the Middle East. In May, Chinese exports to Europe jumped 12% year-on-year, with Germany alone rising 22%, while shipments to Southeast Asia rose 15%. Factory owners across Zhejiang province, China’s second-largest exporter, are scrambling to secure new markets and insulate their operations from escalating U.S. trade barriers.
This shift is more than tactical, it reflects a structural decoupling from the American consumer market. Tariff rates on many Chinese goods remain above 50%, with fears that Trump may reinstate even more punitive measures. Factory managers report that U.S.-bound shipments now account for a shrinking share of their revenues, some dropping from 60% to 30% within a year. Manufacturers like Shaoxing Sulong Outdoor and Shaoxing Shangyu Lihua are expanding to Europe, the Middle East, and local e-commerce platforms.
The Chinese government is reinforcing this shift with subsidies for export credit insurance, trade fair attendance, and initiatives to promote domestic consumption of export-grade goods. Zhejiang province alone is nurturing 100,000 cross-border e-commerce sellers and partnering with supermarkets and online marketplaces to absorb unsold inventories.
Simultaneously, the financial relationship between the U.S. and Chinese markets is deteriorating rapidly. Since 2019, over 80 Chinese companies have delisted from U.S. exchanges. The NYSE and Nasdaq now host less than 2% of their capitalization from Chinese stocks, a dramatic decline from the heyday of IPOs like Alibaba’s in 2014. More recent listings have been small, speculative, and at times scandal-ridden, such as the collapse of Luckin Coffee.
Washington is actively pressuring U.S. pension funds and financial institutions to divest from Chinese companies. The SEC faces mounting pressure to ban firms with alleged ties to the Chinese Communist Party, slave labor, or national-security threats. Even China’s own regulators are pushing top companies like Shein and Didi to list in Hong Kong or remain private. As a result, Hong Kong has become the main IPO venue for major Chinese firms, aided ironically by Wall Street banks like JPMorgan and Bank of America.
This trade and financial decoupling underscores a broader geopolitical realignment, with profound implications for investors. The U.S.–China economic axis that once drove global growth is fracturing, and capital is flowing toward more politically aligned markets.
Part 5: Energy Markets, Oil Price Risks, and the U.S.–Iran Escalation
Following President Trump’s direct military strikes on Iran’s nuclear facilities, global oil markets are in a state of heightened alert. The initial operation involved B-2 bombers deploying 14 bunker-buster bombs on Fordow and other key nuclear sites, with additional cruise missiles launched from U.S. submarines. This first-ever combat use of the GBU-57 “Massive Ordnance Penetrator” demonstrates the severity of Washington’s commitment to dismantling Iran’s nuclear infrastructure without formally entering a prolonged war.
Despite Trump’s assertion that “we’re not at war with Iran,” Tehran and its proxies have begun retaliatory strikes, primarily against Israel for now. But threats from Iran’s Revolutionary Guard, potential disruptions in the Red Sea by Houthi forces, and calls in Tehran to shut the Strait of Hormuz raise red flags for global energy markets. The Strait handles 20–30% of the world’s oil flow, and its closure would amount to an 18 million barrels/day supply shock, nearly 20% of global output, per Danske Bank analysis.
The market’s reaction has been swift but measured. Brent crude surged to $78.89/bbl (+2.4%) and WTI to $75.67/bbl (+2.5%), as investors priced in a “war premium.” Yet the oil market remains in limbo: while sentiment is bullish, actual supply disruptions have not materialized. As CBA’s Vivek Dhar notes, the real driver of $100+ oil will be evidence of shipping blockades or facility destruction, not speculation alone. Brent at $90–95 is plausible in the event of retaliatory action by Iran.
Goldman Sachs’ analysis of three-month options skews shows the highest implied volatility for bullish calls versus bearish puts in 25 years. This reflects overwhelming investor demand for upside exposure, a rare pricing pattern signaling traders expect a substantial rally. ANZ and RBC Capital also highlight the rising risk of damage to Gulf infrastructure, which could catapult prices well beyond current levels.
Yet markets have shown remarkable resilience. The VIX remains muted compared to the 2023 tariff shock, while crude volatility (OVX) is spiking, indicating that energy markets are absorbing geopolitical risk far more intensely than equities. This divergence implies that energy stocks and commodities could outperform broader indices in the event of further escalation.
Strategically, investors are rotating into dividend-paying oil stocks with solid fundamentals. APA (yield 4.9%), Diamondback (2.6%), Devon (2.8%), and Permian Resources (4.1%) all pay less than 40% of 2025 net income in dividends and offer upside if oil prices remain above $70. ExxonMobil, yielding 3.5%, is more leveraged to price but offers size and balance sheet strength. Canadian producers like ARC Resources (2.4% yield, aggressive buybacks) are also drawing attention due to flexible capital strategies.
Conclusion: The energy sector is now a frontline investment space in geopolitical strategy. While oil may already reflect a partial war premium, any actual disruption, particularly in Hormuz, will send prices sharply higher, potentially reigniting inflation and delaying Fed rate cuts. Investors should be prepared for volatility, but also opportunity, especially in energy equities and structured trades such as call spreads on ETFs like USO.
Part 6: Market Reaction, Credit Liquidity, and Investor Positioning Under Geopolitical and Policy Stress
The intensifying geopolitical turmoil, centered around Trump’s strikes on Iran’s nuclear program, has not yet catalyzed a market crash, but beneath the surface, cracks are forming in credit spreads, investor sentiment, and sector participation. The S&P 500, while only 3% off its all-time high, is displaying signs of internal weakness masked by headline stability. Over the past two weeks, the index has traded in a narrow 1.8-point range, the tightest since December 2024.
This tightness reflects both indecision and complacency. While major indices remain resilient, a concerning breadth divergence is emerging. Fundstrat’s Mark Newton reports that the percentage of S&P 500 stocks trading above their 200-day moving average has slipped below 50%, and just under 40% are above their 20-day average. The equal-weighted S&P 500 ETF is down 1.5% over the past month, while tech-driven cap-weighted indices remain buoyant, suggesting fragility if megacaps falter.
Volatility metrics confirm the growing divergence. The Cboe Crude Oil ETF Volatility Index has spiked to near five-year highs, while the equity VIX remains muted. This divergence, as noted by Citi’s Scott Chronert, shows how geopolitical risk is being priced into oil, not equities, a phenomenon that cannot persist indefinitely. Quant Insight notes a waning correlation between the VIX and S&P 500 moves, suggesting that risk appetite is higher than it appears, or that equity markets are underestimating tail risks.
On the macro front, the Fed’s wait-and-see posture continues, with Powell reiterating uncertainty over the inflation trajectory amid tariff pressures. While headline CPI for May came in at 2.4%, below expectations, core PCE, the Fed’s preferred inflation gauge, is expected to tick up to 2.6% in May from 2.5% in April. Analysts, including ING, warn this may be the “calm before the storm,” as July’s data begins to reflect full tariff pass-through. The futures market is still pricing in two rate cuts this year, beginning in October, but expectations remain fragile and data-dependent.
Credit markets are showing early signs of tightening. Though no full-scale panic is evident yet, spreads on lower-grade debt have widened modestly as investors reassess risk in a stagflationary environment. Liquidity remains thin in parts of the high-yield market, and primary issuance has slowed. In contrast, investment-grade debt, especially from oil majors and defense contractors, is gaining interest as investors reposition portfolios to benefit from war-driven fiscal priorities.
Internationally, appetite for the U.S. dollar has diminished in Asia, per DBS strategists. Asian currencies like the SGD and HKD have appreciated, reflecting inflows as investors diversify away from dollar assets. Meanwhile, Japanese government bonds (JGBs) have seen heightened demand, with yields falling across the curve following a strong 5-year auction. The BOJ is not expected to raise rates aggressively, keeping Japanese yields attractive amid global uncertainty.
Conclusion: The global financial system is at a precarious crossroads. Equities are holding, but under the surface, technical deterioration and volatility divergence are flashing warning signs. Fixed income markets are rotating into quality, especially defense- and energy-related names. Liquidity is tightening slowly, with further stress likely if oil breaches $90 or core inflation surprises to the upside.
Part 7: Sector-Specific Analysis, Strategic Positioning, and Outlook for the Week Ahead
As geopolitical uncertainty and policy ambiguity persist, investors are increasingly turning to select sectors and assets that offer resilience, strategic leverage, or asymmetrical upside. Below is a breakdown of how key sectors are positioned and what the market dynamics suggest for the coming days and weeks:
1. Energy Sector: Oil’s Strategic Premium
With the U.S. bombing of Iranian nuclear sites and Tehran’s potential retaliation, including threats to close the Strait of Hormuz, oil markets are on edge. Brent futures are up 2.4% at $78.89, while WTI has jumped to $75.67. Analysts including CBA’s Vivek Dhar see $100/barrel as a viable short-term target if Iran substantially disrupts shipping.
ANZ’s Daniel Hynes notes a supply shock could push oil to $90–$95/barrel. Danske Bank warns that a full Hormuz closure would cut global supply by nearly 20 million barrels/day, almost 20% of the total. This dwarfs past supply shocks and would be catastrophic for both inflation and industrial production globally.
Investor Strategy: Focus on large, low-cost producers with strong dividend policies and hedging flexibility:
Exxon Mobil (XOM): 3.5% yield, diversified base, strong dividend coverage.
APA & Diamondback (FANG): Payouts below 40% of earnings, asset returns aligned with industry averages.
Permian Resources (PR) & Devon Energy (DVN): U.S.-centric and operationally nimble.
Canadian producers like ARC Resources also offer supplemental upside, blending modest yields (2.4%) with capital returns via buybacks.
2. Defense & Aerospace: War-Driven Tailwinds
With the U.S. explicitly targeting Iran’s nuclear infrastructure using B-2 bombers and GBU-57 bunker busters, defense stocks are gaining renewed attention. The U.S. is unlikely to launch further strikes unless provoked, but the scale of this preemptive action elevates long-term defense spending prospects.
Investor Strategy: Defense majors such as Raytheon (RTX), Lockheed Martin (LMT), and Northrop Grumman (NOC) benefit from this new operational reality. The U.S. is already building out missile defense in the Middle East, while allies like Israel are expected to increase their defense procurements, potentially financed with U.S. foreign aid.
3. Technology: Internals Weakening Amid Breadth Divergence
Despite megacap tech keeping indices afloat, breadth is deteriorating. Over 60% of S&P 500 stocks now trade below their 50-day moving averages. The equal-weighted S&P 500 is down 1.5% in the past month vs. a 3% rise in tech-focused ETFs.
Investor Strategy: Exercise caution with overexposed names. Consider reallocating toward:
Broadcom (AVGO) and Nvidia (NVDA): For AI exposure, but take partial profits.
Shift some exposure into infrastructure tech or AI-software-as-a-service plays with earnings durability but lower valuations (e.g., Salesforce (CRM)).
4. Small-Caps and International Equities: Tactical Diversification
Domestic small-cap stocks continue to underperform, but foreign small-caps, especially in non-tariff-affected sectors, offer compelling value. Funds like Brandes International Small Cap and Avantis International Small-Cap Value ETF are outperforming with annualized returns over 15%.
Managers are targeting niche names such as:
Magyar Telekom (Hungary) – 50% market share, local monopoly.
Japan Elevator Service Holdings – strong growth, 23% profit margins.
Investor Strategy: Use actively managed vehicles with deep on-the-ground research or ETFs with proven quantitative screens.
5. Credit & Bonds: Return to Quality
With the Fed cautious on rate cuts amid reaccelerating inflation, bond investors are shifting back to high-quality, longer-duration instruments. Corporate credit is showing early-stage stress, particularly in lower tranches.
Investor Strategy:
Focus on investment-grade debt, especially from oil and defense issuers.
Allocate to long-duration Treasuries for capital protection.
Avoid high-yield for now unless oil prices breach $90 sustainably.
6. Vaccine & Pharma Sector: Under Pressure from Political Appointments
RFK Jr.'s appointment and the firing of the immunization advisory committee has spooked biotech investors. Stocks like Moderna and Novavax are down 36% and 18%, respectively. Merck, though not a pure play, is down 17% as fears grow that existing recommendations (e.g., Gardasil) could be rolled back.
Investor Strategy: Caution is warranted. Some companies may benefit long-term if the FDA holds the line, but political risks will weigh heavily in the short term. Look to companies with broad portfolios and global exposure.
7. AI & Regulation: Big Tech’s Shield
Big Tech is lobbying for a 10-year federal ban on state-level AI regulation. If passed, this would shield companies like Amazon, Google, Microsoft, and Meta from fragmented compliance costs. Critics call it a power grab, but the budget bill’s passage by July 4 would solidify their advantage.
Investor Strategy: Maintain core positions but expect growing scrutiny. Midcap AI companies may benefit from looser oversight and acquisition potential.
8. China Trade & Delistings: Fragmenting Global Markets
More than 80 Chinese companies have delisted from U.S. exchanges since 2019. Delisting pressures are accelerating amid scrutiny over VIE structures and national security concerns. While some IPOs continue on Nasdaq, most are speculative and illiquid.
Investor Strategy: Reduce exposure to U.S.-listed Chinese ADRs. Instead, access Chinese growth via Hong Kong listings or multinational partners (e.g., Samsung, Taiwan Semiconductor).
Macro Summary: Risk-Reward Outlook
Bullish Forces: Oil supply shock potential, defense spending, tech lobbying gains.
Bearish Forces: Inflation upside risk, Fed delay, tariff pass-through, credit deterioration.
Neutral/Mixed: Equity index stability masking internal weakness.
Part 8: Portfolio Positioning, Asset Allocation, and Thematic Strategy for the Weeks Ahead
With the macro landscape defined by geopolitical escalation, domestic political uncertainty, and global supply-side risk, investors face an increasingly bifurcated environment—one where aggregate indices appear calm, but sector-specific volatility and dispersion are rising. As a senior analyst advising institutional portfolios, I recommend the following strategic blueprint:
1. Recommended Portfolio Allocation (Short-Term Tactical Tilt)
Asset Class Weighting (%) Change Rationale
U.S. Equities 35 ▼ Breadth deterioration and tech overextension. Favor quality over growth.
International Equities 20 ▲ Hedge against USD volatility. Favor Europe ex-UK, Japan, and small-caps.
Energy & Commodities 15 ▲▲ Brent-WTI divergence and Hormuz risk support overweight.
Bonds (IG + Duration) 20 ▲ Rates on hold, but inflation limits downside. Extend quality duration.
Cash / Short Duration 5 — Maintain dry powder for dislocations.
Alternatives (AI, Infra, Private Credit) 5 ▲ Focus on uncorrelated return streams.
2. Equity Sector Positioning
Overweight:
Defense & Aerospace: Geopolitical risk justifies premium. Lockheed Martin, Northrop, RTX.
Energy/Oil: Strong cash flows, resilient dividends. Exxon, Chevron, APA, Devon.
International Small Cap Value: Strong relative returns, less tariff exposure. Brandes, Avantis, Pzena.
Neutral:
Mega-Cap Tech: Maintain core exposure but rebalance to reduce momentum risk.
Industrial Cyclicals: Mixed macro signals. Exposure through diversified ETFs preferred.
Underweight:
Consumer Discretionary: Inflation sticky, credit card delinquencies rising.
Biotech/Vaccine: Regulatory overhang, sentiment risk from RFK Jr. policies.
3. Fixed Income Guidance
Duration: Increase duration cautiously. Prefer U.S. Treasuries and munis with >7-year tenor.
Credit: Focus on investment grade. Avoid HY unless oil stays >$90/bbl.
Inflation Protection: Position in short/intermediate TIPS to hedge against tariff-related CPI pressure.
4. Tactical Thematic Plays
Strait of Hormuz Shock Hedge:
Buy USO ETF Aug $84–$94 call spread for high upside/defined loss.
Overlay with short Aug $75 puts for those comfortable owning on a pullback.
AI Lobbying Success:
Long MSFT, AMZN, GOOGL, especially if Senate passes regulatory moratorium.
Mid-cap AI names (Palantir, Snowflake) as tactical trades.
China De-Exposure:
Rotate from ADRs to HKEX listings or U.S. multinationals with China-lite exposure.
Consider India or Vietnam ETFs as structural beneficiaries of decoupling.
Defense of Democracy Theme:
Long nuclear, aerospace, cyberdefense (BWX Technologies, Cameco, Palantir).
Cameco AP1000 export boost = significant EPS uplift in Q2.
Credit-Card Squeeze:
Avoid heavily consumer-exposed banks.
Monitor delinquency rates; shift to non-bank lenders or fintechs with better risk models.
5. Policy Event Calendar (Key Risk Dates)
Event Date Impact
Iran Retaliation Window Next 5–10 days High – Oil spike, market risk-off
FOMC Commentary & PCE Data June 28, 2025 Medium – Market path for Sept/Oct rate cuts
Trump Tariff Signing Deadline July 9, 2025 High – CPI spike trigger, inflation repricing
Senate Budget Finalization July 4, 2025 Medium – Tech regulatory outlook clarity
Eurozone PMI & ECB Presser June 25–28, 2025 Medium – EUR/USD, global growth confidence

XAU/USD: Market Dynamics Analysis and Trading StrategiesI. Market Trends and Sentiment Analysis
Driven by the U.S. military intervention in the Middle East conflict, gold exhibited violent fluctuations of "gap-up opening followed by rapid correction" in early trading:
- Price Performance: After gapping up to $3,395/oz, the intraday maximum decline approached $50, hitting a low of $3,347 and currently trading around $3,355—reflecting intense battles between bulls and bears at key levels.
- Sentiment Drivers: While risk aversion boosted safe-haven demand, short-term corrections were jointly triggered by profit-taking from prior long positions and institutional market-washing maneuvers. Note that the weekly "bull-bear alternating" volatility pattern remains intact, with no unilateral trend established yet.
II. Technical Key Levels and Trend Qualification
1. Support & Resistance Structure
- Strong Support: $3,340–$3,350 range (confluence of May’s low and 60-day moving average), a bottom platform tested three times in the past two weeks with robust buying support.
- Short-term Resistance: $3,375–$3,380 (lower edge of the early gap + 4-hour Bollinger Band midline), with a breakthrough targeting the $3,400 psychological level.
2. Cycle Pattern Analysis
- Weekly Frame: Two consecutive weeks of alternating bull/bear candlesticks, with RSI anchored in the 50–60 neutral zone, indicating ongoing tug-of-war between long/short forces.
- Daily Frame: Today’s correction held above the prior low of $3,340, forming a "long lower-shadow bearish candlestick"—signaling active buying at lows and suggesting the correction may be nearing conclusion.
III. Trading Strategy: Capitalize on Correction Entries
- Entry Zone: Layered long positions at $3,340–$3,350, with $3,340 as the invalidation stop (shift to neutral if breached).
- Target Levels: Initial target at $3,375–$3,380 (short-term profit-taking), with a break above eyeing $3,400 (mid-to-long-term target).
- Trading Logic: Support validity + weekly range-bound bullish bias, with corrections viewed as benign within the broader trend.
IV. Risk Controls & Operational Notes
- No Chasing Shorts: The current correction is a technical retracement within the uptrend; chasing shorts risks falling into a "bear trap".
- Dynamic Monitoring: Closely track the $3,340 support threshold and evolving Middle East developments.
XAUUSD
buy@3340-3350
tp:3365-3375
I am committed to sharing trading signals every day. Among them, real-time signals will be flexibly pushed according to market dynamics. All the signals sent out last week accurately matched the market trends, helping numerous traders achieve substantial profits. Regardless of your previous investment performance, I believe that with the support of my professional strategies and timely signals, I will surely be able to assist you in breaking through investment bottlenecks and achieving new breakthroughs in the trading field.

DXY: WARLORDS.We are in a sticky situation as Trump ordered strikes against Iran during the weekend which was bound to shake up the foreign exchange market.Thats the major reason for volatility witnessed today during early sessions.
And like the warlords it time to make money.There is still little information to work with so we will wait till New York session to see if there will be signs of uptick in DXY. Fired up for the new week.Bullish on dollar and traditional safe havens.

XAUUSD M15 I Bearish ReversalBased on the M15 chart, the price is trading near our sell entry level at 3367-3365, a pullback resistance that aligns closely with the 38.2% Fib retracement.
Our take profit is set at 3346.73, a pullback support.
The stop loss is set at 3384.55, a pullback resistance.
High Risk Investment Warning
Trading Forex/CFDs on margin carries a high level of risk and may not be suitable for all investors. Leverage can work against you.
Stratos Markets Limited (tradu.com ):
CFDs are complex instruments and come with a high risk of losing money rapidly due to leverage. 63% of retail investor accounts lose money when trading CFDs with this provider. You should consider whether you understand how CFDs work and whether you can afford to take the high risk of losing your money.
Stratos Europe Ltd (tradu.com ):
CFDs are complex instruments and come with a high risk of losing money rapidly due to leverage. 63% of retail investor accounts lose money when trading CFDs with this provider. You should consider whether you understand how CFDs work and whether you can afford to take the high risk of losing your money.
Stratos Global LLC (tradu.com ):
Losses can exceed deposits.
Please be advised that the information presented on TradingView is provided to Tradu (‘Company’, ‘we’) by a third-party provider (‘TFA Global Pte Ltd’). Please be reminded that you are solely responsible for the trading decisions on your account. There is a very high degree of risk involved in trading. Any information and/or content is intended entirely for research, educational and informational purposes only and does not constitute investment or consultation advice or investment strategy. The information is not tailored to the investment needs of any specific person and therefore does not involve a consideration of any of the investment objectives, financial situation or needs of any viewer that may receive it. Kindly also note that past performance is not a reliable indicator of future results. Actual results may differ materially from those anticipated in forward-looking or past performance statements. We assume no liability as to the accuracy or completeness of any of the information and/or content provided herein and the Company cannot be held responsible for any omission, mistake nor for any loss or damage including without limitation to any loss of profit which may arise from reliance on any information supplied by TFA Global Pte Ltd.
The speaker(s) is neither an employee, agent nor representative of Tradu and is therefore acting independently. The opinions given are their own, constitute general market commentary, and do not constitute the opinion or advice of Tradu or any form of personal or investment advice. Tradu neither endorses nor guarantees offerings of third-party speakers, nor is Tradu responsible for the content, veracity or opinions of third-party speakers, presenters or participants.

Weekend Report – June 21, 2025US FEDERAL RESERVE SPLIT: POLICY AT A CROSSROADS:
The US Federal Reserve stands increasingly divided over the trajectory of interest rates, with significant macro implications. Fed Governor Christopher Waller, viewed as a top contender to succeed Jerome Powell, called for a rate cut as early as the next meeting, citing muted inflationary pressure despite Donald Trump's new tariff regime. This position contrasts sharply with Powell’s own tone, which remains cautious amid a lack of definitive economic signals.
The Fed has now paused for four straight meetings following 100 bps of cuts in 2024. However, the so-called "dot plot" released this week reveals increasing internal disagreement: 10 Fed officials project two or more cuts, while seven see no rate moves at all. Futures markets reflect expectations of two quarter-point cuts in 2025, starting around October, suggesting investors believe inflation remains contained despite trade protectionism.
Waller's comments underscore growing Fed discomfort with political pressure. Trump has called for 250 bps in cuts and publicly derided Powell, adding to uncertainty about the Fed's independence heading into an election cycle. While Powell emphasized “anchored long-term inflation expectations” and said divergence would “diminish with data,” the Fed’s credibility remains sensitive to both political intervention and market interpretation.
SWISS INHERITANCE TAX POLL TRIGGERS CAPITAL FLIGHT RISK:
Switzerland faces reputational and financial damage ahead of a national vote in November to introduce a 50% inheritance tax on estates above SFr50 million. The proposal—originating from the far-left Young Socialists—is spurring warnings of an exodus of UHNWIs, reminiscent of the UK’s non-dom exodus.
Legal and private banking professionals report that families are already relocating to Italy, Greece, and the UAE, fearing that even the proposal introduces dangerous legal and fiscal uncertainty. Prominent voices in Geneva and Zurich warn this could irreparably harm Switzerland’s wealth management brand and weaken its position amid competition from zero-tax jurisdictions like Dubai and Hong Kong.
SUDAN’S GOLD SURGE FINANCES WARFARE:
Sudan’s ongoing civil war is being underwritten by soaring artisanal gold production, driven by record-high bullion prices. Output hit 80 tonnes in 2024, worth over $6 billion, much of it smuggled to the UAE and Russia. This illicit supply chain funds both the SAF and RSF factions in a war that has killed 150,000 and displaced 12 million people.
International think tanks such as Chatham House and C4ADS warn of deeply entrenched militarized trade networks and argue that the West has failed to address mineral revenue flows with sanctions or regulatory frameworks. Analysts suggest that targeting gold supply chains could represent a powerful pressure point in ending the conflict.
BBC THREATENS AI STARTUP OVER CONTENT MISUSE:
The BBC has issued a legal ultimatum to Perplexity AI, accusing the $14 billion-valued US AI search engine of unlawfully scraping and reproducing BBC content. In a formal letter, the BBC demanded deletion of scraped material and financial compensation, citing reputational damage and copyright violations.
This marks the UK broadcaster’s first aggressive stance against AI scraping, as public sector institutions grow wary of being used to train large language models without remuneration or consent. While Perplexity dismissed the claim as “manipulative,” this could signal a broader wave of litigation across media institutions echoing ongoing legal battles from News Corp, The New York Times, and Condé Nast.
APOLLO BOLSTERS UK NUCLEAR BUILDOUT WITH £4.5BN LOAN:
US private capital giant Apollo has agreed to fund £4.5bn in unsecured debt to EDF’s delayed Hinkley Point C project in Somerset, easing pressure on a project whose costs have ballooned from £18bn to £46bn, with a new opening date set for 2029. The loan, at ~7% interest, addresses a shortfall following the UK’s ejection of China General Nuclear in 2023.
The deal is a win for private credit’s emergence in public infrastructure, and a major boost to the UK’s push for baseload, low-carbon energy independence. EDF will now focus on France, while UK officials prepare to approve another £11.5bn investment into Sizewell C, to be discussed at a Franco-British summit in July.
MIDDLE EAST CONFLICT DRIVES ENERGY VOLATILITY AND RISK REPRICING:
The geopolitical crisis between Israel and Iran continues to drive extreme price movements in energy and logistics. Brent crude briefly surged to $79 per barrel, up 10% from the previous week after Israeli strikes on Iranian nuclear infrastructure. Though prices have since retraced to $76.66, volatility remains elevated due to uncertainty over supply routes.
VLCC charter rates from the Gulf to China more than doubled from $19,998 to $47,609 per day within a week, with owners holding out for further gains. Rates for LR2 product tankers also surged to $51,879 per day. This reflects a possible market shift away from Iran’s dark fleet toward fully insured routes, which could lead to persistent tightness in freight availability.
Global markets responded to tentative diplomatic outreach. European equities rallied, with Frankfurt’s DAX up 1.3%, while the FTSE 100 fell 0.2% on weak UK retail data. The VIX dropped 8%, but investor caution remains as supply chain risks through the Strait of Hormuz—transiting 30% of global seaborne crude loom large.
EU-CHINA TENSIONS ESCALATE IN MEDTECH SECTOR:
The European Commission announced that Chinese companies will be excluded from public procurement of medical devices on contracts exceeding €5 million. This move, enabled by the International Procurement Instrument, comes after EU investigations concluded 87% of Chinese contracts discriminate against EU suppliers.
With EU-China tensions already inflamed by tariffs on EVs and spirits, this marks a pivot toward strategic reciprocity. China condemned the measure as “protectionism” and threatened countermeasures. The Commission remains open to lifting the restrictions should Beijing provide market access parity. This signals to global investors a tightening regulatory environment for Chinese participation in critical EU sectors.
US CLEAN ENERGY FACES POST-TRUMP CLIFF:
The Biden-era clean energy boom is facing a rapid reversal. Major solar providers like Sunnova and Mosaic have filed for bankruptcy, as proposed Congressional tax legislation threatens to slash key residential solar credits. Industry leaders predict a 50–60% demand collapse and up to 250,000 job losses if cuts proceed.
Markets are already repricing: Sunrun shares dropped 36%, Enphase 21%, SolarEdge 30%, and First Solar 19% in recent days. With at least nine bankruptcies in 2025, compared to 16 in all of 2024, the sector’s liquidity is at breaking point. The Solar Energy Industries Association warns of a “six-month cliff” ahead, as the Trump administration pivots toward oil, biofuels, and nuclear.
X CORP PUSHES INTO FINANCIAL SERVICES:
Elon Musk’s X (formerly Twitter) is accelerating its push to become an “everything app” akin to China’s WeChat. CEO Linda Yaccarino announced plans to launch peer-to-peer payments, trading, and even debit cards this year via X Money, beginning in the US with Visa integration.
While this could revolutionize user engagement and monetization, analysts warn of regulatory risks including compliance with anti-money laundering, KYC, and financial licensing laws. Notably, X is seeking to recover its ad business post-Musk acquisition 96% of advertisers have reportedly returned, though 2025 revenue forecasts ($2.3bn) remain far below 2022 levels ($4.1bn).
MICROSOFT VS OPENAI: EQUITY BATTLE INTENSIFIES:
Microsoft is reportedly prepared to walk away from equity renegotiations with OpenAI if no favorable deal is reached. While the partnership remains in “good faith,” Microsoft wants to retain its 20% revenue share up to $92bn, exclusive Azure distribution rights, and access to OpenAI’s IP pre-AGI.
OpenAI needs Microsoft’s approval to finalize its for-profit restructuring, without which it risks losing funding commitments from SoftBank and others. This adds pressure to an already fragile alliance amid infrastructure capacity constraints and competition from xAI and Meta’s Llama. Market attention now shifts to whether OpenAI’s valuation premium holds if Microsoft pivots to broader AI diversification.
NOVO NORDISK SURGES ON OBESITY PIPELINE STRENGTH:
Novo Nordisk has announced early-stage trial results for amycretin, a new obesity drug that caused 24.3% weight loss in its injectable form, surpassing both Wegovy and Eli Lilly’s Zepbound. The pill version delivered 13.1% loss, with the potential to match injectables over longer durations.
Novo is aiming to regain investor confidence after disappointing CagriSema trials last year. Shares, down over 50% YoY, may rebound as the company expands its anti-obesity portfolio. Analysts say amycretin could rival Lilly’s orforglipron, which showed 14.7% weight loss over 36 weeks in Phase 2 trials.
NIGER NATIONALIZES URANIUM ASSETS AMID GEOPOLITICAL SHIFT:
Niger has moved to nationalize the Somair uranium project, co-owned with France’s Orano, amid deteriorating diplomatic ties. The junta accuses Orano of failing to transfer funds and actively undermining the state. Compensation will be offered, but France's influence in Niger’s resource sector is likely to decline.
This follows a trend of state asset seizures in the Sahel, with Mali and Burkina Faso asserting more control over mining ventures. Orano is reportedly seeking to sell its Niger assets, possibly to Russian or Chinese interests. The move adds a new geopolitical risk layer to nuclear energy supply chains.
AUSTAL SHIPYARD TAKEOVER POSES SECURITY DEBATE:
South Korea’s Hanwha is seeking to increase its stake in Australian defense shipbuilder Austal to 19.9%, raising national security concerns. While CFIUS has cleared the deal in the US, Australia’s FIRB may block it, given Austal’s pivotal role in naval procurement. CEO Paddy Gregg said foreign ownership would conflict with Canberra’s “sovereignty-first” strategy outlined in its 2023 defense review.
While US officials favor Hanwha’s role in joint shipbuilding initiatives, Australia must weigh alliance integration against domestic capability protection. This debate reflects broader defense industrial shifts in the Indo-Pacific amid growing Chinese naval assertiveness.

Gold Drops Sharply as Risk Appetite ReturnsGlobal gold prices extended their sharp decline into the final trading session of the week, sliding more than 1.5% and pausing around $3,274/oz as safe-haven sentiment continues to erode.
📰 What’s driving the sell-off?
The primary trigger is the official signing of a trade agreement between the US and China, marking the end of a prolonged trade standoff. US Commerce Secretary confirmed that more agreements will follow before the July 9 deadline, including a commitment by China to supply rare earths to the US. This announcement sparked broad optimism across global markets, significantly reducing demand for safe-haven assets like gold.
Geopolitics also turned more constructive. Iran has expressed diplomatic goodwill, with its UN representative stating the country is ready to negotiate a regional nuclear coalition if a deal with Washington is reached. Meanwhile, Al Arabiya reported that the Israel–Gaza conflict may conclude within two weeks, further lowering geopolitical tensions.
On the data front, US economic indicators continue to surprise to the upside. Core PCE rose 2.7% YoY in May, beating forecasts, while durable goods orders and jobless claims both reflected strength in the US economy. Still, Minneapolis Fed President Neel Kashkari reiterated that two rate cuts are likely in 2025, suggesting the Fed remains open to easing once inflation cools further.
🔍 Technical outlook
Gold has broken below the key $3,330 support, confirming a short-term bearish structure. If the correction continues, the next levels to watch are $3,245, and more critically, the $3,200 zone.
In the short term, gold faces downside risk due to improving global economic sentiment and easing geopolitical threats. However, over the medium to long term, Fed policy shifts and unforeseen geopolitical events could still reverse the current trend.
Stay alert, watch the charts, and trade smart.
Have a great weekend, everyone! 🌍📊

GOLD Trading Opportunity! BUY!
My dear subscribers,
GOLD looks like it will make a good move, and here are the details:
The market is trading on 3270.6 pivot level.
Bias - Bullish
My Stop Loss - 3260.7
Technical Indicators: Both Super Trend & Pivot HL indicate a highly probable Bullish continuation.
Target - 3289.4
About Used Indicators:
The average true range (ATR) plays an important role in 'Supertrend' as the indicator uses ATR to calculate its value. The ATR indicator signals the degree of price volatility.
Disclosure: I am part of Trade Nation's Influencer program and receive a monthly fee for using their TradingView charts in my analysis.
———————————
WISH YOU ALL LUCK
