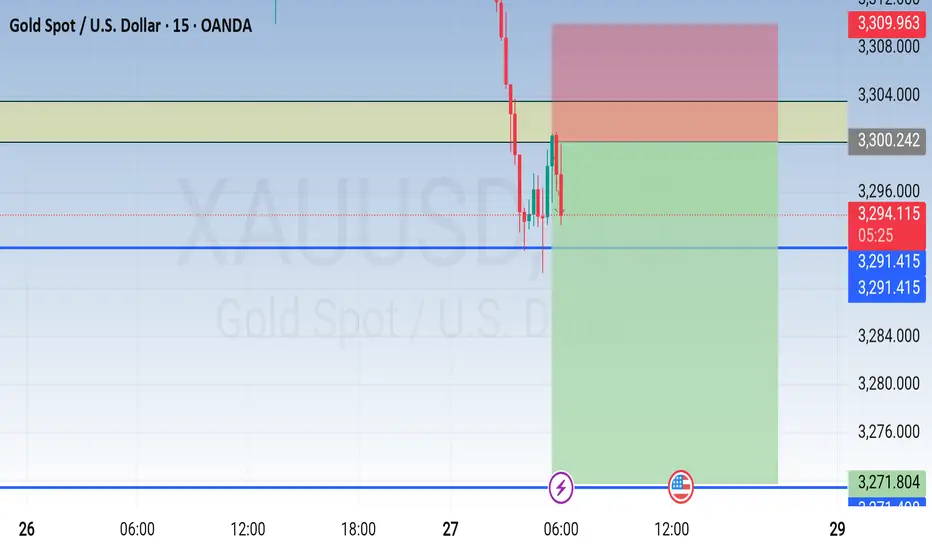
Gold move Account to my analysis this move possible gold running caratly said war and selling area 3300 o reach 3270
GOLDMINICFD trade ideas
A promising uptrend ,so we wait untill the market test the area Actually if the market breaks the area of support at 3134.713, we might look for another buying opportunity at 2972.951. we will wait for the confirmation OANDA:XAUUSD on our daily chart

GOLD US10Y went up high 4.332% before dropping to 4.291%,while gold on Asian open we have seen a drop from 3339 into 3333 on structure +ema+sma strategy creating a quick 50pips gain.
the goal is top layer broken demand floor for short sell correction.

Extra, pre market — June 25, 2025Global financial markets mounted a broad-based relief rally as geopolitical tensions in the Middle East eased significantly following a ceasefire between Israel and Iran. The U.S.-brokered truce, while fragile, has triggered a visible return to risk appetite across equity, fixed income, and currency markets. U.S. President Donald Trump, despite playing a central role in halting the conflict, publicly rebuked both Israel and Iran for violations, urging Israel via Truth Social to “BRING YOUR PILOTS HOME, NOW!” This unusual stance appears to have stabilized sentiment across asset classes, at least for now.
U.S. equity markets responded favorably to the geopolitical de-escalation. The Dow Jones Industrial Average surged by +507.24 points (+1.2%) to close at 43,089.02, while the Nasdaq 100 added +334.19 points (+1.5%) to end at 22,190.52. The S&P 500 rose +67.01 points (+1.1%), settling at 6,092.18 (Screenshot_1.png). The Russell 2000 also climbed +1.1%, driven by renewed confidence in domestic cyclicals. Volatility sharply dropped, with the CBOE VIX Index falling -11.9% to 17.48, indicating a lower perceived risk premium.
Sector rotation was pronounced. Technology (XLK) led with a +1.8% gain to $247.24, closely followed by Financials (XLF) at +1.5%, and Communications (XLC) at +1.3%. In contrast, Energy (XLE) sank -1.3% to $84.91, weighed down by falling oil prices, and Consumer Staples (XLP) edged down slightly by -0.1% (Screenshot_1.png). Investors appeared to rotate out of defensive sectors into higher-beta growth plays, signaling a risk-on tone.
The sector divergence was matched by style factor dispersion. On a relative basis, Private Equity (PSP/SPY) outperformed all other factors with a +1.2% daily move, followed by IPOs (IPO/SPY) at +0.9% and Hedge Funds (GURU/SPY) at +0.6% (Screenshot_6.png). Among equity styles, Small-Cap Growth (IJT/SPY) posted a +0.6% relative return, while Value (IVE/SPY) and Low Volatility (USMV/SPY) underperformed at -0.3% and -0.6% respectively. This points to growing investor confidence in higher-risk, higher-reward assets, likely fueled by reduced macro stress.
The relief was also evident in global bond markets. U.S. Treasury yields declined modestly as demand for duration returned. The 10-year yield (US10Y) closed at 4.298%, down from earlier June highs, while the 2-year (US2Y) yield dropped to 3.797% (Screenshot_5.png). European yields followed suit: Germany’s 10Y Bund yield dropped to 2.144%, and the UK Gilt yield hovered at 4.475%. Notably, Japanese 10Y yields have increased to 1.404%, up 22.88% YTD, signaling shifting monetary dynamics in Asia.
Credit markets remained resilient. On a year-to-date basis, Local Emerging Market Bonds (EMLC) are outperforming with an 11.3% return, followed by USD Emerging Market Debt (EMB +6.9%), and Convertibles (CWB +5.2%). U.S. Corporate bonds continued to benefit from carry and spread compression, with High Yield (HYG) and Investment Grade (LQD) both showing solid inflows and positive performance (Screenshot_4.png). Fixed income appears to be balancing carry with renewed duration appeal amid easing geopolitical risk and softer Fed expectations.
Commodities, particularly energy, experienced sharp reversals. WTI Crude Oil (CL1) and Brent Crude (CO1) fell 6.0% and 6.1% respectively, closing at $64.37 and $67.14 (Screenshot_7.png). This move reflects the de-escalation in the Strait of Hormuz risk and was compounded by Trump's call to "DRILL, BABY, DRILL!!!"—signaling a political push for increased U.S. production. Gold, meanwhile, retreated slightly to $3,328.22 (-0.1%), though remains up 28.4% YTD, having benefited from haven flows during the height of the conflict. Silver saw a similar retreat to $35.74 (-0.5%), though retains a +23.6% YTD gain.
In foreign exchange, the U.S. dollar weakened across major pairs as safe-haven demand declined. The EUR/USD rose to 1.1606 (+8.5% YTD), while the GBP/USD reached 1.3612 (+7.6% YTD). In contrast, the USD/JPY fell to 145.75, marking a -8.7% YTD decline (Screenshot_10.png). The reversal in dollar strength aligns with broader global reflation trades and a moderation in Fed hawkishness, supported by Chair Powell’s comments that the U.S. economy remains “solid” and that tariff impacts may be more muted than feared.
On a global equity level, YTD returns tell a diverse story. Latin America continues to dominate, with Argentina (ARGT +54.2%), Brazil (EWZ +22.6%), and Mexico (EWW +22.0%) leading gains (Screenshot_9.png). Among developed markets, Canada (EWC +27.5%) and Germany (EWG +18.7%) outshine, whereas Turkey (TUR -25.2%) and India (PIN -0.75%) lag meaningfully. In Asia, South Korea (EWY +14.8%) and Taiwan (EWT +13.6%) saw notable performance, bolstered by strength in tech exports and domestic policy easing.
Looking ahead, the sustainability of this rally depends on several unresolved variables. First, the Middle East ceasefire, while currently holding, is inherently fragile. Any renewed hostilities could spike volatility and reverse energy price trends rapidly. Second, the Fed remains in a delicate position. Markets are currently pricing in a prolonged pause, but Trump’s pressure on the central bank and shifting economic data could alter expectations quickly. Finally, watch for China’s re-entry into Iranian oil markets following Trump’s announcement that Beijing “can now continue to purchase oil from Iran.” This move could reignite trade friction or trigger secondary sanctions, especially if EU or U.S. energy security concerns are heightened.
In conclusion, the combination of geopolitical relief, Fed ambiguity, and a rotation into riskier assets has created a fertile environment for short-term bullish momentum. However, macro fragility persists. Investors should remain tactically optimistic but structurally cautious, especially in sectors sensitive to energy prices and interest rates. Keeping a diversified allocation across risk assets, commodities, and high-quality fixed income remains advisable in this unpredictable macro regime.

GOLD (XAU/USD), cycle top made?Has the price of gold made its final high point in a bullish cycle, while the geopolitical situation in the Middle East seems to be beginning to ease? The answer to this question cannot be a simple yes, as there are so many fundamental factors influencing gold's trend on the commodities market.
But it is true that, in terms of technical analysis, signals of the end of a bullish cycle (the one that began at the start of 2024, when the price made a bullish technical break of its former all-time high at $2075 an ounce of gold) are gradually appearing, in particular bearish divergences.
1) GOLD, medium/long-term bearish technical divergences are gradually appearing
First of all, let's begin our analysis with the technical aspect for medium/long-term time horizons. The two charts below show signs that the underlying uptrend is running out of steam, with a bearish price/momentum divergence in weekly data. As for the monthly chart, it shows that the theoretical targets of bullish wave number 5 (the last bullish impulse in the Elliott wave cycle) have been made. This doesn't mean with 100% probability that the final high point has been made, but it does highlight that the bullish cycle is well matured and that less buoyant fundamentals may trigger a price breath at the current stage.
Chart showing Japanese candles in monthly gold price data (XAU/USD)
Chart showing Japanese candles in weekly gold price data (XAU/USD)
2) On the other hand, we must remain cautious, as the geopolitical situation is still very tense, and the fundamental factors influencing gold are many and varied
The fundamentals that have underpinned GOLD's fundamental uptrend are numerous and go far beyond the geopolitical framework. While geopolitics is calming down in the Middle East, it remains very complicated in Ukraine. But despite everything, the ceasefire between Israel and Iran is taking bullish support away from the GOLD.
But keep in mind that other factors are at work, notably physical demand for gold in China and financial demand for gold via ETFs in particular. The latter is directly linked to interest rates, the US dollar and therefore the FED's monetary policy outlook.
Therefore, mere appeasement in the Middle East is NOT a sufficient argument for the end of GOLD's bullish cycle in fundamental terms.
3) The bullish technical signal we highlighted for you on XPT/USD
In an analysis of precious metals on June 10, we highlighted a bullish technical signal on the platinum price (XPT/USD), with an outperformance signal given against gold. This analysis can be viewed again by clicking on the link/image below.
Based on the monthly technical analysis, the platinum price is approaching the overbought zone, so don't hesitate to accompany the movement with a trailing protective stop, as sooner or later there will be a market breather.
Chart showing monthly Japanese candlesticks for platinum (XPT/USD)
DISCLAIMER:
This content is intended for individuals who are familiar with financial markets and instruments and is for information purposes only. The presented idea (including market commentary, market data and observations) is not a work product of any research department of Swissquote or its affiliates. This material is intended to highlight market action and does not constitute investment, legal or tax advice. If you are a retail investor or lack experience in trading complex financial products, it is advisable to seek professional advice from licensed advisor before making any financial decisions.
This content is not intended to manipulate the market or encourage any specific financial behavior.
Swissquote makes no representation or warranty as to the quality, completeness, accuracy, comprehensiveness or non-infringement of such content. The views expressed are those of the consultant and are provided for educational purposes only. Any information provided relating to a product or market should not be construed as recommending an investment strategy or transaction. Past performance is not a guarantee of future results.
Swissquote and its employees and representatives shall in no event be held liable for any damages or losses arising directly or indirectly from decisions made on the basis of this content.
The use of any third-party brands or trademarks is for information only and does not imply endorsement by Swissquote, or that the trademark owner has authorised Swissquote to promote its products or services.
Swissquote is the marketing brand for the activities of Swissquote Bank Ltd (Switzerland) regulated by FINMA, Swissquote Capital Markets Limited regulated by CySEC (Cyprus), Swissquote Bank Europe SA (Luxembourg) regulated by the CSSF, Swissquote Ltd (UK) regulated by the FCA, Swissquote Financial Services (Malta) Ltd regulated by the Malta Financial Services Authority, Swissquote MEA Ltd. (UAE) regulated by the Dubai Financial Services Authority, Swissquote Pte Ltd (Singapore) regulated by the Monetary Authority of Singapore, Swissquote Asia Limited (Hong Kong) licensed by the Hong Kong Securities and Futures Commission (SFC) and Swissquote South Africa (Pty) Ltd supervised by the FSCA.
Products and services of Swissquote are only intended for those permitted to receive them under local law.
All investments carry a degree of risk. The risk of loss in trading or holding financial instruments can be substantial. The value of financial instruments, including but not limited to stocks, bonds, cryptocurrencies, and other assets, can fluctuate both upwards and downwards. There is a significant risk of financial loss when buying, selling, holding, staking, or investing in these instruments. SQBE makes no recommendations regarding any specific investment, transaction, or the use of any particular investment strategy.
CFDs are complex instruments and come with a high risk of losing money rapidly due to leverage. The vast majority of retail client accounts suffer capital losses when trading in CFDs. You should consider whether you understand how CFDs work and whether you can afford to take the high risk of losing your money.
Digital Assets are unregulated in most countries and consumer protection rules may not apply. As highly volatile speculative investments, Digital Assets are not suitable for investors without a high-risk tolerance. Make sure you understand each Digital Asset before you trade.
Cryptocurrencies are not considered legal tender in some jurisdictions and are subject to regulatory uncertainties.
The use of Internet-based systems can involve high risks, including, but not limited to, fraud, cyber-attacks, network and communication failures, as well as identity theft and phishing attacks related to crypto-assets.

June 25, 2025 - XAUUSD GOLD Analysis and Potential OpportunitySummary:
Gold remains in a consolidation range between 3340 and 3400.
If price holds above 3350, bullish momentum may return and push toward 3365.
If price breaks below 3315, the strategy remains to sell on pullbacks to resistance.
🔍 Key Levels to Watch:
• 3365 – Resistance
• 3350 – Midpoint / Bull-Bear Line
• 3342 – Key Resistance
• 3328 – Resistance
• 3315 – Intraday Key Support
• 3300 – Psychological Support
• 3295 – Support
• 3285 – Support
📉 Intraday Strategy:
• SELL if price breaks below 3315 → watch 3305, then 3300, 3295, 3285
• BUY if price holds above 3350 → target 3356, then 3365, 3370, 3375
👉 If you want to know how I time entries and set stop-losses, hit the like button so I know there's interest — I may publish a detailed post by the weekend if support continues!
Disclaimer: This is my personal opinion, not financial advice. Trade with caution and always manage your risk.
Gold Slips on Ceasefire — Bearish Momentum Continues Below 3350XAUUSD Analysis – June 25, 2025
Gold slipped significantly and dropped by 1.79% following eased geopolitical tensions after a ceasefire agreement between Israel and Iran. As risk appetite recovered and the USD strengthened sharply, Gold finally broke below the key support at $3,350, falling straight to the next support level around $3,304.
This clean and aggressive sell-off suggests that sellers are still dominating the short-term market structure. Technically, Gold is now trading within a new support range of $3,304–$3,327, while the broader trend remains clearly bearish.
🔍 Technical Outlook:
After the break of 3,350, we can observe that price is forming lower highs and lower lows. The previous high is still located at 3,395, which makes any swing trade risky due to wide stop losses.
However, given the sharp drop, a short-term correction toward 3,327–3,336 is possible before another leg down. The current structure supports shorting the retracement, as long as no bullish reversal pattern emerges on the H4 or D1 timeframe.
📌 Trading Plan (Intraday / Short-term idea):
🔻 Sell Limit: 3,327
❌ Stop Loss: 3,337
🎯 Take Profit: 3,305
⚠️ Use a small lot size due to the 100-pip stop.
This is a short-term plan, best executed in the M15–H1 timeframe. We avoid swing entries until a better structure is confirmed.
📊 Key Levels (Pivot System):
R3: 3,379
R2: 3,366
R1: 3,350
Pivot: 3,327
S1: 3,305
S2: 3,286
S3: 3,256
💬 Summary:
Gold continues its bearish momentum. Watch closely for potential short-term correction toward 3,327–3,336. As long as price fails to break above 3,336 or form a bullish engulfing structure, we remain cautiously bearish.

GOLD - WAVE 5 BULLISH TO $3,734 (UPDATE)Here’s an updated analysis, as ‘Minor Wave 2’ is still forming & pulling back deeper into the $3,285 zone.
We’ll be keeping an eye around this zone for a slow down in bearish momentum & if we get it, we’ll enter a buy trade. If momentum doesn’t slow down, we will let it go towards $3,245 & invalidate bullish structure. That way we know to look for sell’s📉
TP1: $3,374
TP2: $4,300

CHCK XAUUSD SIGNAL READ CAPTAINxauusd buy now ✅
entry point (3322) (3320)
TAKE PROFIT 1: (3328)
TAKE PROFIT 2: (3334)
LAST TARGET(3340)
STOP LOSS (3314)

6.24 Strategy after the sharp drop in gold6.24 Strategy after the sharp drop in gold
After Iran launched a retaliatory strike against the United States on the 24th, the United States chose to cease fire and did not expand the conflict. The market's risk aversion sentiment quickly fell, suppressing the price of gold.
Yesterday, the price of gold fluctuated violently. Although there was a rebound, the overall trend was still weak. The price of gold failed to effectively break through the previous key resistance of 3400 after multiple upward explorations, indicating that the upward movement was weak and the market's short-selling pressure continued to increase.
At present, the price has fallen below the important support level of 3330. If it cannot recover quickly in the future, 3316 will still not be the end point in the future market.
In terms of operation, it is recommended to short on the rebound and go long at low levels
BUY: around 3320
SL: 3315
TP: 3335
SELL: around 3340
SL: 3351
TP: 3290
Thank you for your attention. I hope my analysis can help you.

XAUU-USD chart it will go back upwardXAUUSD Buy Setup Active 🟢💰
Gold is holding strong above key support – currently trading at 3355. We’ve entered a Buy position expecting continued bullish momentum in the market.
📍 Entry: 3355
🎯 Targets: 3420 – 3450 – Final Target 3400
🛑 Stop Loss: 3325 (below recent structure low)
With global uncertainty and technical strength aligning, this move could push gold higher in the coming sessions.
Stay alert, manage risk, and follow the trend until reversal confirmation. 🧭📈
#XAUUSD #GoldTrade #ForexTrading #BuySetup #TradingViewAnalysis #MarketUpdate

DROP ON CEASEFIRE H4 Timeframe Analysis
Gold is currently holding the Rising wedge pattern on H4 Today we have volume opening Gap on OANDA which is still pending.
Market is holding the Range of 3330-3380
What's possible scanarios we have?
I'm expecting the upside move towards my Targets.
if gold sustained with this rising Parallel channel and H4 remains above 3332-3335 then target will be 3360 then 3380 on mark
On the otherhand if The H4 candle closes below 3328-3320 buyying will be limited and market will again the rangbound 3290-3330
#XAUUSD

XAUUSD #Xau #goldLooking for buys at 3310-3280 region potential because market is bullish, price will react from weekly levels in discounts
GOLD - WAVE 5 BULLISH TO $3,622 (UPDATE)We’ve been seeing heavy pump & dumps since last night on Gold, which is no surprise as I told you all last week we are currently in a ‘buying accumulation phase’.
Overall, buyers are holding strong above our Wave 2 zone & above the 0.618% Fib.

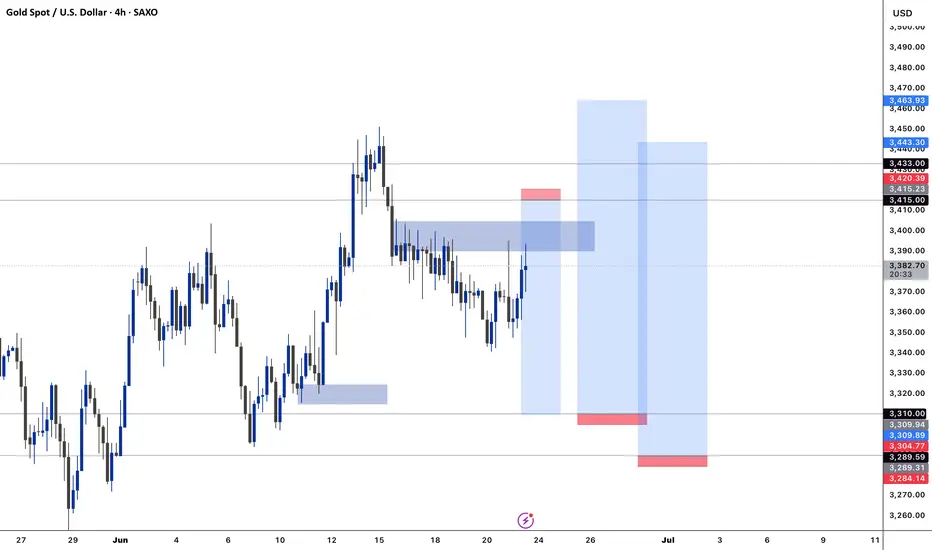
Gold Spot Price Trend Analysispresents a detailed analysis of the gold spot price trend against the U.S. dollar, captured over a four-hour interval. The chart displays a fluctuating pattern, with prices ranging from approximately $3,320 to $3,383.74 USD. A notable decline is observed, marked by a red box indicating a support level at $3,332.53, while a green box suggests a resistance level at $3,383.74. The current price stands at $3,353.94, with a slight decrease of 0.42%. The chart provides valuable insights for investors and traders seeking to understand the dynamics of the gold market.

Gold hyperbullischAs long as gold continues to use the pitchfork as bullish support, it can be assumed that the metal is currently in an ongoing wave 3, implying further upside potential. Corrections remain shallow in both time and price. Geopolitical tensions typically support increased demand for gold, and rising volume shows no signs of weakness so far. NFA

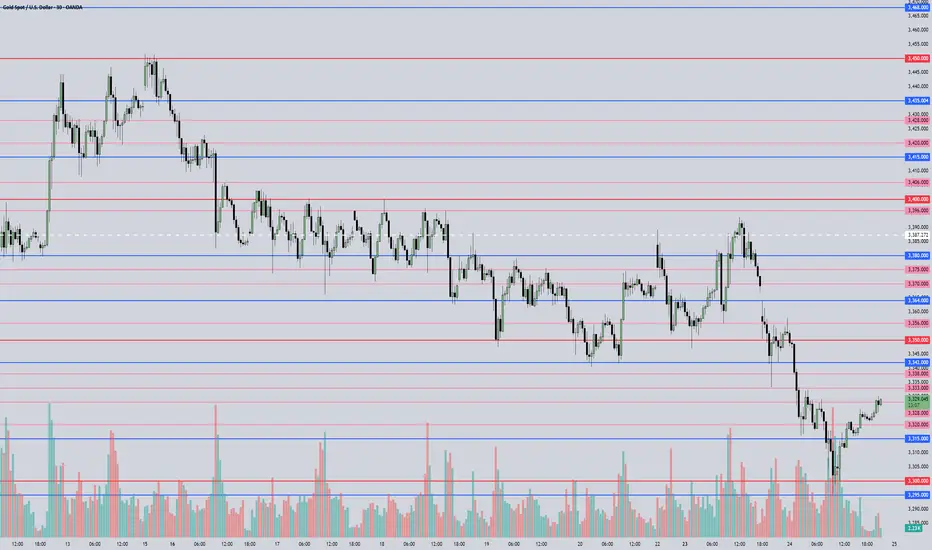
Is this the end of the bears of XAUUSD?2 weeks in a row, the sellers were in control. The downward force this week is strong. The possibility of a further drop in the future is highly probable. However, there's also a potential recovery next week. Overall, it's still an uptrend; however, I won't ignore the new LH that formed this week as well.

QQQ, SPY, NVDA & GOLD Daily Trade SetupsIn this update we review the price action in the QQQ, SPY, Nvidia & Gold and identify the next high-probability trade setups and price objectives to target. To review today's video analysis, click here!

XAUUSD on correction H4 Timeframe Analysis
Gold is currently holding the falling wedge pattern on H1 & H4 now market is range of 3330-3380 structural zone .
What's possible scanarios we have?
As we have seen h4 candle closes above 3335
And we have bullish potential towards 3380 .once 3345 cross keep your eyes at 3365 then 3380 milestone.
On the otherhand if The H4 candle closes again below 3335 buying will be limited and market will join the 3290 zone
Additional TIP:
Above 3335 keep buy
Below 3325 keep sell
#XAUUSD

CHECK XAUUSD SIGNAL READ CAPTAINxauusd buy now ✅
entry point (3327) (3325)
TAKE PROFIT 1: (3335)
TAKE PROFIT 2: (3347)
LAST TARGET(3355)
STOP LOSS (3348)

New Week Opens – Bullish Stance HoldsA new week opens as the Gold market maintains its bullish stance, holding firmly above previous demand zones. Market participants anticipate continued momentum unless key support levels are broken, with eyes still on structural wedge formations and demand reactions. follow for more insights , comment and boost idea.

THE KOG REPORT - UpdateEnd of day update from us here at KOG:
Although many were anticipating a strong move upside on the open, we stuck to our guns and the algo which gave us the bias level as bearish below. Although we wanted a little bit higher, this worked well today with nearly all our bearish below target being completed again in one day apart from the remaining 3380.
For this reason, we'll stick with the plan for now with resistance now being the 3406 level which if held can force us down further into the level given before a potential RIP. With FOMC around the corner, we can expect some choppy and ranging price action tomorrow so tread carefully on the markets if you're less experienced.
KOG’s bias of the week:
Bearish below 3465 with targets below 3425✅, 3420✅, 3410✅ and 3406✅
Bullish on break of 3465 with targets above 3477, 3485, 3492, 3495 and 3503
Red Boxes:
Break above 3435 for 3443, 3448, 3465 and 3476 in extension of the move
Break below 3420 for 3410✅, 3406✅, 3397✅, 3385✅ and 3380 in extension of the move
As always, trade safe.
KOG

Bearish Technicals prevailedTechnical analysis: Despite the strong Bearish candle sequence on the DX (few percents down), Gold remains on losses however above my Support for the session as the U.S. session approaching and geo-political tensions resurfacing. However, #3,395.80 is new Resistance zone made by the Hourly 4 candlestick configuration. Gold is pulling back again after it failed to break above it’s Resistance variance (#3,388.80 - #3,395.80 - #3,402.80) on the Hourly 4 chart, while #3,352.80 benchmark configuration is protecting the eminent downtrend. This sequence is similar to the September #24 - #28 pattern when a Double Bottom was made before the strong rebound. Also current Gold's impulse and rejection was Highly correlated with the side Swings on the Bond Yields market, happening on Hourly basis. As discussed, Gold is Trading within Descending Channel and that fractal is Buying back every dip and postponing the downtrend and pointing me that Gold should be timed for consolidation session (regarding Short-term). I am looking to complete a full oscillation towards #3,327.80 if #3,342.80 - #3,352.80 gives away, in the same time my main point of interests. I am expecting recovery however within #1 - #3 sessions if DX extend the Selling sequence and remain with a Daily chart proportions decline. My practical suggestion would be to wait for a break-out and then make a move, since at the moment - there is a clash between Bearish Technicals on Gold and Fundamental war escalation uncertainty which could make Investors park their capital from Gold into more riskier assets - and vice versa. Consequently the current consolidation and another Bearish wave should come as no Technical surprise, only if Fundamentals do not arise Buyers of the market.
My position: As my Profit quota for the week / Month is already acquired, I will not take any more orders for today's session. I lean of course more to Bearish side Intra-day, however even if I engage, will be Scalp order rather than positioning myself for #10 - #20 point move.
