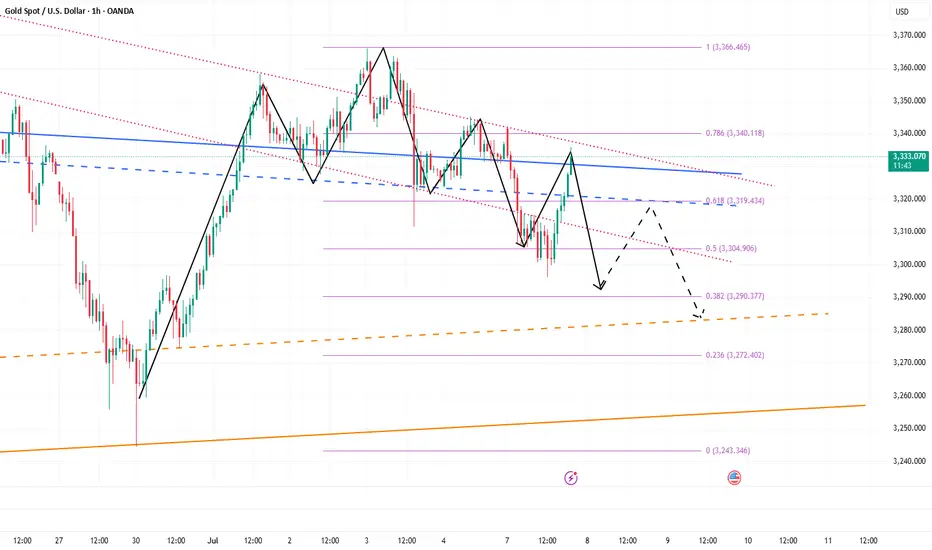
Gold Rebound Underway – Support Zone Holds Strong! - Short termGold( OANDA:XAUUSD ), as I anticipated in the previous idea , has attacked the Support zone($3,281-$3,243) and Support lines .
From an Elliott Wave theory perspective , it appears that Gold has completed 5 sub-waves of the main wave C .
Also, we can see the Regular Divergence(RD+) between Consecutive Valleys.
I expect Gold to rise to at least $3,307 in the coming hours.
Second Target: $3,321
Note: Stop Loss (SL) = $3,240
Gold Analyze (XAUUSD), 1-hour time frame.
Be sure to follow the updated ideas.
Do not forget to put a Stop loss for your positions (For every position you want to open).
Please follow your strategy; this is just my idea, and I will gladly see your ideas in this post.
Please do not forget the ✅ ' like ' ✅ button 🙏😊 & Share it with your friends; thanks, and Trade safe.
GOLDMINICFD trade ideas

XAUUSD Bullish and bearish. Which one first?
📉 Gold and NDX: Seasonal Patterns and Short-Term Outlook
Historically, gold tends to show weakness during the first three weeks of July, often setting the stage for one last leg up before institutional selling kicks in on U.S. equities. Based on seasonal patterns, this aligns with a typically bullish phase for the Nasdaq (NDX), which often extends until around July 24, with the usual volatility along the way.
From there, gold tends to recover, historically offering a 3–5% return into mid-September. Keep in mind, this is purely based on statistics—always do your own analysis.
🔎 This week’s short-term setup:
We may see a push higher in gold later today and into tomorrow, followed by potential downside during the second half of the week. While there might be brief upside opportunities, I won’t be taking any long positions—only looking to sell rallies—since the short-term trend remains more bearish than bullish.
Stay sharp and trade safe. 📊

BUY TRAP OR TREND ?xauusd is supposed to frame bearish zone by faking bullish trend. the current candle sticks momentum indicate seller control. the dollar performance and high intererst rate along with geopolitical peace full events are likely to encourage a seller control.
the resistance is 3370 if market did not break it then it will fall on the last target i set up for you.
target 1 ( 3330)
target 2 (3302)


Gold Breakout and Potential RetraceHey Traders, in today's trading session we are monitoring XAUUSD for a buying opportunity around 3,330 zone, Gold was trading in a downtrend and successfully managed to break it out. Currently is in a correction phase in which it is approaching the retrace area at 3,330 support and resistance area.
Trade safe, Joe.

#XAUUSD H4 – Higher Time Frame Analysis
📊 ** #XAUUSD H4 – Higher Time Frame Analysis ** 🕵️♂️
🔍 We drew a **Fibonacci retracement** from **June’s high (3451)** to **low (3246)**, and the **Golden Fibo level (0.618)** comes out to be around **3367**.
🎯 That’s **exactly why** we kept a **safer target at 3366** in our **yesterday’s H1 buy setup** – and it worked perfectly!
✅ Price made a high of **3365.95** before facing solid rejection from that zone.
📉 This area was critical because:
* It was a **Golden Fibo zone** ✨
* There was also a **visible price gap** on the chart ⚠️
🔄 **Current Price Action**:
After forming the day’s low, **price is now attempting to recover**. Let’s watch the H4 candle closely. 🕰️
---
📌 **Two Possible Scenarios from Here:**
1️⃣ **Bullish Breakout**
➡️ If H4 candle **closes bullish above 3361**, we may witness a **deeper mitigation** of the **supply zone at 3367–3389**. 🚀
2️⃣ **Bearish Breakdown**
⬇️ If H4 candle **closes bearish below 3334**, then we may revisit the **3300 zone**.
📍 Below 3300, **3289–3276** becomes a potential **buy zone**, **if** price shows **rejection signals**. 💰
---
📌 **Stay sharp, follow structure, and let price action guide you.** 🧠💡
🛑 No rush, just execution with precision.

XAUUSD Update : Bullish MomentumToday's New York market session has made gold prices rise with quite strong momentum.
Prepare to surf the Bull's wave.
Have a blessing day !

Analysis of gold price rise and fall on MondayAnalysis of gold price rise and fall on Monday
The probability distribution of gold price trend next Monday is as follows:
Probability of rise: 55%-60%.
Support factors include: the expectation of Fed rate cuts has been strengthened, the dollar is weak, the tariff deadline is approaching, triggering safe-haven demand, and the momentum of short-term rebound in the technical aspect.
Probability of decline: 35%-40%.
Risk factors include: strong resistance at 3360 points on the technical side, temporary relief of geopolitical risks, and profit-taking pressure.
Probability of sideways fluctuation: 5%-10%.
If there is a lack of catalysts, the gold price may fluctuate in the range of 3310-3360, waiting for new clues.
Operation strategy reference:
Long position strategy: If the gold price falls back to the 3310-3315 area and stabilizes, you can go long with a light position, set the stop loss below 3300, and the target is 3325-3330 (it can go up to 3335-3340 after breaking through).
Short-selling strategy: If the gold price rises to the 3350-3360 range, you can short with a light position, set the stop loss above 3360, and target 3325-3330 (after breaking through, look down to 3310--3300-3280).
Fundamentals
Weight analysis of key influencing factors:
Subsequent impact of US non-farm payrolls data: If the detailed interpretation of non-farm data next Monday continues to ferment, it may provide support for gold.
Expected changes in the tariff decision on July 9: Next Monday will be the last trading day before the suspension of US trade tariffs (July 9), and market concerns about the Trump administration's possible increase in tariffs may heat up.
Any relevant news or official statements may trigger safe-haven funds to flow into gold.
Key technical game:
The battle between the $3310 support level and the $3360 resistance level will continue to dominate the short-term trend.
If the opening price remains above the 3330-3340 range next Monday, it may test the 3360 resistance; if it falls below 3310, it may fall to the 3280 support.
Trends of the US dollar index and US Treasury yields: The US dollar index has recently fallen to a two-year low (96.875), and US Treasury yields have also fallen (10-year yields are 4.228%). If this trend continues, it will be good for gold.
Geopolitical risk dynamics: Although the situation in the Middle East has not escalated further, it is still in a tense state, and sudden news may disrupt the market at any time.

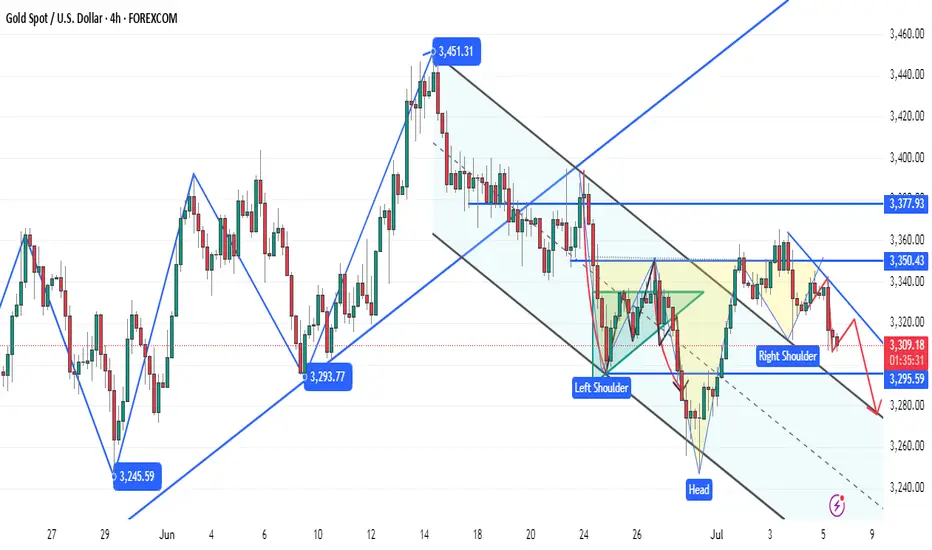
Gold Bullish Structure - Awaiting A RetestThat inverted head and shoulders pattern on is what is still giving me the confidence that the bulls will soon take over this market with a high probability of new All Time Highs.
At the moment however, I am patiently aways the possibility of a retest to the H4 demand zone as indicated by the downward pointing arrow. The bullish move might only happen in ful swing next week.

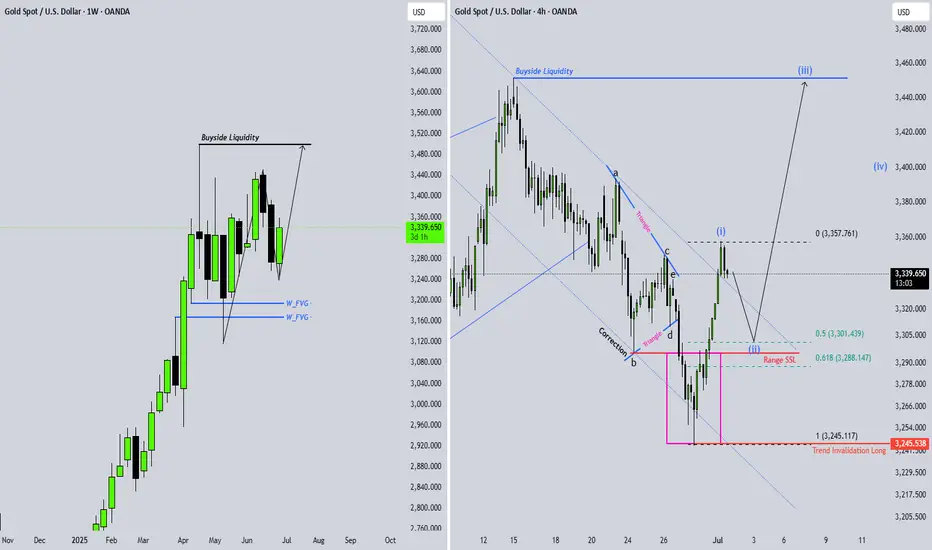
XAUUSD Forming Triangle Pattern – Eyeing Breakout After Wave (e)🚨 Gold (XAUUSD) Technical Analysis – 3H Chart
Gold is currently forming a classic contracting triangle pattern (ABCDE), with wave (e) in progress. Price is bouncing from a strong buyers’ zone near 3269.60, showing signs of upward pressure.
📊 Current Structure:
Wave count: (a)-(b)-(c)-(d)-(e)
Consolidation within a symmetrical triangle
Key support: 3269.60
Resistance zone to watch: 3408.00
📈 Potential Scenario:
If price holds above the buyer’s zone, we can expect a bullish wave (e) push towards the upper trendline at 3408, potentially leading to a breakout continuation.
📍 Trade Plan (Educational Purpose):
Long Setup Valid Above: 3269.60
Target: 3408.00
Stop Loss (SL): Below 3260 (based on your risk profile)
---
🧠 Why This Matters?
This triangle setup often leads to strong breakout moves, especially in commodities like gold during fundamental uncertainty or dollar index shifts. The market is compressing — be prepared for the breakout move.
---
📢 Follow for more clean Elliott Wave + Price Action setups!
💬 Drop your analysis in the comments. Let’s grow together!

Gold bottomed out and rebounded to fluctuateGold, the price opened at 3342 in the morning and then fell back. The article emphasizes the bearish structure of the 4H chart, and the bearish trend continued to 3311-3295 in the afternoon; the actual price fell to 3296 and then rebounded in the evening, and the 4H chart closed at 22:00 and turned into a big positive, and it will rebound and fluctuate at night;
Short-term support 3306-3300, strong support 3296; short-term resistance 3322-3326, strong resistance 3330-3340;

Trend Continuation After NonfarmToday's D1 candle started to continue the trend of NF with a decrease to 3306 in the Asian session this morning.
The bearish structure of Gold Price will continue in today's trading session towards important support zones.
The downtrend of Gold was only broken with a candle closing back above 3324. And the downtrend may reach support 3275 today.
Support 3297-3275
Resistance 3324-3343-3364
SELL Trigger: Break support 3296

Gold (XAUUSD) – July 8 Analysis | Decision Day at H4 Supply Zone
Gold is currently trading inside a key H4 supply zone (3342–3345) , and today’s session could act as a pivotal turning point for the ongoing structure.
We are now in a region where the H4 may either complete its pullback and resume the uptrend — or allow price to drop deeper toward 3280 before any bullish continuation.
Market Structure Overview
• H4 Trend: Still in a pullback
• M15 Trend: Gave a Change of Character (ChoCh) in the previous session
• Break of Structure (BoS): Not yet confirmed on M15
This puts us in a state of unconfirmed reversal . Without a clean BoS, this could still be a liquidity grab .
Key Levels & Current Setup
📍 H4 Supply Zone: 3342–3345
→ This is where price is currently reacting
→ Sellers may step in here if the broader pullback continues
📍 M15 Structure Status:
→ ChoCh already occurred
→ Price is in a retracement phase
→ BoS is needed to confirm a shift and signal the end of H4 pullback
What Today’s Session Will Decide
🔸 If M15 breaks structure upward (BoS):
→ H4 pullback may be complete
→ Bias turns bullish
→ We’ll plan long setups from M15 POIs with M1 confirmation
🔸 If M15 fails to break and reverses:
→ This could be a liquidity grab
→ Sellers may push price lower
→ Next downside target: 3280 H4 order block , still valid
⚠️ Reminder: Be Prepared for Both Scenarios
• No M15 BoS = No bias
• Wait for structure, not emotion
• Do not force long trades without confirmation
• 3280 remains a high-probability target if rejection confirms
Final Thoughts
This is a structure-led market — we don’t predict, we prepare.
Today’s price action may bring directional clarity.
Structure over speculation.
Let price show intent.
Then act with process, not impulse.
📘 Shared by @ChartIsMirror

#XAUUSD – H1 High Probability Setup
📊 **#XAUUSD – H1 High Probability Setup** 🔍
If you recall our **morning analysis**, we clearly mentioned that price is likely to **mitigate the zone below 3300** —
and as expected, **price tapped into 3296**, which aligned with both the **H1 Order Block** and **Golden Fibonacci zone** 🎯📉
---
📈 **Current Setup in Progress:**
We're now watching for a **bullish H1 candle close above 3353** 🔼
Once confirmed, we’ll execute a **layered buy strategy**:
🔹 **50% entry at activation** (above 3353)
🔹 **30% on retracement** (if price dips 50–60 pips below entry)
🔹 **Remaining 20%** if price dips **70+ pips** below entry zone
---
🛡️ **Stoploss:** 3338–3337 (slightly wide due to structure)
This is why we **scale into the trade** — for **better risk management** and **position control** ✅
🎯 **Minimum Target:** 100–150 pips
🏁 **Extended Target (Optional):** 3396 – for those who can hold with conviction 📊💰
---
🧠 *Follow structure, manage risk, and trust the plan. High probability setups don’t need to be rushed.*

GOLD 3H Chart Pattern, I have marked a cup formationGOLD 3H Chart Pattern, I have marked a cup formation, which often indicates a bullish reversal setup. Based on the chart:
Key Levels:
Current Price Zone: Around 3,323 - 3,330
First Target: Near 3,380 - 3,400
Final Target: Near 3,440 - 3,460
Analysis:
Price is forming a cup pattern with resistance around 3,380 - 3,400
Break above 3,400 could lead towards the final target zone of 3,440 - 3,460
Watch for price reaction near Ichimoku Cloud; clean breakout above the cloud confirms bullish momentum
Suggested Targets:
✅ First Target: 3,380 - 3,400 USD
✅ Second Target: 3,440 - 3,460 USD
Note: Wait for confirmation above 3,330 - 3,340 and bullish momentum to continue.
If you want, I can also give stop-loss and entry suggestions based on this chart. Let me know!

Watching the FVG Midpoint for a Potential Resistance PlayTraders, TVC:GOLD is currently moving beautifully within a well-defined descending parallel channel, and it’s offering some interesting technical setups. If you take a closer look at the chart, you’ll see that price has formed a Fair Value Gap (FVG) on the 1-hour timeframe. The midpoint of this FVG lies around the 3317–3318 level. Previously, this zone acted as a strong area of support, but since the price has now broken below it, there’s a high probability that it could flip into a resistance zone this time around.
This kind of structure often provides great opportunities for short entries if we see a price retest and show signs of rejection near the midpoint of the FVG. Always keep an eye on how the candles behave when price revisits this area, as it could set up a nice trade with clearly defined risk and reward. Remember, patience is key—let the price come to your zone instead of chasing it. Let’s see how this plays out!

Follow up before the Fed minutesGold, the price fell from the historical high of 3500 to 3120 in the first round this year, and is now in the second round of downward cycle after rising to 3452. The mid-term top idea is maintained, and the operating target is 3120; after bottoming out and rebounding to 3345 on Monday, it did not continue on Tuesday, and fell to 3287 in a weak position; the daily chart recorded a real big Yin, and the K-line combination was short-term, and the bearish trend continued during the day, and attention was paid to the impact of the Federal Reserve's monetary policy minutes on Thursday morning;
Opening at 3301, short-term resistance at 3308-3310 during the Asian session, strong resistance at 3315 and daily chart MA5-3320, the limit rebound is not more than here; short-term support at 3293, strong support at 3287, and the previous parallel low at 3247 is expected to be seen if it breaks;

Gold BullishAfter exiting a correction, the first impulse (Wave 1) appears. I expect a retracement of at least 50% of the Fibonacci.
XAUUSD on swing Gold is currently holding Rangebound 3280-3296 .
Already holding buy positions at 3283-84
What's possible scanarios we have?
(PREFERRED )
▪️if the any M30-H1 candle flips above 3298-3300 then keep your eyes at 3315 then 3325
Additional TIP:
below 3278-3275 then we'll see gold to tap 3255 and buying will be invaild
#XAUUSD

Gold plunge warning! Shorts point to 3200!
Fundamentals
Although the market risk aversion has cooled down recently, the cumulative increase in gold this year is still more than 25%, mainly benefiting from the continued increase in gold holdings by global central banks and ETF fund inflows. The market is currently paying attention to the trend of US trade policy on July 9. If the negotiations break down or new tariffs are implemented, it may quickly stimulate safe-haven demand and drive gold prices to rebound. However, in the short term, due to the temporary strengthening of the US dollar and the profit-taking of some longs, gold prices are still facing correction pressure.
Technical analysis
Trend structure:
Key resistance level: The 3450-3500 area is still an important pressure area for gold. Previously, gold prices encountered resistance in this area and fell back, indicating that the selling pressure in this area is strong.
Short-term support level: At present, the 3300 mark has become the focus of competition between long and short sides. If it falls below, it may further bottom out in the 3250-3220 area.
Short-term momentum: The 4-hour moving average is under pressure in the short term, and the MACD indicator is weak, indicating that there is still room for correction in the short term.
Key points:
Upper resistance: 3320-3330 (short-term short-term defense), 3350-3360 (strong resistance)
Lower support: 3300 (psychological barrier), 3290-3280 (short-term long-term defense), 3250 (medium-term key support)
Trading strategy
1. Short-term short-term operation (main line idea)
Entry point: rebound to 3310-3320 area, you can try to short
Stop loss: above 3325
Target: 3300 (first target), look at 3280-3250 after breakthrough
2. Low-level defense long (cautious participation)
Entry point: first touch 3290-3280, you can try to go long with a light position
Stop loss: below 3275
Target: 3310-3320 (if the rebound is weak, leave in time)
Summary and outlook
Short-term trend: technical side is still bearish. If 3300 is lost, it may accelerate downward to 3280-3250.
Potential change signal: If the gold price stabilizes at 3320, it may retest 3350, but it needs fundamental support (such as rising risk aversion).
Operation suggestion: Pay attention to the rebound high. You can try to go long with a light position at the key support level, but you need to strictly stop loss.
(Personal opinion: Gold prices may continue to be under pressure in the short term, and the 3300 mark may be difficult to hold. The short target looks below 3280.)
Monday Outlook on Gold (XAU/USD)My outlook for Monday is bearish at the start of the session, with price likely to drop toward the 3310–3300 area. This level aligns with a key discount zone inside the Gann box, and also overlaps with a 4H Fair Value Gap (FVG), making it a strong area of interest for potential long setups.
From that zone, I expect a bullish reaction, leading to a move back up to the trendline.
If the momentum continues, I anticipate a break of the trendline, followed by a retest, and then the beginning of a bullish trend.
I’ll be looking for confirmations around 3300 to position for the move higher.
Let’s see how Monday opens.

My Weekly Review and Some tierlist for the zones I madeHello guys. its end of the week and I wanna share you my journey since monday until today. I also tell you the real reason why I don't believe the bottom is in yet and holding my swing sell. Thank you for watching.

Gold rebound is powerless and waiting for catalyst! European sup
In the Asian session on Wednesday, spot gold suddenly fell rapidly in the short term, falling to the lowest level of 3284. At present, gold is firmly bearish in the near term, and the price of gold may fall to $3247/ounce. The Federal Open Market Committee (FOMC) is scheduled to release the minutes of the June monetary policy meeting on Wednesday. This document may reiterate what speculative interest already knows, that is, Fed officials are satisfied with their recent wait-and-see stance.
The Federal Open Market Committee (FOMC) will release the minutes of the June monetary policy meeting. The minutes of the Fed's June 17-18 meeting to be released will send a more dovish signal than expected, and the "wait-and-see period" for rate cuts may end in late summer.
Views on today's gold trend!
Looking back at the market, it fell first and then rose on Monday, and then retreated directly on Tuesday. The market turned so sharply, and after gold broke below 3300 again yesterday, the market tended to be weak. At present, the upward trend of gold is still in effect, but buyers seem to be losing momentum. It is worth noting that the relative strength index (RSI) triggered a "sell signal" as the index fell below 50, indicating that sellers outnumbered buyers.
From the perspective of price action, gold prices need to fall below the June 30 low of $3,246/oz to pave the way for further declines. From the 4-hour trend chart and the daily trend, the key node of opening pressure is around 3,321. This position is the low point of yesterday's sideways trading, and it is also the key suppression level of the trend line and the moving average. If you want to weaken again today, this position cannot stand firm, and the support below will first look at the double support of 3,376 and 3,247!
Gold: Short near 3,321, defend 3,331, and target 3,296-3,285! Enter long orders if it falls back to around 3,276 without breaking, defend 70, and target 3,310! If it continues to break, wait for the 3,347 first-line support to take more!

The short position is losing money. What should we do?Gold hit the intraday low of around 3296 and then began to rebound. We can see that the rebound of gold is not strong, but it is relatively sustained, so gold has rebounded to around 3335. To be honest, I did short gold according to my plan and still hold a short position.
Although gold has rebounded to around 3330, I don’t think my short gold trade has failed. As I said in the previous point of view, gold is facing technical suppression of the head and shoulders in the short term, which will suppress the rebound limit within the 3335-3340 area. So before gold stabilizes at 3340, I think the gold shorts still have the upper hand. So as long as gold stays below 3340, I think the gold rebound is a good opportunity to short gold.
At present, gold is facing the resistance area of 3335-3340 and begins to show signs of stagflation. After consuming a certain amount of bullish momentum, the gold shorts may counterattack strongly again and stimulate gold to fall rapidly. Therefore, before gold breaks upward through the 3335-3345 area, we can still consider shorting gold, or continue to hold a short position in gold!