GOLDMINICFD trade ideas

XAUUSD LONG AFTER A LTF BOSGOLD has recently broken its last lower timeframe High, shifting market structure and indicating Buyers are currently in control.
This break opened up a clear Demand Zone below, a small base or last bearish candle before the rise, which is a key area where unfulfilled buy orders may be resting.
Price has already retraced back into this Demand Zone to fill those orders and there’s a liquidity sweep signaling a buy. We should be expecting a buying pressure to resume and push price upward, honoring the imbalance left by the rise.
Entry:
I’m buying from this Demand Zone. This lets me enter at a discount price while trading in direction of the newly established upward momentum.
Target:
The first Target Profit (TP) is set at the next supply Zone above, where selling pressure might emerge.
Stop Loss:
To control risk, the Stop Loss (SL) is placed just below the demand Zone.
If price drops below this area, it would invalidate the demand’s ability to hold, signaling a potential reversal.
✅ Summary:
• Market has shifted to bullish after breaking last high.
• Demand Zone below is a key area to watch for buying opportunities.
• Buying upon the pullback into Demand, with Stop Loss below and Target at supply above.

Gold Outlook: 3 Critical Zones That Could Shape the Next Move▋Observation & Meanings:
▪Price has broken out of the Broadening Wedge to the upside — a strong move led by bulls.
▪It then pulled back after reaching the 100% projection of the previous upswing, which also marked the likely extent of the retracement.
▪A break below the minor low (a) suggests short-term downward pressure.
▪However, the overall uptrend structure remains intact as long as the main low (A) holds.
▋What’s next?
Trading a retracement is always tricky — by nature, it means going against the prevailing trend.
▪ Question 1 : Is there anything to do when price falls below the minor low (a)?
Often, the best move is to stay patient and let the market reveal its intentions, some setups may offer opportunities:
▫The main prior low could act as a key short-term support, as it aligns with the 100% retracement of the previous upswing.
▫For aggressive traders, a quick short toward that level may be an option.
▪ Question 2 : When will a new trend begin?
▫Bearish scenario: A confirmed break below the main prior low could signal the start of a more sustainable downtrend.
▫Bullish scenario: Aside from Aside from (1) a direct breakout above the previous high (B), signs of strength may also come from:
(2) A clear lower high or
(3) A consolidation range, followed by a strong upside break.
In this case :
- The prior high (by definition) marks resistance.
- However, there’s also a tight congestion area before that high, which may act as the real barrier — potentially even more significant due to its cluster of price action.
▫Once early trend signals appear, the next step is to assess if the structure supports a lasting trend.
▋The 3 big zones:
▪ Uptrend Zone
The market is likely regaining upward momentum when one of the following occurs:
1. Price spikes above the previous swing high at point B.
2. Price breaks the tight congestion area to the upside.
3. A new consolidation range forms and breaks to the upside.
▪ Downtrend Zone
A clean break below the main prior low (A) would likely confirm bearish control and may open room for further downside.
▪ Ambiguous Zone
If price fails to meet the conditions for either an uptrend or a downtrend, it’s likely to remain in a drifting, indecisive state.
▋Mental Notes:
▪Don’t predict the price, trade the price. Have a plan, but not blindly follow.
▪The market will always find ways to surprise. Stay open and follow the flow.
▋Not Financial Advice
The information contained in this article is not intended as, and should not be understood as financial advice. You should take independent financial advice from a professional who is aware of the facts and circumstances of your individual situation.

Gold Trade Plan – Wait for the Trap, Then Catch the Move Price broke the ascending trendline and is now heading into a key demand zone around 3387–3390. My plan is to wait for the manipulation wick into the green zone, ideally touching the trendline confluence below, then catch the bounce for a clean long setup toward 3460+. If that fails, I’m ready to flip short after the liquidity grab.
Two scenarios on the table:
1- Rejection from the demand zone → bullish continuation.
2- Fakeout bounce → trap longs → reversal drop.
Stay patient, let price come to you.

XAUUSD 📉 XAUUSD Technical Overview (15-min TF)
Recommendation: Bearish.
The pair is showing clear downside momentum, with price having broken below recent intraday highs and forming a series of lower highs and lower lows on the 15‑minute chart.
Target:
We are targeting the prior intraday low around 3295, which represents a logical short-term support area and likely liquidity target before price could consolidate or correct.


GOLD – Sharp Drop to 3,300 Meets Key Support ZoneOANDA:XAUUSD has reversed its downtrend into a potential upside move from the most recent support area, showing a clear rejection after an extended decline. This rejection serves as the first sign that buyers may be stepping back in from this well-defined demand zone.
Currently, I am watching for a recovery to the 3,390 area. If this rally is accompanied by good trading volume and solid momentum, the price structure will be confirmed. At that point, I will consider planning to buy long.
The plans to follow are:
Enter early with higher risk – if you believe in the initial signal.
Wait for clearer confirmation – like a breakout or a confirmation candlestick pattern – to enter more safely.
All are still waiting for further price action confirmation.
Note: This is a personal opinion, not an investment recommendation.


ELLIOTT WAVE XAUUUSD H4 update
EW Trade Set Up H4
minuette wave (iv) running?
possible leading diagonl subminuette i upside move from 3120a of 150525 to 3439a of 130625 till now, subminuette wave ii running
alternative: minuette wave (iv) still running
key levels (area)
3390
3355 POC
3310

Bullish Momentum Expected Next Week, With Geopolitical tensions 🌍 Fundamental Catalyst – Middle East Tensions Driving Gold Higher
Gold is gaining strong safe-haven demand due to escalating geopolitical tensions between Iran and Israel, further amplified by a recent U.S. military strike on Iran. These developments have sparked fears of a broader regional conflict, pushing investors to seek the stability that gold traditionally offers during periods of uncertainty. We may again see an All-Time New High of gold because things are getting closer to a new WWIII, which we never want, so these tensions will boost the gold prices.
Key Fundamentals Supporting Bullish Gold:
🛡️ Safe-Haven Demand: Gold historically rallies during military conflict and political instability.
💥 Risk-Off Sentiment: Equities may weaken while commodities like gold attract capital inflow.
🔐 Market Uncertainty: Any further escalation will likely trigger another wave of buying pressure in gold.
With this level of geopolitical uncertainty, we may soon witness a new all-time high (ATH) in gold prices. If further military actions occur, we could potentially see an explosive move of 600 to 1000 pips as early as tomorrow.
At the same time, while we analyze the market and act accordingly, our hope remains that peace will soon prevail. These conflicts are deeply painful and harmful to humanity. Let’s all hope for de-escalation and the return of stability — not just for the markets, but for the well-being of people across the world.
Technical Overview:
> The chart shows a descending channel pattern, which is still valid, but the thing is now gold will follow fundamental, not technical levels.
> Don't need to wait for the breakout of this channel, you can enter to buy a trade from here once the market opens.
> Regarding the targets we mentioned below.
>> TP1: 3400 <<
>> Final Target Zone: 3445–3450 <<
: NOTE
Given the geopolitical backdrop and historical behavior of gold in such environments, a bullish trend is expected in the coming sessions. Traders and investors should monitor developments closely, as any further escalation may act as a strong catalyst for gold to surge.
Thank you traders, for reading our idea. If any of you want to suggest something, must comment here as we can explore more. If you agreed with my idea, so must support us for more updates.

June 21st Market Recap (gold,gbpusd,eurusd)In this video I discuss what I was looking for the market to do past week as well as following week however I'm not a financial advisor I'm just posting my prediction if traded trade at own risk with proper risk management. Btw I appreciate all the feed back and if you find my videos insightful follow my YouTube channel @sbetrades

GOLD's rise has been steady, decisive move aheadGold is the focus, plain and simple. We’re in an ascending channel, and price is respecting that structure with precision, higher highs, and no major signs of exhaustion yet.
Recently a clear resistance level was just taken out, and now I am watching for the classic retest. That breakout? A big deal, and a strong clue as well. If that zone holds as support, that’s a green light for a potential upmove toward 3,460 which matches the top of the channel.
But if it fails, we could expect a slight pullback, it might mean we could be in for a healthy dip before the next move.
Bottom line: follow the structure, and don’t force trades here without confirmation first

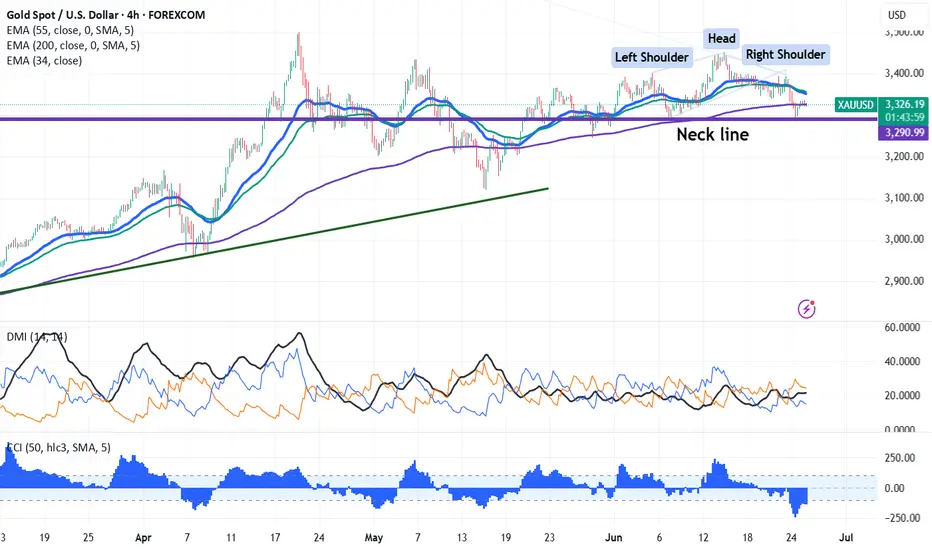
Technical Alert: Gold's Head and Shoulders Suggests Bearish SigChart pattern-Head and Shoulder
Gold pared most of its gains as Israel and Iran ceasefire agreement. It hits an low of $3295 and is currently trading around $3327.
Gold prices are holding below short term moving average 34 EMA and 55 EMA and above long-term moving averages (200 EMA) on the 4-hour chart. Immediate support is at $3340 and a break below this level will drag the yellow metal to $3330/$3300. The near-term resistance is at $3385 with potential price targets at $3400/43420$3450/$3475/$3500/$3550.
It is good to sell below $3295 with a stop-loss at $3330 for a target price of $3000.
GOLD Core PCE Price Index (month-over-month): rose by 0.2%, above the forecast of 0.1% and the previous 0.1% reading. This indicates a slight acceleration in the Federal Reserve’s preferred inflation gauge, with the annual core PCE inflation rising to about 2.7% year-over-year, above expectations of 2.6%.
Personal Income (month-over-month): declined by 0.4%, worse than the forecasted 0.3% increase and down from the previous 0.8% rise. This drop suggests a weakening in household income growth.
Market and Policy Implications:
The uptick in core PCE inflation signals that underlying price pressures remain somewhat persistent, complicating the Fed’s path toward its 2% inflation target.
The decline in personal income could weigh on consumer spending going forward, potentially slowing economic growth.
The US Dollar Index reacted by edging lower, reflecting market caution amid mixed inflation and income data.
Fed officials, including Chair Powell, have emphasized a cautious approach, suggesting no immediate rate cuts until inflation dynamics become clearer.
Summary:
Core inflation is ticking up slightly, reinforcing inflation concerns, while personal income weakness points to potential softening in consumer demand. This mixed data supports a Fed stance of patience, with markets pricing in a moderate chance of rate cuts later in 2025 but expecting continued vigilance..
China Hong Kong gold vault hints at a geopolitical shift, as the Shanghai Gold Exchange's expansion, aims to enhance China's gold trading infrastructure and challenge Western dominance, potentially impacting demand and supply of physical gold need.
#GOLD

Gold stalls below $3350 as USD weakness continuesGold remains delicately balanced as traders in Asia and Europe proceed with caution. Despite recent USD weakness lending some support, buyers haven’t broken above $3350.
📉 USD Weakness & Market Sentiment – Fragile Recovery?
🔻 Dollar Wobbles: Talk of Fed leadership change is stirring doubt over the USD’s trajectory, adding political risk that may benefit gold.
⚖️ Mixed Sentiment: Gold consolidates in a tight range after early‑week drop. With PCE data and Fed speeches ahead, traders await the next catalyst.
📊 Technical Structure – Consolidation Underway
Gold trades below short‑term EMAs, hinting at a bearish pause or stealth accumulation. Current levels near $329X.
Key Zones:
🟢 Demand (Buy): $3264 / $3276 / $3294
🔴 Supply (Sell): $3313 / $3321 / $3330 / $3341
🎯 Intraday Trading Plan:
🛒 BUY ZONE: $3264–$3266 (SL: $3270; TPs: $3280 → … → $3320)
⚡️ BUY SCALP: $3282–$3284 (SL: $3278; TPs: $3288 → … → $3330)
📉 SELL ZONE: $3331–$3333 (SL: $3337; TPs: $3326 → … → $3300)
⚠️ SELL SCALP: $3313–$3315 (SL: $3320; TPs: $3310 → … → $3280)
🧭 Watchlist: Friday’s PCE, Fed commentary & Middle East tensions may sway price.

Is today Black Friday?On Thursday, gold prices rose to 3350 with support from 3333-30. When the key support of 3320 was broken, it indicated that the short-term rise turned into a fall. This morning, the rebound to 3320 confirmed the pressure of the top and bottom conversion, and then slowly fell all the way to break the integer mark of 3300 US dollars.
In 4 hours, it has fallen below the previous low of 3295, and will continue to fall. There are two support positions below, namely 3277 and 3263. Don’t expect a big rebound before going short in the negative market. If the rebound is large, it will not fall. This kind of negative decline is generally judged by the 15- and 30-minute patterns. When resistance appears in the big cycle, the market has actually fallen a lot.
Today, I think the pressure is mainly in the 3300 and 3310 areas. 3310 can be considered as the pressure of the top and bottom conversion. Pay attention to 3377 and 3363 below. If you consider more, you may be at a relatively extreme position of 3363. For the time being, the general direction is mainly short.


XAUUSD: Gold's Inflationary Tug-of-WarXAUUSD: Gold's Inflationary Tug-of-War – Navigating Powell's Remarks & Key Levels
Hello TradingView community!
Let's dive into Gold (XAUUSD) today, as its price action continues to be shaped by the Federal Reserve's (Fed) cautious stance on inflation and interest rates. Recent comments from Fed Chair Jerome Powell are particularly noteworthy.
🌍 Macroeconomic Drivers: Tariffs, Inflation, and Fed's Deliberation
The market finds itself in a complex situation following key statements from Fed Chair Jerome Powell:
Powell indicated that substantial tariffs could trigger a prolonged wave of inflation, potentially moving beyond conventional economic models. This introduces a new and significant factor into the inflation outlook.
Despite recent inflation moderation, Powell stressed the necessity of more data from June and July before considering any rate cuts. This underscores the Fed's cautious approach and lack of immediate urgency.
He also cautioned about the risk of "price shocks turning into persistent inflation".
In this environment, where market sentiment is stretched between hopes for rate cuts and the emerging risk of tariff-driven inflation, Gold maintains its role as a crucial psychological anchor. Should the Fed be slow to react to this potential new inflationary pressure, Gold's appeal could intensify.
📊 XAUUSD Technical Analysis & Trading Plan:
Based on the XAUUSD charts (H4/M30 timeframe) you provided (e.g., image_008403.png): Gold is currently undergoing a corrective or consolidating phase after a notable pullback. The price is trading below shorter-term moving averages, suggesting either bearish momentum or an accumulation phase.
Key Resistance Zones (Potential SELL Areas):
3,352.383 - 3,353.860: An immediate resistance point, coinciding with the 0.5 Fibonacci level.
Higher up: 3,391.750 - 3,395.000: This represents a very strong previous peak and a major resistance barrier.
Key Support Zones (Potential BUY Areas):
3,317.738 - 3,311.214: An intermediate support area, close to the 0.236 Fibonacci level.
3,302.939 - 3,302.857: A strong demand zone, aligning with the recent low.
Further down: 3,286.257: This is the next significant support level if preceding zones are breached.
🎯 XAUUSD Intraday Trading Plan:
Here are our refined zones and targets for today's trading:
BUY SCALP:
Entry: 3316 - 3314
SL: 3310
TP: 3320 - 3324 - 3328 - 3332 - 3336 - 3340
BUY ZONE:
Entry: 3304 - 3302
SL: 3298
TP: 3308 - 3312 - 3316 - 3320 - 3330 - 3340 - 3350
SELL SCALP:
Entry: 3353 - 3355
SL: 3360
TP: 3350 - 3345 - 3340 - 3335 - 3330
SELL ZONE:
Entry: 3390 - 3392
SL: 3396
TP: 3386 - 3382 - 3378 - 3374 - 3370 - 3360
⚠️ Key Factors to Monitor:
Fed Official Speeches: Any new comments from Fed officials regarding inflation or monetary policy outlook.
US Economic Data: Upcoming inflation (CPI, PCE) and employment reports (NFP) will be crucial for policy expectations.
Geopolitical Developments: Ongoing global tensions consistently bolster Gold's safe-haven appeal.
Trade wisely and always manage your risk effectively! Wishing everyone a profitable trading day!

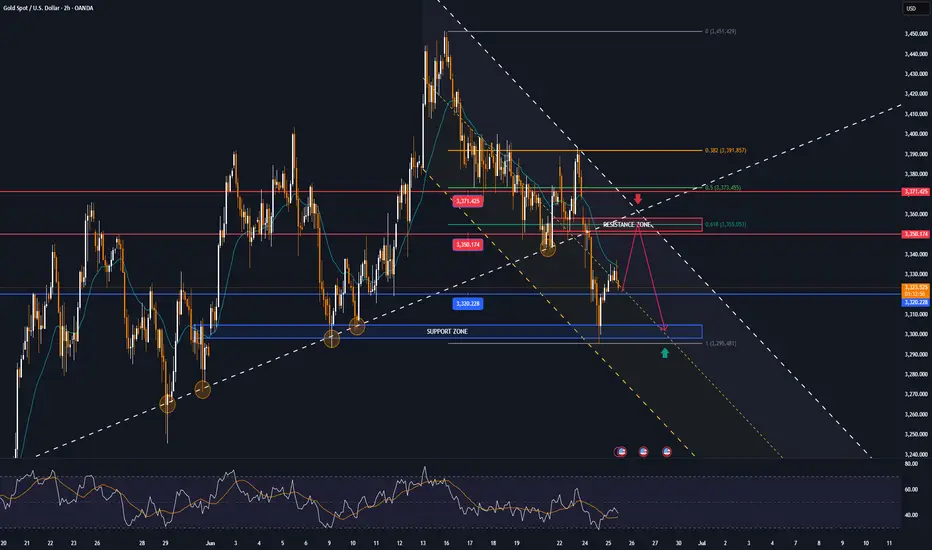
GOLD Trading: trategy: Look to SELL at resistance zone,downtrend🎯 Trade Setup:
Entry Zone (Sell Limit): 3,353 – 3,357 USD
Stop Loss (SL): 3,375 USD
Take Profit (TP): 3,280 – 3,283 USD
Risk-Reward Ratio: Approximately 1:3 → suitable for 2–4 session swing trades.
📊 Technical Analysis:
1. Overall Trend:
GOLD is clearly in a downtrend, confirmed by:
A descending trendline connecting recent lower highs.
Price consistently forming lower highs and lower lows.
2. Indicator-Based Analysis:
🔹 SMA 89 (Purple Line):
Price is trading below the 89-period SMA, confirming bearish momentum.
SMA89 acts as a dynamic resistance, and the 3,353–3,357 zone aligns with this resistance level.
🔹 BB20 (Bollinger Bands):
The upper band sits near 3,383, close to the SL zone → validating 3,375 as a proper stop.
Price is currently bouncing from the lower BB, so a rejection from the mid-to-upper band is likely, supporting a SELL setup.
🔹 Volume Analysis:
Volume is decreasing during this recent rebound, indicating:
Weak bullish pressure, typical of a corrective move.
The rally lacks conviction → strengthens the bearish case.

XAUUSD: Market Analysis and Strategy for June 25Gold technical analysis
Daily chart resistance 3400, support 3286
4-hour chart resistance 3354, support 3300
1-hour chart resistance 3343, support 3316
In the hourly chart, the rebound secondary high of $3357 has become an important resistance for the short-selling defense line. If the gold price fails to effectively break through this point, the short-selling trend will be difficult to reverse.
Personally, I expect that although gold prices will be under pressure due to weakened safe-haven demand in the short term, the uncertainty of the situation in the Middle East may limit its further decline. If the ceasefire agreement unexpectedly breaks down, safe-haven buying may quickly return, pushing gold prices to rebound. In addition, the market's adjustment of the Fed's expectations for rate cuts will continue to affect the trend of gold prices. If the expectation of a rate cut in September is further consolidated, gold prices may stabilize at a low level and try to move up.
The key support position below in the short term is 3316, followed by 3300. The important pressure position is around 3340!
Sell: 3340near
Buy: 3300near

GOLD recovers from 2-week low, short-term neutral biasOANDA:XAUUSD hit a two-week low in yesterday's trading session before recovering, currently trading around $3,330/oz, up slightly by about 0.14% on the day.
The main reason was the ceasefire between Iran and Israel, which curbed demand for safe-haven gold. In addition, Federal Reserve Chairman Powell made hawkish comments, which also affected the gold price trend.
Israel and Iran reach ceasefire agreement
A ceasefire came into effect on Tuesday under pressure from US President Donald Trump, raising optimism that the biggest military conflict between the two arch-rivals in the Middle East may be coming to an end.
The easing of tensions in the Middle East has been a major factor in the pressure on gold. Risk sentiment has weakened and the market has entered risk-on mode.
US President Trump announced on Monday evening that Israel and Iran had reached an agreement on a “complete and total ceasefire”. Iran’s state TV officially announced on Tuesday that Iran had ceased fire with Israel.
Israeli Defense Minister Israel Katz announced earlier Tuesday that the Israeli military would launch a new wave of strikes on targets in Tehran in retaliation for Iran's missile launch and "blatant violation" of the ceasefire.
The Israeli government said that Israel would hold off on further strikes on Iran after Prime Minister Benjamin Netanyahu spoke with US President Trump.
Powell sends important signal
Federal Reserve Chairman Powell will testify before the House Financial Services Committee on Tuesday and deliver a report on the Fed’s monetary policy. Powell will also testify before the Senate Banking Committee today (Wednesday).
In congressional testimony on Tuesday, Powell said the Fed needs more time to see whether tariffs are causing inflation to rise further before considering cutting interest rates.
In congressional testimony, Powell said he and most Fed officials expect inflation to rise soon and that the Fed is in no rush to cut rates before then.
“We are now in a very good position to wait and see what the likely path of the economy is before considering whether to adjust the policy stance,” Powell said.
Markets generally believe that the July 29-30 meeting is unlikely to result in a rate cut, with the first rate cut expected in September.
Technical Outlook Analysis OANDA:XAUUSD
With the current technical position, gold has not yet had a complete short-term trend as the price action is still around the EMA21 moving average, and the RSI is operating around the 50 level.
With the current price action showing that the market is still hesitant, gold may enter a sideways accumulation phase.
However, in terms of the long-term trend, gold is still in a long-term uptrend channel with the case for a complete downtrend to occur is the condition that the price action is taken below the raw price point of 3,300 USD. Then the downside target is the 0.50% Fibonacci retracement level in the short term.
During the day, the trend of gold is neutral with the expected operating range between 3,350 – 3,300 USD.
Notable positions will also be listed as follows.
Support: 3,320 – 3,300 USD
Resistance: 3,350 – 3,371 USD
SELL XAUUSD PRICE 3349 - 3347⚡️
↠↠ Stop Loss 3353
→Take Profit 1 3341
↨
→Take Profit 2 3335
BUY XAUUSD PRICE 3301 - 3303⚡️
↠↠ Stop Loss 3297
→Take Profit 1 3309
↨
→Take Profit 2 3315
XAUUSDGold has shown a strong historical pattern of impulsive rallies followed by significant corrections. After the recent explosive move from the $2,067 breakout zone to new all-time highs around $3,500, representing a +67% rally, the metal appears overextended and due for a healthy pullback.
Past cycles suggest that after such parabolic moves, price tends to retrace back to key demand zones or previous accumulation levels. In this case, the medium-term correction target aligns with the $2,800–$2,750 region — a strong structural support and confluence with the 2024 breakout base.
While the long-term trend remains bullish, this setup hints at a potential mean reversion or consolidation phase. Traders should remain cautious at current highs and watch for signs of distribution and lower highs forming in the coming weeks

Geopolitics Shake Markets: DXY, XAUUSD, BTCUSD in FocusThis week’s market prep session comes at a critical moment. With the U.S. launching airstrikes on Iran’s nuclear facilities, geopolitical tensions are shaking global markets. In this in-depth session, we break down how these developments are impacting:
💵 DXY (US Dollar) – Safe-haven flows and what to expect from Powell’s upcoming testimony
🥇 Gold (XAU/USD) – Why analysts are calling for $3,900/oz amid global uncertainty
₿ Bitcoin (BTC/USD) – Volatile moves and whether BTC is holding up as a modern-day safe haven
We’ll also preview key events like U.S. PCE inflation data and global central bank meetings that could drive major moves. Whether you’re trading FX, commodities, or crypto—this is the market insight you don’t want to miss.
📅 Watch now to position yourself ahead of the curve this week.
