Multiple bullish signals on GoldOver time, gold's price chart has shown a bull flag pattern in my previous analysis, followed by what appears to be an ascending triangle pattern combined with and inverted head and shoulders pattern. These multiple bullish patterns suggest a potential price increase to $3900/oz.
GOLDMINICFD trade ideas

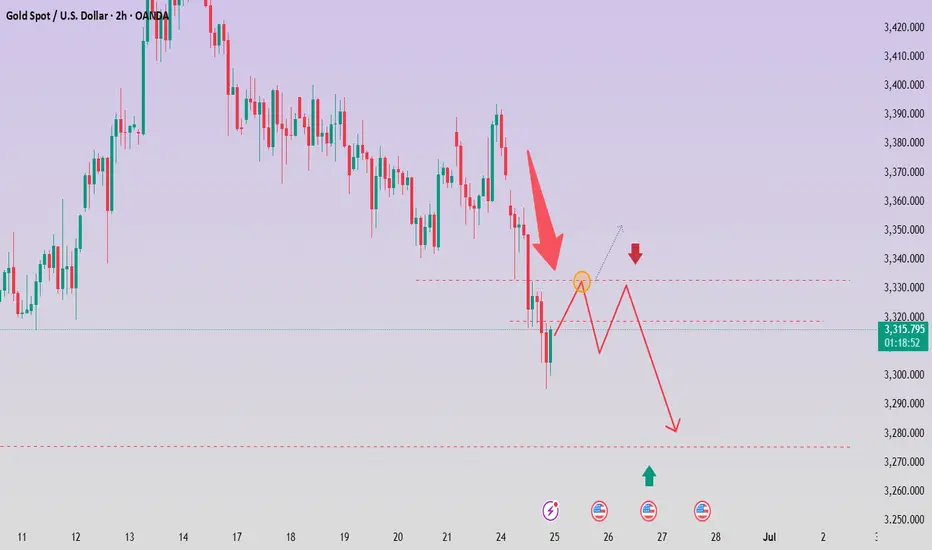
GOLD XAUUSD TodayGOLD XAUUSD Today for me maybe finish down move
Next week I expect change direction to LoNG setups.
My target will be new high.

Will gold prices continue to decline?On Tuesday, spot gold once fell below the $3,310 level and finally closed down 1.67% at $3,322.82 per ounce, as the Israel-Iran ceasefire dented safe-haven sentiment and Fed Chair Powell stated that more time is needed before considering interest rate cuts. Spot silver closed down 0.46% at $35.90 per ounce. The benchmark 10-year U.S. Treasury yield closed at 4.2960%, and the 2-year yield at 3.8310%. Powell indicated that current policy is in a favorable position to wait and see before considering rate adjustments, adding that "colleagues privately say I'm doing the right thing". The vast majority of officials believe rate cuts later this year would be appropriate, while noting it's "too early to declare the U.S. dollar is falling".
Technically, gold's daily chart formed a large bearish candle with a lower shadow, breaking below previous support levels amid consolidation. This suggests the bearish trend may persist.
you are currently struggling with losses,or are unsure which of the numerous trading strategies to follow,You have the option to join our VIP program. I will assist you and provide you with accurate trading signals, enabling you to navigate the financial markets with greater confidence and potentially achieve optimal trading results.
Trading Strategy:
sell@3330-3335
TP:3300-3295

GOLDThe US 10-year Treasury yield is approximately 4.29%, down about 0.03 percentage points (0.64%) from the previous day’s level around 4.32%–4.34%.
The US Dollar Index (DXY) is trading near 97.877, showing relative stability with minor fluctuations
Impact on Markets Today
The slight decline in the 10-year yield suggests modest easing of bond market pressure, possibly reflecting cautious investor sentiment amid ongoing fiscal concerns and expectations of Fed rate cuts later this year.
The DXY near 97.9 indicates a moderately strong dollar, though recent trends show some weakening due to fiscal worries and softer economic data.
Together, a stable-to-slightly weaker dollar and a modestly lower 10-year yield can support safe-haven assets like gold, though elevated yields still pose a headwind. But despite the dips of both the 10 year bond yield and the dollar index GOLD lost over 500pips from Asian session to Newyork session trading.
In brief: The US 10-year yield’s slight dip combined with a steady DXY reflects a market balancing inflation, fiscal concerns, and Fed policy outlook. This environment supports cautious risk-taking with safe-haven demand still relevant.
#gold #dollar

Buy gold, there may be a rebound in the short termAt present, gold has touched the area of 3325-3315 mentioned in my previous article, and the lowest price is around 3316. At present, due to the current important support area of 3310-3300 below, gold still has a rebound demand in the short term; although gold has not rebounded sharply at present, the downward momentum has indeed slowed down, and gold may rebound after the short force is consumed. Moreover, the ceasefire between Iran and Israel has not yet been settled. Moreover, the ceasefire between Iran and Israel has not yet been settled. With the fluctuating situation in the Middle East, bulls may have opportunities to counterattack.
However, the current performance of gold is indeed relatively weak, so there is no need to expect gold to rebound and fill the upper gap area of 3360-3370 in the short term; in trading, the rebound expectation can be appropriately lowered, and long positions can continue to be held and look up to the 3340-3350 area.

Breakout from Demand Zone🟡 XAU/USD – 2H Chart Analysis
Title: “Compression Breakout From Demand Zone – Room to Revisit Highs”
Bias: Bullish (Momentum Confirmation)
Timeframe: 2H
Chart Reference: MJTrading – June 23, 2025
📍 Context & Structure:
Gold has just broken out of a multi-candle compression range after tapping into a well-defined demand zone between $3,333 – $3,346. This area acted as the launchpad for previous rallies and is now showing fresh signs of accumulation.
Two EMAs (15 & 60) are attempting a bullish crossover, supporting a shift in momentum.
📈 Trade Setup (Long Bias):
Entry: ✅ Market or retest at $3,366
Stop Loss: 🔴 Below the recent demand base at $3,330
Target 1: 🟢 $3,415 (local swing high)
Target 2: 🟢 $3,460–$3,480 (upper major supply / range top)
R/R Ratio: 🔁 ~2
🔍 Why It Matters:
✅ Price defended key demand zone
✅ Strong engulfing candle with decent volume signals a reversal
⚖️ MJTrading Note:
“Gold thrives on uncertainty — and this bounce from a high-confluence demand zone could be the beginning of a push back toward the highs, especially if macro data shifts in favor.”
#MJTrading #Gold #XAUUSD #Forex #chart #signal #buy #long

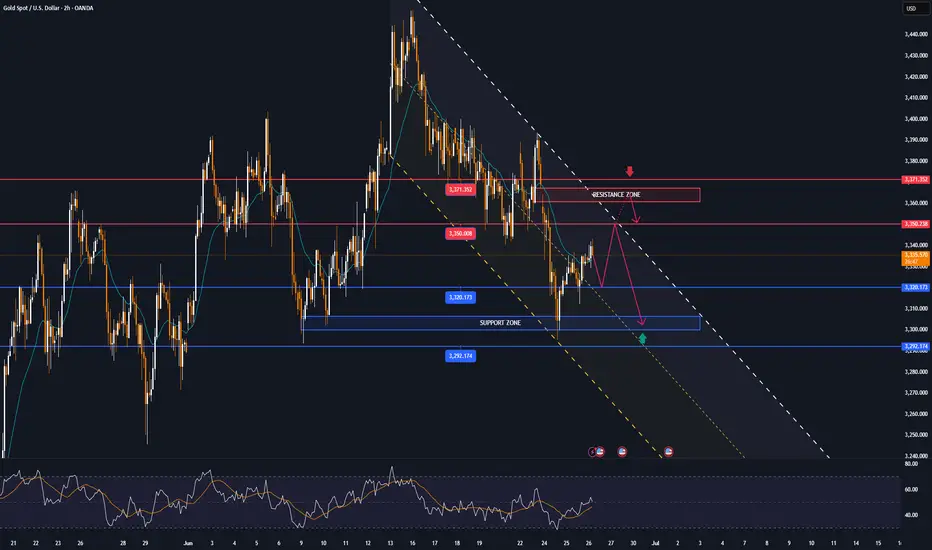
Gold Rejection Zone – Sell Setup in PlayGold (XAUUSD) is currently reacting to a key resistance zone (Teasure + Support Flip).
Price is testing the previous support, which may now act as resistance. A rejection from this level could trigger a strong sell-off.
Sell Confirmation:
If price fails to break above 3325, we may see downside continuation.
🎯 Target Zones (Diamonds):
Diamond 1: 3310
Diamond 2: 3300
Final support near 3295
🛑 Invalidation above: 3330
Structure favors sellers — waiting for bearish confirmation before entry. Use proper risk management.
Let’s see how price plays out around this zone. 📉⚠️

XAUUSD: Breakout or Bull Trap?Gold (XAUUSD) on the daily timeframe is showing signs of a temporary rebound after a sharp drop from the resistance zone at 3,452 USD. Specifically, the price has bounced back from the support area around 3,291 – 3,298 USD – a region aligned with dynamic EMA support and the 0.382 Fibonacci retracement of the previous bullish leg.
1. Key Technical Structure:
A clear reversal candlestick pattern has formed at a strong support zone, paving the way for a short-term technical rebound.
The 0.5 Fibonacci level at 3,346.5 is currently acting as the nearest resistance – aligning closely with today’s closing price.
EMA 20 and EMA 50 are beginning to converge, indicating market indecision on the next directional move.
2. Short-Term Price Scenarios:
Bullish Scenario: If price holds above the 3,291 – 3,298 support zone and breaks above 3,348, it could retest the 3,400 – 3,452 highs in the coming days. In this case, strengthening EMAs and bullish candle momentum would support this setup.
Bearish Scenario: Conversely, if the price fails to break through the 3,348 – 3,352 resistance zone and falls below 3,291 again, the market may head toward deeper support levels at 3,240 – or even as low as 3,167 USD.
3. Trading Recommendations:
Short-term Buy if there is a confirmed bullish candle closing above 3,348 with strong volume; stop loss below 3,291.
Sell on rally around 3,348 – 3,352 resistance if no clear breakout is confirmed.
Apply strict risk management, especially in a choppy market environment ahead of key macroeconomic data at the end of the month.
Conclusion:
XAUUSD is currently in a “trend re-evaluation zone.” Closely monitoring the 3,291 – 3,348 range will be the key to timing efficient entries in the short term.

GOLD recovers from around $3,300 area, short-term targetsOANDA:XAUUSD has recovered slightly and is currently trading around $3,332/oz, supported by a decline in the US dollar and US bond yields. The market is closely watching the fragile ceasefire between Israel and Iran.
The US Dollar Index TVC:DXY is near a one-week low, making dollar-priced gold more attractive to holders of other currencies. The benchmark 10-year US Treasury yield is holding near its lowest in more than a month.
As the conflict between Israel and Iran ends, geopolitical risk levels have disappeared, safe-haven funds have flowed back and thus gold is under pressure.
From a more macro perspective, gold remains in an uptrend and real yields are expected to fall further amid continued Fed easing. In the short term, if the market reprices rate cut expectations to become hawkish, this could trigger a technical correction in gold.
Economic data in the coming months will be particularly important for the gold market. If inflation data remains weak or the labor market deteriorates further, Fed officials could cut rates sooner or more significantly than expected.
A ceasefire between Iran and Israel brokered by U.S. President Donald Trump appeared to have taken effect on Wednesday, a day after both countries signaled a temporary end to their conflicting air strikes.
WASHINGTON (Reuters) - U.S. consumer confidence unexpectedly fell in June, reflecting growing concerns among households about job prospects and another sign of a weakening labor market amid uncertainty over Trump’s tariffs.
Federal Reserve Chairman Jerome Powell told Congress on Tuesday that higher tariffs could start to push up inflation this summer, a key period when the Fed considers whether to cut interest rates.
Traders of federal funds futures are currently pricing in a cumulative 60 basis points of rate cuts through 2025, with the first cut likely to come in September.
Technical Outlook Analysis OANDA:XAUUSD
Gold has recovered slightly after testing the important support area noted by readers in yesterday's edition, around the raw price point of $3,300. However, the temporary recovery is being limited by the EMA21 moving average, followed by the 0.236% Fibonacci retracement level, which can also be considered as upside targets for the time being.
In terms of overall structure, gold is still in an uptrend with the price channel as the main trend. On the other hand, RSI is also hovering around 50, indicating that the market sentiment is still hesitant and does not have enough momentum for a complete trend.
Intraday, gold still has a bullish technical outlook, but a sell-off that takes gold below the 0.382% Fibonacci retracement level would be a bearish signal in the near term. Therefore, long positions should be opened near the $3,300 area, with protective levels behind the 0.382% Fibonacci retracement.
Notable positions will also be listed as follows.
Support: $3,320 – $3,300 – $3,292
Resistance: $3,350 – $3,371
SELL XAUUSD PRICE 3367 - 3365⚡️
↠↠ Stop Loss 3371
→Take Profit 1 3359
↨
→Take Profit 2 3353
BUY XAUUSD PRICE 3301 - 3303⚡️
↠↠ Stop Loss 3297
→Take Profit 1 3309
↨
→Take Profit 2 3315
XAUUSD: Market Analysis and Strategy for June 23Gold technical analysis
Daily chart resistance 3450, support 3338
4-hour chart resistance 3395, support 3342
1-hour chart resistance 3373, support 3345
Today's gold trend, due to the geopolitical risk aversion caused by the weekend news, the gold price quickly rose and then fell, opening high and moving low. Today, the gold price fell to a low of 3347 and rebounded. At present, the gold price remains in the range of fluctuations. The trend of short-term gold prices fluctuates and falls. In terms of operation, don't rush to chase high prices. Although conflicts in the Middle East have been frequent recently, it seems that the impact on gold prices has also begun to weaken! The short-term key support position below is near 3340, and the important pressure position is near 3370-75
SELL:3372near
SELL:3400near
BUY:3350near

Urgent Gold Market AnalysisUrgent Gold Market Analysis: Trading Strategies After Iran's Parliament Approves Closing the Strait of Hormuz
I. Geopolitics: Market Reactions from "Threat" to "Action Countdown"
Iran's parliament has formally approved closing the Strait of Hormuz, though final decision-making rests with the Supreme National Security Council. This news is like lighting a fuse on a powder keg—while an actual blockade hasn’t occurred, the market has started pricing in "probability risks". Historical data shows the Strait of Hormuz handles 21% of global oil consumption (about 21 million barrels per day). If blocked, oil prices could surge 10%-15% within 48 hours, directly fueling global inflation expectations.
The current market contradiction lies in:
- **Tug-of-war between short-term panic and long-term doubt**: Hardline Iranian advisors have publicly called for "immediately closing the strait and striking U.S. warships", but the Supreme National Security Council is still weighing the costs of "mutual destruction"—80% of Iran’s own oil exports depend on the strait. This "brinkmanship" has trapped gold in a "neither rising nor falling" range, similar to knowing a storm is coming but unsure when to open an umbrella.
- **Signal game of military deployments**: The U.S. aircraft carrier Ford has arrived in the Arabian Sea, forming a three-carrier strike group with two others, while Iran has deployed missile boat clusters and electronic warfare units along the strait. This "tit-for-tat" posture makes gold’s safe-haven buying exhibit "event-driven" characteristics—each U.S. warship movement or Iranian missile drill triggers $5-$10 fluctuations in gold prices.
The market now stands at the center of a teeter-totter: on the left is the "energy bomb" of the Strait of Hormuz, and on the right is the "recession ghost" of the U.S. economy. $3,350 is the balance point, and the meeting minutes of Iran’s Supreme National Security Council will be the key weight determining which way the teeter-totter tilts. Operationally, it is recommended to refresh vessel tracking data and U.S. military movements every 4 hours to avoid being blindsided by market surprises amid information lags.
Analysis of gold trend next week, hope it helps you
XAUUSD buy@3370~3380
SL:3350
TP:3390~3400

What Happens Next? Has the up move started !?In line with my previous analysis, the price rose back above the lower trend line. Now looking at the detail of the bearish waves, it is possible that an up move could take the price to at least around 3440. That is my expectation. Keep in mind that this is a forecast as a result of an analysis.

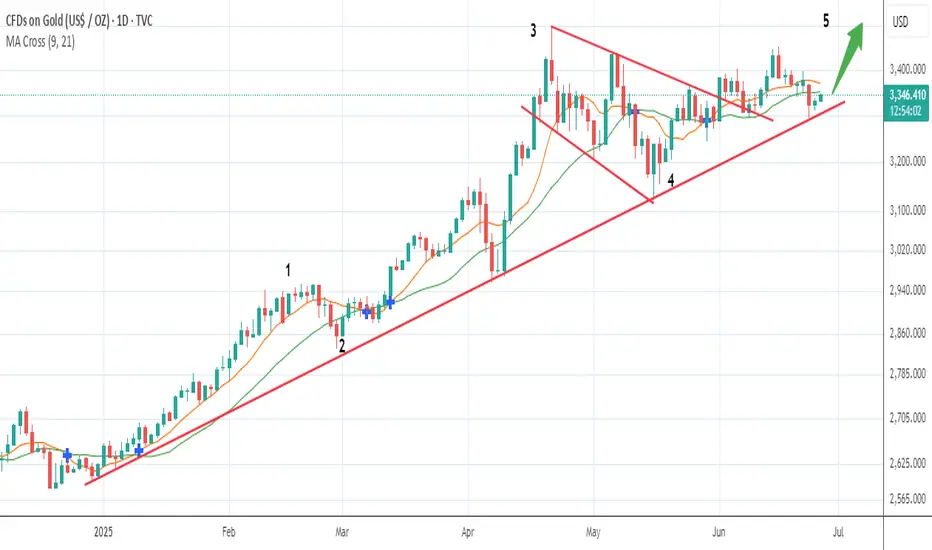
Ready, Steady...?Gold has consolidated the past few weeks and has now bounced from solid support.
The current wave 4 looks complete and should now be followed by a strong upward move in wave 5, wave 5's in the metals are the strongest...expect a move towards $4000 coming.
Your chance to get on board early and ride this bull run again!
Appreciate a thumbs up, good trading and God Bless you all!
Gold next targetAs you can see, we are getting a great buy from 3255 which is giving us support and you can see above that there is a fair value gap where we can get a great buy trip. If you want to play, you can play according to my analysis
GOLD 4H: not all that glitters is bullish...The 4H chart shows a clean descending triangle breakdown. Price failed to reclaim the trendline and was rejected under both MA50 and MA200. The bounce into 3325–3340 was absorbed — classic liquidity sweep and fade. Volume confirms bearish control.
Technically, the breakdown below 3320 opens the way toward $3293 (1.0 Fibo), $3250 (1.272 extension), and final target at $3195 (1.618), where buyers might step in. RSI supports the continuation without signs of reversal. Structure broke — and the market is telling us where it's heading.
Tactical plan:
— Entry at market or on a retest of $3325–3335
— Targets: $3293 → $3250 → $3195
— Stop: above $3340 (above MA50 and broken trendline)
When gold looks shiny, smart traders look deeper. This breakout isn’t golden — it’s a trap for late bulls.

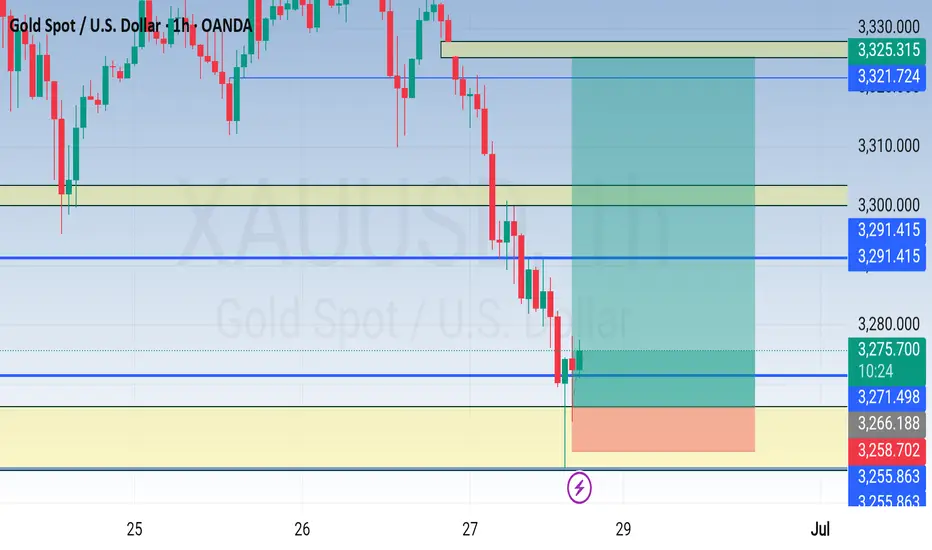
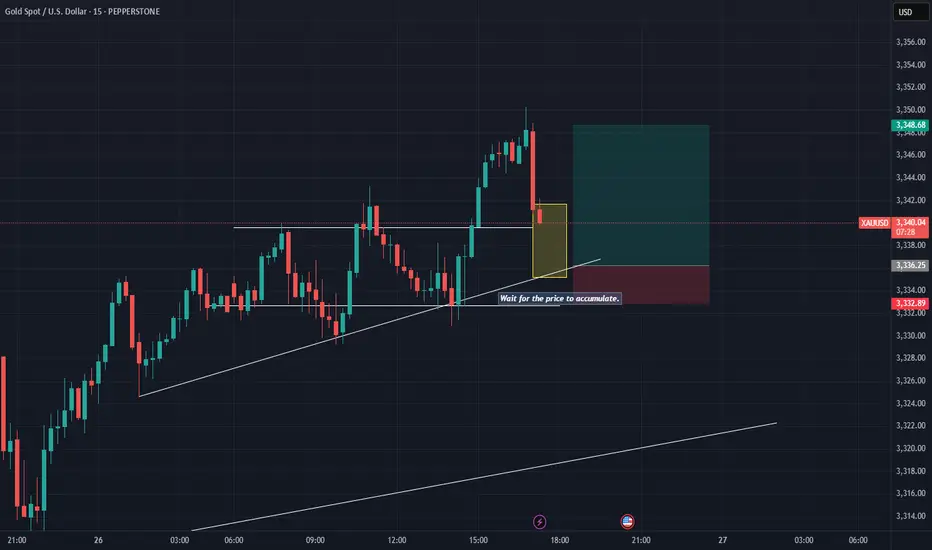
BREAK BREAK! - Gold Trend ChangeTrend Change
Wait for the price to accumulate and fill the imbalance below.
Watch out for Fake Breakout.
GOLD. Daily Timeframe overview with Initiative AnalysisHey traders and investors!
Daily Timeframe
Market phase : sideways. Seller's initiative.
Boundaries marked with black lines.
Gold followed an alternative scenario from the previous review toward 3435. The buyer played out the 8-9 vector of the range on the daily timeframe, and now the initiative has shifted to the seller. The seller's targets are 3245 and 3201 — areas to watch for potential buy patterns aiming for a new ATH. The price might get stuck in the 3293–3271 zone. If a strong buyer reaction occurs, a reversal may happen in this range.
The ideal area to look for buy patterns is around 3201.
Selling is risky.
This analysis is based on the Initiative Analysis concept (IA).
Wishing you profitable trades!

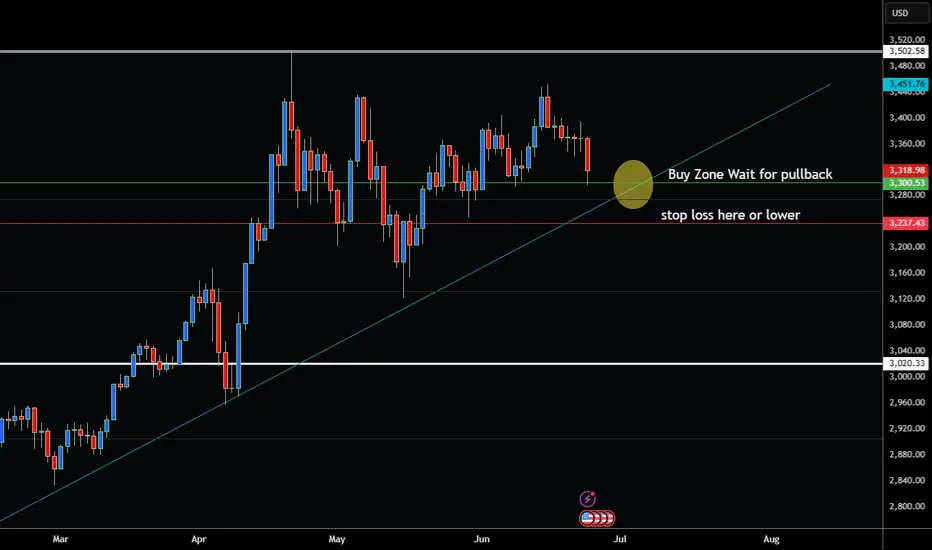
GOLD PULLS BACK TO BUY ZONE!Hey Traders so looking at Gold as we can see it has now pulled back to the trendline and is testing support at $3300 level.
So if bullish now is the time to buy it with a stop loss under support at 3237 or even maybe even 3200.
Also Seasonally Gold normally bottoms in the Summer around July or August.
Imo a wide stop is need to let the market breathe we don't want to be stopped out due to normal daily movement.
If bearish however be very careful this seems to me like strong bull market. I wouldn't think about shorting unless breaks below trendline and below 3200.
Always use Risk Management!
(Just in we are wrong in our analysis most experts recommend never to risk more than 2% of your account equity on any given trade.)
Good Luck & Hope This Helps Your Trading 😃
Clifford
Gold prices rose as dollar data was not good
📌 Gold information:
Gold prices plunged on Tuesday as a ceasefire was declared in the 12-day war between Iran and Israel, market risk appetite rebounded, and demand for safe-haven assets declined. The ceasefire news pushed global stocks higher, while oil prices fell to a two-week low as concerns about supply disruptions eased. The plunge in crude oil prices also further suppressed gold's inflation hedging appeal. As an interest-free asset, gold prices are under pressure against the backdrop of waning risk aversion, but there is still buying support at low levels.
Investors are currently focusing on Federal Reserve Chairman Jerome Powell's appearance at a House Financial Services Committee hearing. Powell has been cautious on whether to cut interest rates in the near future.
📊Comment Analysis
The current market selling sentiment has increased significantly, and for gold, falling seems to be the only way to go. Today, whether you look at rebound short or low long, basically you will not have a chance, that is, falling, it seems that the market has lost hope in gold, and the current gold has fallen to 3295, and the break of 3300 declares that gold has further room to fall. From the trend point of view, it is likely to fall now!
The further strong support on the current trend line is around 3274, and it is not ruled out that it will fall directly to the current position. At present, the Federal Reserve is still speaking, and whether it will cause drastic fluctuations in gold in the future is still unpredictable, but from today's trend, shorting is already the best solution at present, and the upper resistance can first look at 3330!
💰Strategy Package
Gold: Rebound 3325-3335 short, stop loss 3345, target 3290-3300!
⭐️ Note: Labaron hopes that traders can properly manage their funds
- Choose the lot size that matches your funds
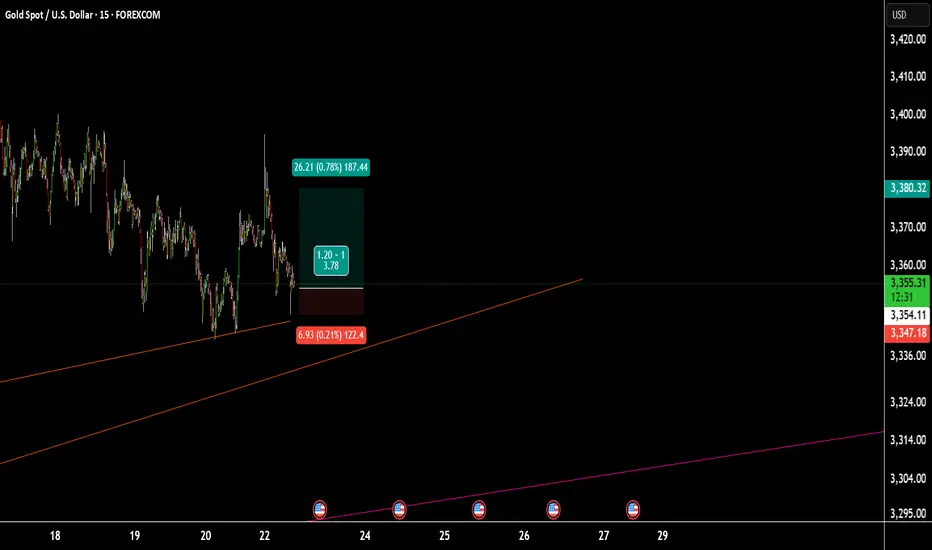
XAUUSD Long a bittake a bit buy on XAUUSD
long with RR 1:3
I just check the trend line and the FVG that filled at bottom.

XAUUSD MARKET LAYOUTGold has shown to be bearish following the lower liquidity sweep trend channel just as shown in the analysis.
This trend channel shows a path down to the 3270's and 3260's.
Further updates would be given as the market gains momentum.

Advance technical analysis AUX USD ✅ Advanced Technical Analysis – XAU/USD (Gold) – 1H Timeframe
🧩 Chart Overview:
Timeframe: 1 Hour (H1)
Current Price: 3,333.675
Recent High: 3,451.525
Recent Low: 3,293.500
Marked with BOS (Break of Structure), CHoCH (Change of Character), supply and demand zones.
---
🔍 Step-by-Step Technical Breakdown:
---
1️⃣ Market Structure (Price Action)
🔺 Bullish Phase:
From June 13 to June 22, price showed a series of H1 BOS, confirming bullish structure.
🔻 Shift to Bearish:
After June 22, we observe several H1 CHoCH and BOS to the downside.
This indicates a clear transition from bullish to bearish, or at least a corrective phase.
---
2️⃣ Supply & Demand Zones
🟢 Demand Zone:
Marked between 3,293.5 and ~3,310
Price dipped into this zone and showed a minor bullish reaction (lower wick = liquidity grab)
🔴 Supply Zones:
Resistance at 3,393.509 (minor)
Stronger supply between 3,440 and 3,451 (previous unbroken highs)
---
3️⃣ Fibonacci & Potential Reversal Targets
If demand holds and bullish confirmation appears:
TP1: 3,393
TP2: 3,440
TP3: 3,451.5
These levels align well with structure and historical resistance.
---
4️⃣ Candlestick Behavior
Recent candles show price tapping the demand zone with some rejection.
Look for bullish engulfing, pin bars, or momentum candles as confirmation.
---
5️⃣ Potential Long Setup (If Confirmed):
Element Value
Entry Zone 3,305 – 3,315
Stop Loss Below 3,293 (e.g., 3,285)
TP1 3,393
TP2 3,440
TP3 3,451
Risk–Reward Estimated 1:3 to 1:5
---
⚠️ Risks & Considerations:
If the 3,293 demand zone breaks, bearish structure may continue.
Liquidity grabs and false breakouts are possible – wait for solid confirmation.
Align your entries with higher timeframe signals (e.g., H4) for stronger confluence.
---
❗️Disclaimer:
> This analysis is provided for educational purposes only and does not constitute financial advice or a recommendation to buy or sell.
You are solely responsible for your own trading decisions.
