Gold may exit from pennant and rise to resistance levelHello traders, I want share with you my opinion about Gold. The price previously made a strong impulse upward, forming a downward pennant, but this move lost steam after touching the seller zone around 3430 - 3440. From there, the market reversed and dropped sharply below the support level, even creating a visible gap. Didn’t last long, the price recovered quickly and made another strong move up, breaking out of the downward pennant structure. Since then, Gold has been trading inside a new formation, an upward pennant, where both support and resistance lines are gradually converging. This setup suggests growing pressure and the potential for a breakout. Currently, the price is hovering near the support line of this upward pennant. In my opinion, we may see a small correction to test this support, followed by a bullish rebound. If the structure holds, Gold could break out upward and head directly toward the 3430 resistance level, which matches the upper boundary of the previous seller zone — this is my TP 1. Given the strong impulse structure and continuation pattern, I remain bullish and expect further growth after this local retest. Please share this idea with your friends and click Boost 🚀
Disclaimer: As part of ThinkMarkets’ Influencer Program, I am sponsored to share and publish their charts in my analysis.
GOLDMINICFD trade ideas

GOLD → Local bearish trend. Retest of support.FX:XAUUSD is technically looking a little weak. Support is being retested amid de-escalation of geopolitical conflicts in the Middle East. Interest in the metal is waning.
On Friday, gold remains under pressure ahead of data on the core PCE index, a key inflation indicator for the Fed. If inflation turns out to be higher than expected, this could strengthen expectations of a rate cut as early as July, supporting gold. The probability of a July cut is currently estimated at 21%, and 75% for September. Amid dollar volatility caused by rumors of a possible Fed chair replacement and trade negotiations with the EU and China, traders remain cautious, awaiting clarity on inflation and monetary policy
Technically, before falling, gold may form a correction to 3320 (liquidity capture).
Resistance levels: 3320, 3336, 3347
Support levels: 3293, 3271
If the fundamental background remains unchanged and gold continues to decline towards support at 3293 and break through this level, the breakout could lead to a fall to 3271. However, I do not rule out the possibility that after a sharp decline, a correction to 3320 could form before the fall.
Best regards, R. Linda!

GOLD - Price can rise in channel to $3495 resistance lineHi guys, this is my overview for XAUUSD, feel free to check it and write your feedback in comments👊
After price started to trades inside triangle, it made an impulse up, breaking two levels, after which turned around.
Price dropped to $3195 level, breaking resistance level, and made a first gap, after which rose to resistance line.
Then Gold in a short time declined to support line, making a two gaps again and then bounced up from support line.
Gold exited from triangle and continued to move up inside rising channel, where it first made a correction.
In channel, price grew higher than $3400 level, but recently turned around and fell to support line.
Now, I expect that Gold can bounce from this line and rise to $3495 resistance line, breaking resistance level.
If this post is useful to you, you can support me with like/boost and advice in comments❤️
Disclaimer: As part of ThinkMarkets’ Influencer Program, I am sponsored to share and publish their charts in my analysis.

Gold Holding Strong – Eyes on $3400 and Beyond! (READ)By analyzing the gold chart on the 4-hour timeframe, we can see that after our last analysis, the price corrected down to $3341, then rallied back up to $3399. Currently, gold is trading around $3373, and if it manages to hold above $3355, we can expect further upside movement.
Potential bullish targets are $3400, $3417, $3450, and $3468.

XAUUSD Daily Outlook | June 23, 2025👋 Hello Gold traders!
We’re entering a new week with structure sharpening around key zones. Price is now hovering just below the decision shelf at 3385, and all eyes are on whether bulls defend structure — or bears trigger the first real trap. Let’s zoom in with pure Daily focus and zero noise.
🔸 DAILY STRUCTURE OUTLOOK
Gold remains in a clear bullish trend on the Daily timeframe, with the last confirmed Higher High at 3452. However, current price is in a retracement phase, testing the area just below the BOS and reacting to recent liquidity sweeps.
Despite rising USD pressure, the bullish structure remains intact unless a daily close breaks below 3315.
📌 Daily Bias: Bullish (retracement phase active)
🧭 Macro Context:
Heavy Fed week: Powell testifies Tue & Wed, Core PCE and Consumer Sentiment hit Fri.
USD may remain supported short-term, but gold still benefits from long-term inflation hedge + geopolitical risk flows.
🔹 STRUCTURAL KEY ZONES (D1)
Type Zone Confluences
🟢 Buy Zone #1 3320 – 3340 Daily OB, FVG base, EMA50 , structure HL defense
🔵 Buy Zone #2 3265 – 3285 Untapped OB + imbalance, deeper fib retrace
🟠 Flip Zone 3363 – 3385 Former BOS, FVG retest, minor liquidity shelf
🔴 Sell Zone #1 3405 – 3425 First sweep of equal highs, premium OB, FVG pocket
🔴 Sell Zone #2 3440 – 3460 Extreme bull trap: clean OB top, imbalance cluster
🎯 EXECUTION PLAN
🔍 Flip Zone is your battlefield — if bulls reclaim this zone cleanly, we may revisit 3405.
📉 3405–3425 offers the first sniper short opportunity: liquidity sweep + OB + FVG = prime short trigger.
📈 3320–3340 is the cleanest high-RR long zone — only enter if price reacts with strength and forms a rejection candle or bullish engulfing.
🧊 If 3320 fails, standby at 3265–3285 for a deeper correction entry backed by clean OB/FVG logic.
✅ SUMMARY & ACTION PLAN
Wait for confirmation at the Flip Zone — do not force direction.
Most precise sniper trades expected:
🔻 Sell from 3405–3425 → target Flip Zone
🔺 Buy from 3320–3340 → target 3385–3400
Only engage with clear OB reactions and strong PA confirmation — no bounce chasing.
💬 If this outlook gave you clarity, drop a 🚀 and a like to support the work — it helps more traders find it.
💡 Got feedback or want to ask something? Comment below — we read everything.
📌 Follow GoldFxMinds for high-precision sniper plans, every single day.
📌 Disclaimer: I'm part of Trade Nation's Influencer Program and receive compensation for using their charts on TradingView. This content is for educational purposes only.
— GoldFxMinds

GOLD[XAUUSD]: Breakthrough the bearish pressure, What next?Evening Everyone,
Hope you are doing great, price recently breakthrough the current price inducement, showing a strong bullish volume emerging in the market. Long term approach remain bullish ultimately taking the price towards the new high.
Good luck
Team Setupsfx_

GOLD ROUTE MAP UPDATEHey Everyone,
A fantastic close to the week as our analysis once again played out level to level with precision!
As a follow-up from yesterday's post:
- The swing range completed the move into 3348, as expected.
- However, we had no further EMA5 lock above, confirming rejection back into the swing range.
- This was followed by an EMA5 cross and lock below 3306, opening the secondary swing range.
- That range played out perfectly today, hitting both 3288 and 3271 targets.
We’re now seeing a bounce off those levels giving the 20 to 40 pips, and we will now be observing to see if the full secondary swing is completed.
It's Friday, and it's been a PIPTASTIC week across the board. Well done to everyone following the plan and sticking to the levels.
QUICK RECAP
BULLISH TARGET
3376 - DONE
BEARISH TARGETS
3348 - DONE
EMA5 CROSS AND LOCK BELOW 3348 WILL OPEN THE SWING RANGE
3330 - DONE
3306 - DONE
EMA5 CROSS AND LOCK BELOW 3306 WILL OPEN THE SECONDARY SWING RANGE
3288 - DONE
3271 - DONE
We’ll be back now on Sunday with our multi-timeframe analysis and trading plans for the week ahead. Thanks again for all your likes, comments, and follows.
Wishing you all a fantastic weekend!!
Mr Gold
GoldViewFX

THE KOG REPORT - Update End of day update from us here at KOG:
Well, we actually did want higher but there was no break above, instead, we got the break below and then the move commenced overnight, most of which we missed. We did capture part of it on the tap and bounce, then another trade now on a RIP from lower Excalibur which was hit. Not bad, not amazing, just another day on the markets.
Now, we have support at the 3310-6 level with resistance at 3330 which could be the target over the sessions to come. As long as support holds, we'll hold as well.
As always, trade safe.
KOG

GOLD Bearish Breakout!#GOLD is trading in a
UPtrend and Broke our of the bearish
Wedge pattern then made
A retest and is going down
Now so we are bearish
Biased and we will be
Expecting a further move down !

Hanzo / Gold 15 min - 0 draw down tactical Reversal Entrys🔥 Gold – 30 Min Scalping Analysis (Bearish Setup)
⚡️ Objective: Precision Breakout Execution
Time Frame: 30-Minute Warfare
Entry Mode: Only after verified breakout — no emotion, no gamble.
👌Bullish Reversal : 3347.5
Price must break liquidity with high volume to confirm the move.
👌Bullish Reversal : 3350
Price must break liquidity with high volume to confirm the move.
👌Bearish Reversal : 3373.5
Price must break liquidity with high volume to confirm the move.
☄️ Hanzo Protocol: Dual-Direction Entry Intel
➕ Zone Activated: Strategic liquidity layer detected — mapped through refined supply/demand mechanics. Volatility now rising. This isn’t noise — this is bait for the untrained. We're not them.
🦸♂️ Tactical Note:
The kill shot only comes after the trap is exposed and volume betrays their position.

GOLD: Local Bullish Bias! Long!
My dear friends,
Today we will analyse GOLD together☺️
The recent price action suggests a shift in mid-term momentum. A break above the current local range around 3,314.13 will confirm the new direction upwards with the target being the next key level of 3,322.84 and a reconvened placement of a stop-loss beyond the range.
❤️Sending you lots of Love and Hugs❤️

Lingrid | GOLD Bear Channel Break: Short OpportunityOANDA:XAUUSD has broken down from the upward channel and is now trading below the key 3,321 level, which previously served as support. The price is forming a bearish structure beneath the black and blue trendlines, with 3,250 emerging as the next potential target. A minor relief bounce could retest 3,320, but rejection here would reinforce downside continuation.
📈 Key Levels
Sell zone: 3,315–3,330
Sell trigger: rejection below 3,321
Target: 3,250
Sell confirmation: breakdown from 3,285 with momentum
💡 Risks
False breakout above 3,321 could trap sellers
Weak bearish momentum may result in sideways chop
Re-entry into channel could negate bearish outlook
If this idea resonates with you or you have your own opinion, traders, hit the comments. I’m excited to read your thoughts!

Gold: Breakout and Potential Retrace!!Hey Traders, in today's trading session we are monitoring XAUUSD for a selling opportunity around 3,390 zone, Gold was trading in an uptrend and successfully managed to break it out. Currently is in a correction phase in which it is approaching the retrace area at 3,390 support and resistance zone.
Trade safe, Joe.

XAUUSD has been in a strong free fall following the sell strategXAUUSD has dropped sharply in a free fall, perfectly following the sell strategy from 3348–3350.
We have won.
Trading Strategy for XAUUSD OANDA:XAUUSD
Based on the current price structure and short-term bias, here are two tactical trade setups:
Sell Setup – If Price Rejects Resistance
Entry: 3,348 – 3,350 USD
Stop-loss: 3,357 USD
Take-Profit 1: 3,340 USD
Take-Profit 2: 3,335 USD
Take-Profit 3: 3,330 USD
Buy Setup – If Price Holds Support
Entry: 3,328 – 3,330 USD
Stop-loss: 3,320 USD
Take-Profit 1: 3,338 USD
Take-Profit 2: 3,340 USD
Take-Profit 3: 3,348 USD
Important: Always set a stop-loss in every trade to manage risk effectively.

GOLD. Why is Gold Rising Again?The yellow metal is one again receiving support driven by two main factors. The first is the continued risk of failure in the negotiations between Tehran and Tel Aviv. The second is related to the chronic weakness of the U.S. dollar amid the American economy slipping into a recession, which may persist for a prolonged period, and the uncertainty surrounding the future global impact of Donald Trump's customs tariff policy.
From a technical perspective, gold prices continue to be in a long-term upward trend. The bullish momentum, driven by the aforementioned reasons, may continue after breaking and consolidating above the 3340 level.
Technical Outlook and Trading Idea:
The price is trading above the middle line of the Bollinger Bands, as well as above the 5-and 14-period SMAs , which have crossed and are giving a buy signal. The RSI is crossing the 50% mark, also indicating a buy. the Stochastic Oscillator is above 50% and continues to rise.
In this situation, I believe gold should be bought, with a potential rise toward 3384. A likely entry point for a buy position could be considered around 3347.

GOLD: In a Very Complex ScenarioGOLD: In a Very Complex Scenario
Gold remains in a highly complex scenario, as price action appears disconnected from current news events.
The absence of bullish volume is concerning and suggests a lack of conviction in the market.
A significant move may unfold precisely when it's least anticipated.
You may watch the analysis for further details
Thank you and Good Luck!
❤️PS: Please support with a like or comment if you find this analysis useful for your trading day❤️

Gold (XAU/USD) Bearish Trade Setup – June 27, 2025Entry Point: Around 3,300.98 USD
Stop Loss (SL): ~3,312.20 USD
Take Profit (TP): 3,229.33 USD
Current Price: 3,286.15 USD
Risk-Reward Ratio: ~1:6.3
(Potential reward ≈ 71.65 pts; risk ≈ 11.22 pts)
Technical Breakdown:
Trend:
The price is in a short-term downtrend, supported by:
Lower highs and lower lows.
Price trading below both 50 EMA (red) and 200 EMA (blue), confirming bearish momentum.
Bearish Breakout:
Price broke below a key support-turned-resistance zone near 3,300–3,302, triggering sell pressure.
Resistance Area:
Strong rejection at 3,302–3,312 zone, which is now acting as resistance.
SL is placed just above this zone to protect against false breakouts.
Target Zone:
TP set at 3,229.33, aligning with a previous support zone — a logical area for price to react.
Strategy Notes:
Bias: Bearish
Entry confirmation: Already triggered.
Risk Management: SL placement is tight and strategic; RR ratio is highly favorable.
Next support below TP: If 3,229 breaks, further downside could follow.
Summary:
This setup shows a well-defined bearish continuation with a clean break of support, a controlled SL above resistance, and a strong RR ratio. A suitable trade for trend-following strategies, but price must not retrace above 3,312 for this idea to remain valid.

Gold - Bull has taken back controlLast Friday , bullish momentum started to kick in after a long bearish week.
Leaving liquidity on the sell side with FVG and OB on the Sell Side
I am anticipating the price will sweep the BSL first and then to the SSL and collect order from the 1H OB.

XAU/USD 2h chart pattern.I'm provided for XAUUSD (Gold Spot / U.S. Dollar) on the 2-hour timeframe, here's the analysis:
---
📉 Chart Pattern Insight
A clear ascending channel was forming.
Price broke below the lower trendline (highlighted in orange), signaling a potential bearish breakdown.
The price is currently retesting the broken trendline and starting to reject it — a bearish sign.
---
🎯 Target Levels Identified on Chart
You’ve marked two bearish targets with arrows:
1. First Target: Around $3,280
This aligns with a previous minor support area.
A reasonable short-term target after the trendline break.
2. Second (Deeper) Target: Around $3,245
Likely based on the full height of the channel projected downward (measured move).
This level could be the next major support.
---
📌 Summary:
Target Price Level Confidence
First Target ~$3,280 Medium-High
Final Target ~$3,245 Medium
---
Let me know if you'd like help setting stop-loss levels, trade management tips, or a risk-reward calculation based on your entry.

Hanzo Drex | 15-Min Bearish Reversal Setup – 300 Pips in Sight🔥 Gold – 15 Min Scalping Analysis
⚡️ Objective: Precision Reversal Execution
Time Frame: 15 -Minute Warfare
Entry Mode: Only after verified Reversals
👌Bearish Reversal : 3346
Price must break liquidity with high volume to confirm the move.
☄️ Hanzo Protocol: Dual-Direction Entry Intel
➕ Zone Activated: Strategic liquidity layer detected — mapped through refined supply/demand mechanics. Volatility now rising. This isn’t noise — this is bait for the untrained. We're not them.
🦸♂️ Tactical Note:
The kill shot only comes after the trap is exposed and volume betrays their position.
5

Gold Potential UpsidesHey Traders, in today's trading session we are monitoring XAUUSD for a buying opportunity around 3,300 zone, Gold is trading in an uptrend and currently is in a correction phase in which it is approaching the trend at 3,300 support and resistance area.
Trade safe, Joe.

XAU/USD) Bullish trand Read The captionSMC trading point update
Technical analysis of Gold (XAU/USD) on the 1-hour timeframe, highlighting a breakout from consolidation supported by key levels and trend structure. Here’s the detailed analysis:
---
Technical Breakdown
1. Key Support Zone
Price has formed a strong base around 3,315–3,325, with multiple bullish rejections (green arrows).
This zone has acted as a demand level, reinforcing bullish structure.
2. Ascending Trendline Support
An uptrend line supports higher lows, showing momentum building to the upside.
3. EMA 200
Price is now challenging the 200 EMA (3,353.41) — a key dynamic resistance.
A successful breakout and retest above this EMA will likely fuel continued bullish movement.
4. Breakout & Measured Move Projections
The chart indicates a bullish breakout from a consolidation box (yellow zone).
Measured move targets based on the previous rally:
First target: 3,368.86 (1.17%)
Second target: 3,381.55 (1.75%)
5. RSI Confirmation
RSI (14) is around 57, showing bullish momentum but still below overbought—supporting further upside potential.
Mr SMC Trading point
---
Conclusion / Idea Summary
Bias: Bullish
Entry Zone: On pullback into 3,330–3,340 range or breakout retest above EMA 200
Targets:
3,368.86
3,381.55
Invalidation: Sustained close below 3,320 and break of the uptrend line
---
Please support boost 🚀 this analysis)

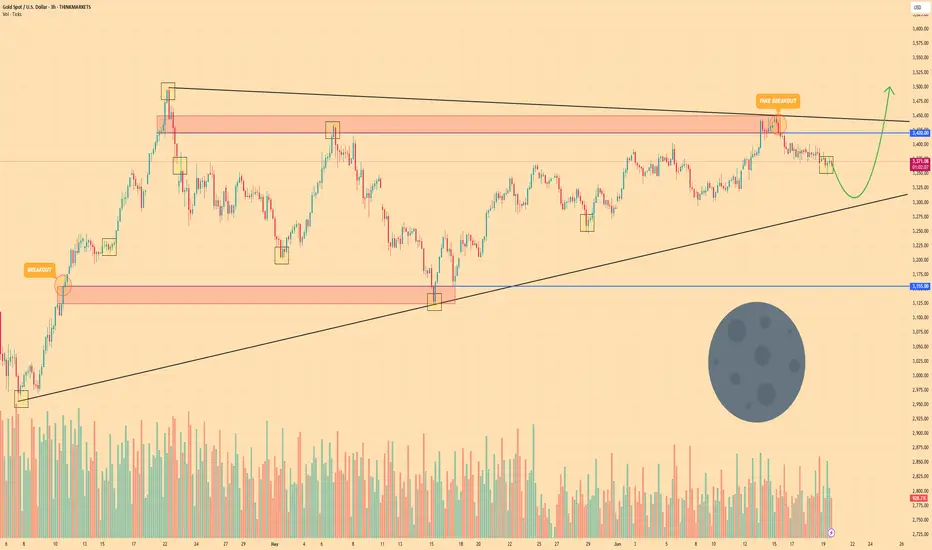
GOLD - Price may bounce up from wedge to $3500 points Hi guys, this is my overview for XAUUSD, feel free to check it and write your feedback in comments👊
A few moments ago, price entered to wedge, where it at once made an upward impulse from the support line.
Price broke $3155 with $3420 level and reached resistance line, but soon turned around and started to decline.
After this, Gold broke the $3420 level one more time and later tried to grow, but when it reached the resistance zone, it dropped.
Next, price bounced from support line of wedge and started to grow and in a short time rose to $3420 level.
Recently, it declined below, making a fake breakout of the resistance level, and now it continues to decline.
In my mind, Gold can decline a little more and then bounce up to $3500, breaking the resistance level.
If this post is useful to you, you can support me with like/boost and advice in comments❤️
Disclaimer: As part of ThinkMarkets’ Influencer Program, I am sponsored to share and publish their charts in my analysis.