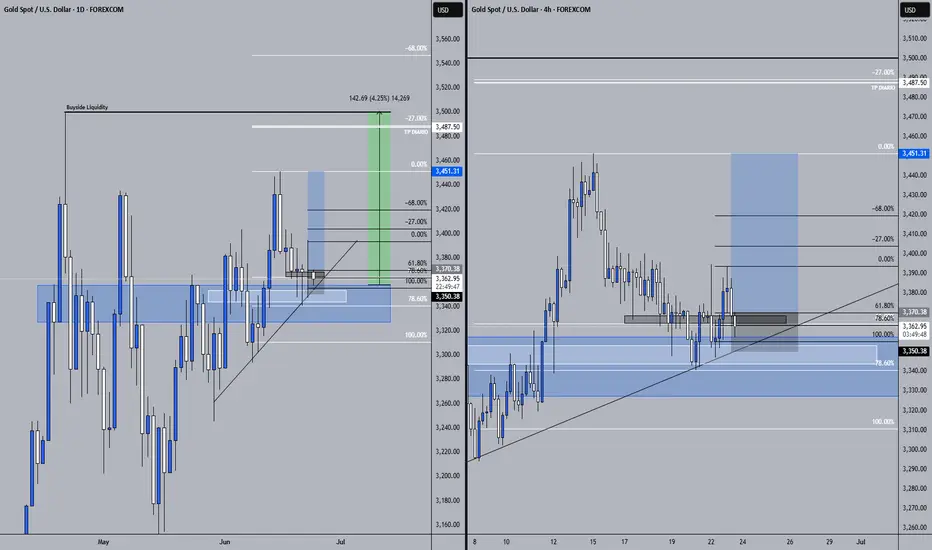
Important support level for gold price: 3305-3315Important support level for gold price: 3305-3315
Most people in the market were originally bullish. After all, the US sneak attack on Iran did cause tension, but the market unexpectedly weakened and fell.
Intraday trading:
The macro shock structure is shown in Figure 4h:
Focus on the fluctuations in the range of 3300-3400 US dollars.
From the hourly line observation: the gold price may currently enter the flag adjustment stage.
Short-term resistance is: 3368, followed by the high point of 3393, and the overall trend is still facing short-selling pressure.
Due to the recent large fluctuations in gold prices, market sentiment will not subside quickly.
It is necessary to pay attention to whether it can stand on the first key position of 3368 today.
After a short-term rapid decline, it is not advisable to directly chase short positions and increase positions, and it is necessary to wait and see appropriately.
Although yesterday's trading was difficult, the current market has sent a clear signal:
The callback is an opportunity to continue shorting!
Today's gold operation strategy recommends shorting at high levels and long at low levels.
Upper pressure range: 3368-3388;
Lower support range: 3330-3300;
If it falls below $3350, it may fall to $3300.
Low price long range: 3305-3315, stop loss range: 3300-3295
High price short range: 3368-3380, stop loss range: 3388-3395
GOLDMINICFD trade ideas

Will gold pull back today?During the Asian trading session, spot gold fluctuated lower, once breaking below the 3,350 level to $3,333.16 per ounce. This followed U.S. President Trump's announcement that Israel and Iran had fully reached an agreement to implement a comprehensive ceasefire, leading to a rapid cooling of market concerns over the Middle East situation and suppressing gold's safe-haven demand. The conclusion of the ceasefire agreement has dispelled market fears of conflict escalation, causing gold, silver, and crude oil prices to decline accordingly.
After yesterday's repeated oscillations, gold failed to break through the 3,400 resistance level last night. Instead, it tested the support at 3,340 in today's early trading. From the current price chart, the hourly candlestick has pierced the 3,340 level, but the candlestick body has not closed below 3,340. The prior downward test of support indicates that the market remains weak for now. The temporary effective lower support lies at 3,333, and a break below this level could lead to a move toward 3,280. The effective resistance is at 3,375, and a breakthrough above this level may target 3,405.
you are currently struggling with losses,or are unsure which of the numerous trading strategies to follow,You have the option to join our VIP program. I will assist you and provide you with accurate trading signals, enabling you to navigate the financial markets with greater confidence and potentially achieve optimal trading results.
Trading Strategy:
sell@3360-3365
TP:3335-3340

XAUUSD 23/06/2025Weekly:
-Price keeps making HH's.
-Bullish M pattern.
-IC.
Daily:
-Bullish M pattern.
-Inverse H&S pattern.
4H:
-Bullish M pattern.
-Inverse H&S pattern.
XAUUSD:Sharing of the Latest Trading StrategyAll the trading signals today have resulted in profits!!! Check it!!!👉👉👉
Today's opening gapped up to 3396, then fell all the way back to 3347 before stabilizing and rallying to 3380—our long strategy at 3350 achieved perfect profits. The basic trend aligns with last week's pattern, dominated by pullback rebounds.
Channel Resistance: Key pressure lies at 3397–3404.
Support Zones: Monitor rebounds at 3360–3365 and 3355–3350; maintain a bullish bias on dips.
Trading Strategy:
buy@3350-3360
TP:3380-3400
Share accurate trading signals daily—transform your life starting now!
👇 👇 👇 Obtain signals👉👉👉

Gold focuses on the long and short changes at 3340Gold focuses on the long and short changes at 3340
Technical analysis of gold at the beginning of the week: the oscillating pattern is waiting to be broken, and attention should be paid to the gains and losses in the key range
Market review
Last week, gold maintained a volatile trend. After the disturbance of the weekend news, it opened at 3396 on Monday and then fell back to 3358. The overall pattern of long and short sweeps was not formed. The current price is running in the large range of 3405-3340, and it is necessary to break through this range to confirm the direction.
Key range and break direction
Bull defense: 3340 is a short-term key support. If it stabilizes, it will maintain a volatile bias. If it breaks down, it may further test the previous low of 3280.
Short pressure: 3405 is a strong resistance above. After breaking through, it can be bullish to the 3430-3465 area.
Operation strategy: sell high and buy low within the range (short near 3405, long near 3340), and follow up after breaking.
Technical signal analysis
Daily level: The closing cross star on Friday stabilized the middle Bollinger track, but the early high and fall showed the divergence between long and short positions. It is necessary to observe today's closing pattern to confirm the strength and weakness.
4-hour level: The early high of 3396 is just suppressed by the upper Bollinger track, and the support below is 3350 (lower Bollinger track). It may maintain fluctuations in this range in the short term.
Short-term support: 3347 is an important intraday watershed between long and short positions. If it falls back and stabilizes, you can try long positions, with the target of 3375-3400; if it directly breaks through 3400, follow up with long positions.
Trading tips
The market at the beginning of the week is mainly volatile. It is recommended to operate in the short term and take profits in time.
Pay attention to the daily closing and the break of 3405/3340, and adjust the mid-line layout after the break.
The overall trend is still bullish at present, but we need to be alert to the risk of market changes caused by news.

XAU/USD Continues Its FallGold begins the week on a downward trend, trading below the key $3,400 mark per troy ounce. In the meantime, the precious metal has managed to limit its losses amid the stronger US Dollar (USD) and rising geopolitical tensions in the Middle East.

Let’s talk about gold’s movement
This week, the fundamentals are relatively relaxed. The two sides of the Middle East war continue to fight each other. The market is relatively tired, resulting in the relative weakness of gold, silver and oil. From the technical perspective, the gold price continues to fluctuate and fall. After falling to the bottom, it rebounds rapidly. The overall bulls are strong again. Let's briefly sort it out:
1: Fundamentals: Market aesthetic fatigue leads to continuous adjustment of gold, silver and oil;
2: Technical aspect, the fundamentals are relatively weak, resulting in the technical adjustment of "up and down puncture" to wash the plate!
To sum up: This week's trend is very difficult to operate; long, the fundamentals are weak; short, the overall risk aversion has not disappeared; therefore, there is a trend of constantly piercing the lows, and then constantly pulling up; the overall trend is a decline of three and a rise of two!
The current overall environment:
1: Fundamentals:
The first stage: The Middle East war is still going on, the two sides continue to fight each other, and their attitudes are strong; the opposing forces of the camps are obvious; the impact is far-reaching! The first stage is a continuous confrontation; risk aversion is born, assisting the strong rise of gold, silver and oil; we are still in the first stage!
The second stage: the opposing camp forces gradually exit; for example, the United States decides whether to exit within 2 weeks, which is actually waiting for the intensity of Iran and Israel's next move. The United States exits and the war expands; the United States and the West exit indirectly, and the Middle East war becomes protracted. Refer to the Russian-Ukrainian war. The United States and the West continue to wait and see, then the Middle East war will form a multi-to-one situation, which is relatively unlikely. Israel is a "nail household" placed in the Middle East by the United States and the West. The United States and the West will not sit idly by and watch Israel being completely defeated.
The third stage: the end of the war; this stage is far away; refer to the current Russian-Ukrainian war; once the war starts, it will not end easily, whether it is an agent, the forces behind the camp, or the forces of a third party, without the final benefits in hand , will not end the war, such as the chaebols that support it, the military and industrial enterprises that support it, the political ladder strategic goals that support it, etc.
To sum up: we are currently in the first stage of the war, and the subsequent second stage is the core stage of the market, so we have to be careful about risk aversion repeatedly, and be careful about risk aversion rekindling, so that the bulls can "stir up a thousand waves again, but at this stage, the market continues to pierce and wash the market, which makes us very uncomfortable! We can only choose to follow the trend, and then choose different support levels, and deal with it mainly in line with the trend
This week's trading ideas: First, they are all trend-following ideas, and second: they are all support points, but they are not very smooth, and the uninterrupted piercing, stopping the decline, and pulling sharply are all uncomfortable
Next week's market outlook:
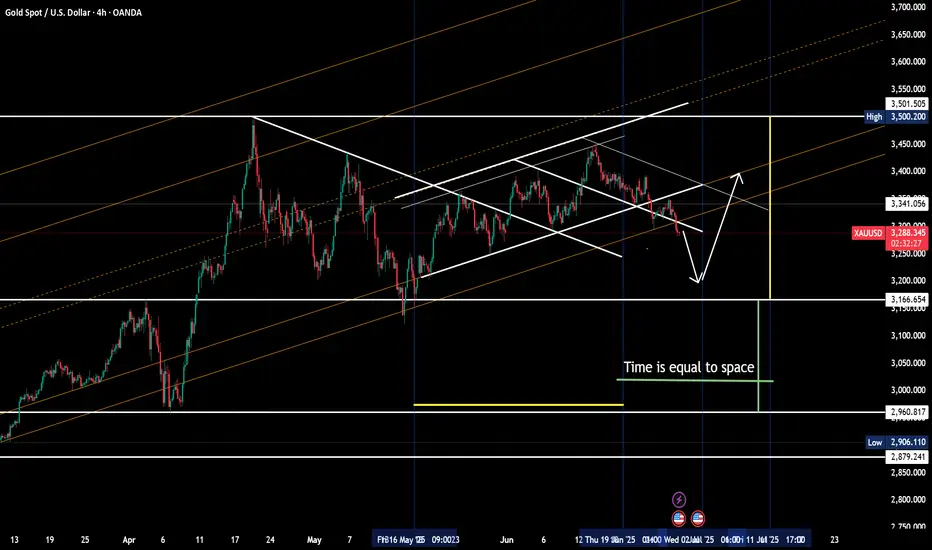
1. Weekly K, it is still a time-for-space mode, the price is resistant to falling, the indicator is corrected, here 3500 is definitely not a high point in the future; but it still takes time to promote the continuous upward attack of weekly K! Therefore, from a long-term perspective, I still suggest that gold is mainly bullish;
2. Daily K, the stochastic indicator continues to be near the central axis, forming a bottoming out and rebounding; the indicator is in a dead cross, the price is resistant to falling, and the market is washed here, washing "the sky is hanging and the earth is dizzy"; at the same time, in terms of form, it continues to fluctuate and rise. After multiple rises, the probability of subsequent breakouts is relatively high;
3. 4 hours, the stochastic indicator is golden cross, the form is bottoming out and rebounding, and it is also an uninterrupted decline and piercing, and then a sharp rise; the high-level one-word interval of 4 hours is integrated It is a relay sideways signal; the follow-up means the continuation of the trend;
To sum up: technically, the daily K-line is sideways and resistant to falling, and the weekly K-line is sideways and resistant to falling. The subsequent multiple upward tests on the technical side will gradually form a break; fundamentally, the subsequent second stage has not yet arrived completely, and the attitude of the United States in the next two weeks will also determine the direction of the second stage of the war
I suggest that the idea is to maintain the trend of low-multiple ideas. In terms of position, refer to the support and choose the uninterrupted layout of the support position; wash-out response: do a good job of risk control, wash-out is also helpless; short-term: try to avoid it as much as possible. Without a fundamental change, don't over-lay out short-term. Trend: combining fundamentals and technical aspects, the subsequent breakout of 3500 and the probability of setting a new high are relatively high

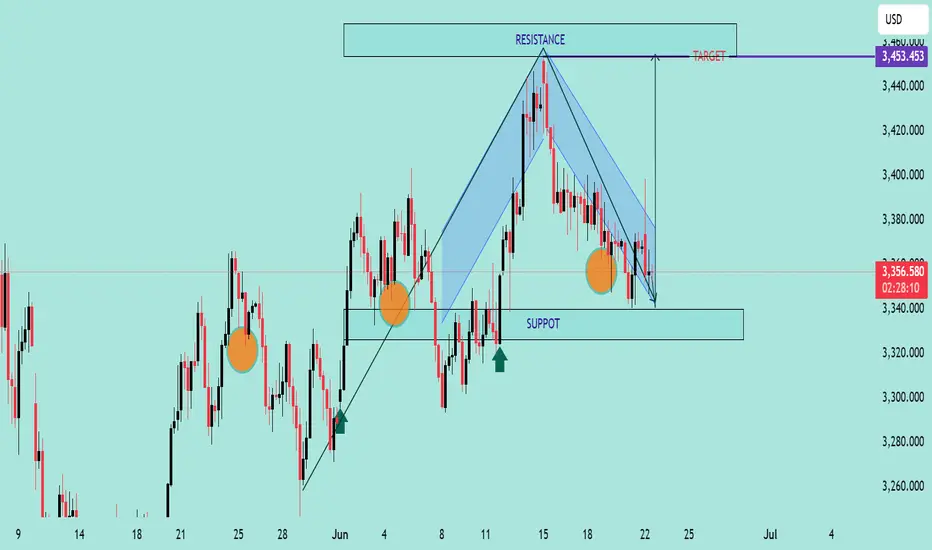
GOLD/USD Falling Wedge Breakout PotentialChart Analysis:
The chart illustrates a Falling Wedge Pattern, a bullish reversal setup typically signaling a breakout to the upside.
📌 Key Observations:
📉 Downward Channel: Price has been compressing within a falling wedge (highlighted in blue), indicating potential exhaustion of sellers.
💪 Support Zone: Strong support observed near the 3,340 level, with price rejecting this zone multiple times (highlighted with orange circles).
🔼 Bullish Signals: Price recently tested the lower wedge boundary and bounced, suggesting potential reversal.
🎯 Breakout Target: Projected target after breakout is around 3,453.453 USD, aligned with previous resistance zone.
🟢 Buy Pressure Arrows: Green arrows signal previous bullish reactions from similar demand zones.
📈 Conclusion:
If price breaks above the wedge’s upper boundary with volume confirmation, a bullish rally toward 3,453 is expected. Keep an eye on breakout retest for entry validation.
✅ Trading Plan Suggestion:
Entry: On breakout above wedge resistance
SL: Below recent swing low (~3,330)
TP: 3,453 zone 🎯
🔔 Note: Wait for a confirmed breakout before entering to avoid false signals.
Gold Slumps Sharply – Has the Rate-Cut Hope Faded?Gold prices are under intense selling pressure after the Bank of England, the Swiss National Bank, and the Federal Reserve all decided to keep interest rates elevated. This unified stance underscores persistent inflation concerns, driving up the opportunity cost of holding non-yielding assets like gold. As a result, investors rushed to take profits, sending XAUUSD down over 200 pips in just one session.
Adding fuel to the fire, the Fed’s latest monetary policy report to Congress warned that inflation could rise to 3% by year-end, higher than previous projections. Moreover, the Fed trimmed expectations for rate cuts in 2025 and beyond, signaling a longer road to policy easing.
🔎 What does this mean for gold's short-term outlook?
With high rates here to stay and the Fed's cautious stance, gold remains vulnerable to further downside in the near term. However, if upcoming U.S. economic data shows signs of significant weakness, gold may regain favor as a safe-haven asset.
At the time of writing, XAUUSD is trading around $3,347, a critical zone that may determine whether the current drop continues or finds a bottom.
Do you believe this dip will deepen—or is it a golden opportunity to buy the pullback? Share your thoughts below!
Gold longHigher time frame long.
I think gold is going toward 3400$ region.
Let us see how asian session reacts.
XAUUSD:Sharing of the Trading Strategy for Next WeekAll the trading signals this week have resulted in profits!!! Check it!!!👉👉👉
The Iran-Israel conflict continues to escalate, with Trump declaring that U.S. fighter jets struck three major Iranian nuclear facilities—Fordo, Natanz, and Isfahan. This development has ignited the Middle East "powder keg," providing additional fuel for gold's rally.
Key support lies at 3340–3345, while short-term resistance sits at 3385–3390. A breakthrough above resistance is imminent.
Gold is expected to extend its rebound trend at next week's opening.
Trading Strategy:
Continue to adopt a buy-on-pullback approach, leveraging dips as entry points.
buy@3345-3355
TP:3380-3390
Share accurate trading signals daily—transform your life starting now!
👇 👇 👇 Obtain signals👉👉👉

Geopolitics: Risk Premium Discount Under Five Aircraft Carriers'Geopolitics: Risk Premium Discount Under Five Aircraft Carriers' Pressure
When the U.S. Nimitz Carrier Strike Group arrived in the Arabian Sea as scheduled on June 22, forming a dual-carrier deployment with the Carl Vinson, London gold spot prices fell slightly by 0.04% to $3,367.09/oz—a phenomenon of "gold prices falling instead of rising under the shadow of war" that is rewriting the market's traditional response model to geopolitical conflicts. Israeli Prime Minister Benjamin Netanyahu has just announced that "military operation targets against Iran have been completed ahead of schedule," while the U.S. has released news of "deciding whether to join the war within the next 48 hours." Meanwhile, the UK's twin aircraft carrier battle groups have passed through the Suez Canal, with five aircraft carriers gathering in the Middle East—a military deployment comparable to the troop buildup before the 2003 Iraq War.
However, market calm stems from two contradictory signals: on one hand, news that Iraq's "Hizbullah Brigades" threatened to block the Strait of Hormuz (accounting for one-third of global oil tanker traffic) panicked energy markets; on the other hand, although Iran-Europe nuclear talks made no substantive breakthrough, they released a de-escalation signal of "negotiations upon Israel's ceasefire." This tug-of-war between "military escalation and diplomatic de-escalation" has led to a "partial realization" of gold's safe-haven demand—similar to knowing a storm is coming but unsure of the exact time, so you buy an umbrella but don't open it immediately.
Key data anchors: Israeli airstrikes have destroyed 40% of Iran's missile launchers, and Iran's retaliatory strike on Israel's "cyber capital" Beer Sheva on the 20th used 35% fewer missiles than last week. This "decrease in attack intensity" is interpreted by the market as an expectation of a "short-term war," causing gold ETF holdings to decline by 2.3% month-on-month.
Analysis of gold trend next week, hope it helps you
XAUUSD sell@3380~3390
SL:3410
TP:3370~3360


Analysis of gold trend next week, hope it helps you I. Next Week's Trend Analysis
Geopolitics: Middle East Tensions Like an Unattended Gas Stove
The ongoing conflict between Israel and Iran is akin to a gas stove left burning in a kitchen, poised to explode at any moment. Last week, Israel launched airstrikes on Tehran and reportedly killed an Iranian nuclear scientist, prompting Iran to retaliate against Beer Sheva, known as Israel's "cyber capital." More worryingly, Iraqi armed groups have threatened to block the Strait of Hormuz if the U.S. intervenes—a channel through which one-third of global seaborne crude oil passes, essentially gripping the world's energy tap. Russia has also warned of a "highly negative" response if Iran's supreme leader is harmed, further escalating tensions.
In this context, gold serves as a "safe haven" for risk aversion. However, the market remains torn: on one hand, fears of conflict escalation drive funds into gold; on the other, hopes that Iran-Europe talks will ease tensions may prompt some capital to withdraw for wait-and-see. This contradiction was evident last week when gold prices surged to $3,450 before dropping to $3,367. Next week, close attention should be paid to whether the U.S. takes military action against Iran within two weeks and whether actual blockades of the Strait of Hormuz occur—such news will trigger sharp fluctuations in gold prices.
Analysis of gold trend next week, hope it helps you
XAUUSD sell@3380~3390
SL:3410
TP:3370~3360

XAUUSD Market Roadmap (June 30 – July 4, 2025)XAUUSD Market Roadmap (June 30 – July 4, 2025)
Currently, XAUUSD is showing a rejection at the 3261 demand zone, signaling a potential short-term pullback. As long as the price remains above the 3241 demand level, there is a possibility of testing the 3289 supply zone. However, if sellers re-enter from that area, the market may resume its decline toward the next demand target at 3225.
Key Levels:
Demand (current rejection zone): 3261
Demand (critical support): 3241
Supply (resistance target): 3289
Next downside target: 3225
Disclaimer:
This analysis is for informational purposes only and does not constitute financial advice or a recommendation to buy or sell any financial instrument. Always conduct your own analysis and apply proper risk management before making any trading decisions.

XAUUSD BUY OPPORTUNITY!!Price just formed a reversal Candlestick in H1 after making a new low recently.
From the technical standpoint, i anticipate price to retrace back to the pullback resistance of 3336.41 from the current market price.

Is gold in an ascending triangle, or in a wider range?A quick technical piece on TVC:GOLD . What are your thoughts?
MARKETSCOM:GOLD
Let us know what you think in the comments below.
Thank you.
77.3% of retail investor accounts lose money when trading CFDs with this provider. You should consider whether you understand how CFDs work and whether you can afford to take the high risk of losing your money. Past performance is not necessarily indicative of future results. The value of investments may fall as well as rise and the investor may not get back the amount initially invested. This content is not intended for nor applicable to residents of the UK. Cryptocurrency CFDs and spread bets are restricted in the UK for all retail clients.

Gold bulls pay attention to risk aversionGold bulls pay attention to risk aversion
Today, the price of gold still has a large room for decline, and bulls need to pay attention to risk aversion.
When the price of gold hovered around $3,330, bulls began to rise collectively, as if the Federal Reserve was going to cut interest rates tomorrow and a world war was about to break out in the Middle East.
Wake up! Is this kind of fluctuation worthy of being called a market?
1. The "risk aversion sentiment" that bulls hyped up to the sky has long cooled down
Israel and Iran are no longer able to fight again, and Trump also said that both sides are "exhausted", but gold is still pretending to be "risk aversion"?
I laughed to death, do you really think the market is stupid?
Red Sea shipping friction? This matter has been hyped for half a year, should gold rise? No! This shows that the market does not buy it at all.
2. Expectations of a rate cut by the Federal Reserve? Don't dream!
If the PCE data tonight is higher than expected, the price of gold will dive directly.
Now the hawkish voices within the Federal Reserve are getting stronger and stronger. Powell said that "interest rate cuts may be possible", but what is the actual situation? Inflation data rebounded slightly, and gold prices suffered a heavy blow.
3. Technical aspects?
This is just the last fig leaf for the bulls. 3300 support? Any negative data will destroy it.
Gold is now in a volatile market, with both ups and downs, and it is completely dependent on news support.
If the PCE data is negative tonight, 3250 points will definitely be broken.
At that time, the bulls will find an excuse to say "the adjustment is temporary."
Wake up and avoid risks quickly.
Suggestions:
The 3300 support level of gold price becomes a pressure level
If it falls below $3,300, try to short gold at a high level. The stop loss is set in the 3300-3310 range
The support level below the gold price: 3250-3200-3165
Gold breaks down. It may reach a low point.From the current market daily chart
The absolute support of gold is around 3280. Gold is basically in the process of maintaining this daily trend support line. Therefore, I personally think that around 3280 is a long-short dividing line for gold. If gold falls below 3280 on the daily line, it is very likely that the decline will just begin. On the contrary, be careful. If 3280 does not fall below, there is still a possibility of rebounding.
In the 4-hour chart, from the high point of 3450 to now, the 0.382 position is just around yesterday's high point of 3350. The 0.618 position is at 3325, and the final 100% position is around 3280. 3280 also coincides with the daily chart.
Therefore, gold must at least test around 3280 today, and it is not ruled out that there will be lower positions.

XAUUSD: Bearish Trend, Key Support at $3,295Market Overview
In today’s trading session (26/06/2025), XAUUSD shows continued downward momentum. Gold prices are currently hovering around $3,302.05, with a slight drop of 0.01%. The intraday price range has been tight, between $3,330.00 and $3,350.00, indicating a battle between the buyers and sellers around the short-term equilibrium zone.
Recent price action suggests that after a brief recovery, gold is once again encountering resistance at the $3,350.00 level. In the coming hours, a decisive breakout either above this resistance or below current support will dictate the market’s next move.
Key Technical Levels to Watch:
Support Levels: The first significant support is at the $3,295.37 level (50% Fibonacci retracement), with the next support at $3,296.60 (61.8% Fibonacci retracement), followed by a crucial level at $3,300.56.
Resistance Levels: The primary resistance area lies around $3,350.00, with the second resistance at $3,327.72, which coincides with the 3.618 extension of the previous price swing.
Price Action Analysis
As seen in the chart, XAUUSD is currently trading below both the 50-period (blue) and 200-period (yellow) moving averages, indicating a strong bearish trend. The price action is forming a series of lower lows and lower highs, reinforcing the downtrend.
Bearish Trend Continuation: A break below the support at $3,295.37 could signal further downside towards $3,290.00 or even $3,275.00. The yellow trendline indicates the overall bearish direction, and any failure to hold above $3,300.00 could trigger additional selling pressure.
Fibonacci Retracement Levels: Price is testing the 50% and 61.8% Fibonacci levels. A rejection at these levels could cause a pullback towards lower support zones, confirming the bearish outlook for the short term.
Volume Analysis
The volume chart shows relatively low volatility, with decreasing volume during the price pullbacks. This suggests that there is not enough buying interest to push the price higher, and the market may be more inclined towards bearish continuation in the near term.
Market Sentiment
Currently, the market is undecided. The recent price action suggests that traders are waiting for a confirmation of direction. The next few hours are critical in determining if the downtrend will continue or if we will see a short-term bounce at one of the key support levels.
Trading Strategy
Short Position: A break below $3,295.37 would be an excellent opportunity to short XAUUSD with a target at $3,290.00, and further down to $3,275.00.
Long Position: Only consider long positions if XAUUSD manages to break above $3,350.00 decisively, with the next target near $3,375.00.
Conclusion
XAUUSD remains under pressure, and unless there’s a strong reversal at support levels, the bearish momentum could continue in the short term. Traders should monitor the key levels mentioned above closely to adjust positions accordingly.


Still bearish!If the short-term bull lifeline 3330 is lost, the trend will be bearish again. The first pressure point above is 3350-the secondary top 3345, and then the 3332-35 area. If the price bulls regain 3335 again, then the operation should be carried out in the range of 3350-3310. It is not recommended to enter the market at the halfway point because it is easy to be washed out. If the daily K line closes below 3340, then 3332-35 is the best position at present. At present, the price is bearish below 40, and it can rely on 3332-31 to continue to be bearish. The target is 3310 and 3924.

XAUUSD Seems Going UpGold price trades with a mild positive for the second straight day on Thursday, though it lacks follow-through and remains below the $3,350 level through the early European session. Reports that US President Donald Trump was considering replacing Federal Reserve Chair Jerome Powell raised concerns over the future independence of the US central bank.
