Could we be entering another phase of gold consolidation?Gold's impressive rally from 2023 to 2025 completed the two-fold formation of the cup-and-handle pattern.
Notably, while gold would typically rally in response to heightened geopolitical tensions—such as the Israel-Iran conflict and the B2 bombing of nuclear power plants—it has instead shown resilience by retreating and displaying minimal sensitivity to these events. This unexpected behavior suggests that gold may be entering a consolidation phase despite the prevailing uncertainties.
As a Tier I asset under Basel III regulations, gold remains a fundamentally strong investment and is expected to resume its upward trajectory, reaching new all-time highs post-consolidation. The $2,800–$3,050 range presents a favorable entry point for market participants.
GOLDMINICFD trade ideas

Report - June 26, 20251. Ceasefire, Oil, and Market Sentiment:
Markets are stabilizing after a volatile stretch driven by geopolitical tensions between Israel and Iran. A ceasefire, brokered by President Trump, appears to be holding, encouraging risk-on sentiment across global asset classes. Brent crude has fallen back to $68.17 per barrel, erasing earlier war-driven spikes. Traders swiftly sold oil after Iran's symbolic missile attack on a US base in Qatar, interpreting it as a move to de-escalate rather than escalate. This rapid reaction, fueled by open-source intelligence and satellite imagery showing the base was empty, helped unwind the geopolitical premium in crude.
Energy consultancy Rystad noted Iran even increased crude exports amid the conflict due to lack of refining capacity. With OPEC+ boosting supply and US shale output high, the market anticipates an oversupplied scenario by year-end. Strategists like Amrita Sen (Energy Aspects) expect crude to test $50–60, while RBC’s Helima Croft said the White House is unlikely to tap the Strategic Petroleum Reserve, given sufficient alternative supply buffers.
2. Equities and Sector Rotation:
US equity indices were mixed: the Nasdaq 100 gained 0.2% to 22,237.74, while the S&P 500 and Dow Jones dipped slightly. The CBOE Volatility Index (VIX) dropped 1.1% to 16.77, signaling easing investor fear. Year-to-date, tech leads with XLK up 31.95%, followed by communications (XLC +23.46%) and discretionary (XLY +18.69%). Defensive sectors lagged: utilities (XLU +19.13%), consumer staples (XLP +9.15%), and real estate (XLRE -1.27%).
Recent sector performance reflects a recalibration away from energy and interest-rate sensitive names. XLE has tumbled 4.65% over the past five days, mirroring declining oil, while XLRE’s underperformance worsened, highlighting investor caution in yield-sensitive areas. The growth/value debate continues: large-cap growth (IWF) was the only factor posting a gain (+0.29%), while small-cap growth (IJT) fell 1.2%, underscoring preference for quality and scale.
3. Fixed Income and Sovereign Yields:
Rates edged higher. The US 10Y Treasury yield rose 2 bps to 4.32%. Germany’s 10Y bund climbed 3 bps to 2.57%, and UK gilts ticked up 1 bp to 4.46%, driven by expectations of higher issuance to fund increased NATO defense spending.
US Treasuries across the curve remain elevated: 1Y at 3.99%, 2Y at 3.77%, and 30Y at 4.81%. Despite global easing signals, sovereign borrowing costs stay elevated, reflecting inflation stickiness and geopolitical risk premia. TIPs and agency MBS have outperformed on a 1Y basis, with TIP +4.7% and GNMA +5.76%.
4. NATO Commitment and Fiscal Risk:
At The Hague summit, NATO allies pledged to meet Trump's demand for 5% of GDP in defense spending by 2035, a seismic shift from the previous 2% benchmark. While reaffirming Article 5 commitments, Trump emphasized US support hinges on European “burden sharing,” pressuring Spain for opting out. The summit declaration promises annual roadmaps and a 2029 review—coinciding with Trump’s potential exit from office.
Germany’s Chancellor Merz called the commitment a moment of “putting our money where our mouth is,” but bond markets reacted with concern. The FTSE 100 slid 0.5%, and the DAX fell 0.6%, reflecting fiscal anxieties tied to expanded military budgets.
5. Policy Front – Trump’s Tax Push & Debt Outlook:
The White House claims its proposed tax bill will lower debt via growth and tariff revenue. CEA estimates show debt-to-GDP dropping to 94% by 2034 with $8.5–11.2 trillion in deficit reduction. Yet the CBO projects the bill would add $2.4 trillion to deficits—and $2.8 trillion when factoring in higher rates.
Trump’s pressure campaign on Senate Republicans includes urging round-the-clock negotiations. However, concerns linger among fiscal hawks like Sen. Ron Johnson, who warned of “an acute debt crisis.”
6. Credit Markets and Insurance Breakdown Risk:
Credit spreads are holding stable, but US liability insurance is flashing red. Marsh data shows US casualty insurance rates have risen for 23 straight quarters. Executives at Everest and Aspen warn of a “breakdown” in coverage availability due to runaway litigation costs and “forever chemicals” claims. Everest’s reserves for US casualty risks now top $1.7 billion.
Insurers are lobbying for tort reform, and rate hikes of 20–25% in excess liability are becoming the norm. This insurance squeeze poses a serious inflationary threat to businesses, especially in logistics, construction, and hospitality.
7. Trade Disruption – FedEx Feels the Pinch:
FedEx shares dropped nearly 6% after warning of sharp deterioration in China–US freight, driven by the end of the “de minimis” $800 tariff exemption used by platforms like Temu and Shein. This lane, their most profitable intercontinental route, now faces structural weakness. While Q4 net income rose 13% to $1.65B, guidance for EPS of $3.40–4.00 (below expectations) reflects uncertainty ahead.
8. M&A Spotlight – Brighthouse Bidding Heats Up:
TPG and Aquarian Holdings are the final bidders for Brighthouse Financial, a $3.5B life insurer. Despite interest from Apollo, Carlyle, and Blackstone, many walked due to legacy annuity liabilities and high capital charges. The strategic appeal remains strong: control over policyholder premiums enhances credit origination capabilities for private capital platforms. An exclusive negotiation could emerge in the coming week.
9. Political Heat – Warren Targets Private Equity:
Senator Elizabeth Warren is probing PE firms (Apollo, KKR, Blackstone, Bain, Thoma Bravo) for lobbying efforts related to the “carried interest” loophole and private credit tax breaks embedded in Trump’s tax bill. The senator demands disclosures by July 2, while Trump pushes for bill signing by July 4.
The American Investment Council responded that raising taxes on private capital would “kill jobs” and hurt innovation. The legislation, approved narrowly in the House, slashes taxes and expands debt—a key flashpoint heading into summer recess.
10. Currency, Commodities, and Global Trends:
Brent crude trades at $67.95 and WTI at $65.18. Gold holds at $3,335, up 45% YTD, though recent profit-taking has slowed its rally. Silver (+26.2% YTD) and copper (+12.5%) also reflect bullish industrial demand.
In FX, GBP/USD is up 0.3% to 1.3705; EUR/USD is at 1.1681 (+0.02%). USD/JPY slid to 144.57 (-0.66%). On a 1Y basis, GBP and EUR are both up over 8%, while the yen is down nearly 10.5%, continuing its depreciation due to BOJ’s dovish stance.
---
Equities:
Current Positioning: Equities are delicately balanced. The S&P 500 is up +3.6% YTD, Nasdaq +3.4%, but Dow only +1.0%, reflecting the rotation into growth, defensives, and high-cap tech. However, small caps are under heavy pressure (IJR/SPY -1.05% daily, down YTD), and value is again underperforming.
Tactical Implications:
Overweight: Large-Cap Growth (e.g., XLK, IWF) – Mega-cap tech remains the secular winner (+31.95% YTD in XLK). Given moderating rates and weak cyclicals, expect further leadership unless yields spike.
Underweight: Small-Caps (IWM), Real Estate (XLRE), and Energy (XLE) – These are vulnerable to tightening credit, low breadth, and oil retracements. XLRE is -1.27% YTD and XLE dropped -4.65% in the past week alone.
Neutral: Financials (XLF) – The sector is at a crossroads. While yields support net interest margins, the liability insurance shock and credit pricing discipline weigh on capital-intensive names.
Actionable View: Stay concentrated in quality tech and cash-flow-rich defensives. Consider rotating out of overextended discretionary and look for short-term mean reversion trades in oversold industrials only on technicals.
Fixed Income:
Market: The UST 10Y yield is at 4.32%, up 2bps on the day. Notably, the 2Y/10Y curve is flattening again (+55bps spread), but with upward pressure on the long end driven by fiscal overhang (NATO rearmament, tax cuts).
Strategic View:
Short Duration Preferred – Laddered Treasuries and 1–3Y paper outperforming (e.g., SHY +0.65% YTD). Long duration remains risky despite falling inflation, given massive expected issuance.
TIPS as Inflation Hedge – TIPs up +4.7% YTD continue to provide inflation-linked protection. Elevated defense and healthcare spending bolster this theme.
Credit Call: High-Grade Corporate (LQD) – Valuation remains stretched, but spread stability gives buffer. Prefer LQD over HYG or CWB, where spreads are at risk due to funding costs and insurance withdrawal risk.
Action: Maintain a core laddered Treasury base, with modest high-grade credit. Fade the long end on rallies; use TLT as a tactical short if 10Y breaches 4.4–4.5%.
Commodities:
Key Developments:
Brent crude fell sharply (-6.1%) post-ceasefire, now at $67.95. Markets no longer price geopolitical premium.
Iran’s production rising, US SPR untapped, and China’s buying shifting.
Gold stabilizing at $3,335 after peaking on war fears; silver remains stronger at $36.34 (+26.2% YTD).
Outlook:
Oil: Short-Term Bearish to Neutral – Expect continued selling on rallies unless supply chain disruptions emerge. Range: $62–70/bbl.
Gold: Wait for Re-Entry – Momentum slowing but structural inflation hedging still intact. Look for re-entry near $3,200. Position cautiously if dollar strengthens.
Ags: Avoid – Corn and wheat continue to slide. Corn -7.5% MTD and -10.3% 3M; soybeans -11.7% YTD. No catalysts to reverse.
Action: Tactical shorts in oil remain viable unless Iran–Strait of Hormuz risk flares again. Hedge tail risks with gold but reduce exposure if USD rallies.
Currencies:
DXY weakening slowly, but USD/JPY still at 144.5 (-9.42% 1Y), EUR/USD firm at 1.1681.
Sterling outperforming: GBP/USD +8.2% 1Y.
Implications:
Short USD/JPY Holds – BOJ still dovish, yen oversold, risk-on flows support reversal. High conviction macro long on JPY.
Watch GBP/USD – Strong rally, nearing overbought territory. Use strength to rotate to EUR if ECB surprises.
EMFX Mixed – Avoid high beta EM (ZAR, TRY) due to USD and rates. Selective value in BRL, INR if USD pulls back further.
Action: Maintain partial USD hedge via EUR and JPY. EMFX traders should stay risk-off short term; low carry + volatile backdrop makes it unattractive.
Credit & Insurance Markets:
Everest ($1.7bn reserves) and Aspen warning of “coverage breakdown” in US casualty insurance. Litigation exposure (PFAS, data privacy, social cases) is a systemic risk.
FedEx’s collapse in China–US freight (-6% equity) is a red flag on consumption + supply chain health.
Expect more insurers to restrict exposure to high-litigation US states or raise rates >25%.
Positioning:
Be cautious on mid-cap financials, reinsurers, and commercial real estate debt with liability linkage.
Corporate credit: Avoid HY and convertibles. LQD remains the safe zone.

June 26, 2025 - XAUUSD GOLD Analysis and Potential OpportunitySummary:
The situation is getting interesting — Trump is reportedly considering naming Powell’s successor early, which is providing support for gold.
For now, the plan is to buy on dips to support. However, if Trump changes course again, we must stay flexible and respond to any reversals with clear plans.
🔍 Key Levels to Watch:
• 3370 – Resistance
• 3364 – Resistance
• 3350 – Midpoint / Bull-Bear Line
• 3340 – Key Resistance
• 3329 – Support
• 3312 – Intraday Key Support
• 3300 – Psychological Support
• 3295 – Support
• 3285 – Support
📉 Intraday Strategy:
• SELL if price breaks below 3325 → watch 3321, then 3312, 3305, 3300
• BUY if price holds above 3335 → target 3340, then 3345, 3350, 3358
👉 If you want to know how I time entries and set stop-losses, hit the like button so I know there's interest — I may publish a detailed post by the weekend if support continues!
Disclaimer: This is my personal opinion, not financial advice. Trade with caution and always manage your risk.

Bearish direction remains unchanged, wait patiently
Since the sharp drop in gold last Monday (June 16), except for the correction of closing the cross positive line last Tuesday, the daily level has closed five consecutive negative lines since last Wednesday until now, fully demonstrating the weak characteristics of gold prices in recent trading.
From the technical indicators, the 5-day moving average and the 10-day moving average have formed a dead cross, which is an important signal of the weakening of the short-term market trend. The current gold price continues to run below these two moving averages, further verifying the current market situation where the shorts dominate. There is still no big fluctuation in the intraday, short positions are patiently waiting, and the operation still maintains our target of 3310-3305 unchanged.

Eyes on Powell testimony H4 Timeframe Analysis
Gold is currently holding the falling wedge pattern on H1 & H4 now market is range of 3290-3335 structural support.
What's possible scanarios we have?
As we have seen market rejected multiple times today at 3335 and still on downside.
if H4 remains belo6 3330-3335 then keep your eyes at 3305 then 3290 milestone.
On the otherhand if The H4 candle closes above 3335 buyying will be rapture and market will tap the Volume Gap at 3365 then 3380.
Additional TIP:
Above 3335 keep buy
Below 3325 keep sell
#XAUUSD

Gold potential short term bullishness Gold prices have found some relief and are experiencing a minor recovery amidst the mixed market sentiment driven by ongoing Middle East tensions, Trump's call for rate cuts, and Fed Chair Powell's hawkish tone. This has led to an interesting market reaction. We might see short-term growth in gold prices after a retest of the liquidity zone below $3,320.

XAUUSD (LONG)
Price always reacts to the 50SMA on Daily,this it what it has done now as held as support.
Weekly Support Pivot Level(Pivots strategy used) Reached as confirmation for a Buy.

Gold Spot Price Analysis (4-Hour Chart4-hour candlestick chart for the Gold Spot price in U.S. Dollars (XAU/USD) from June 22 to July 9. The chart shows a downward trend with recent prices around $3,299.48, representing a 2.07% decrease. Technical indicators and annotations suggest potential support and resistance levels, with a highlighted area indicating a possible trading range. The data is sourced from OANDA.

Extra infoGeopolitical Gold Risk: EU Alarmed Over U.S. Custodianship
Rising geopolitical volatility and former President Trump’s escalating rhetoric against the U.S. Federal Reserve have sparked renewed European concerns over national gold reserves stored in the U.S., especially in Germany and Italy. Both nations hold the second and third-largest gold reserves globally (3,352 and 2,452 tonnes respectively), with a significant portion—over $245 billion in total—custodied at the New York Fed.
Lawmakers and public advocacy groups across the political spectrum in both countries are urging repatriation of gold to domestic vaults, citing Trump’s erratic policy stances and potential interference with central bank independence. The Bundesbank continues to defend New York's strategic value, while Italy remains silent. A growing number of central banks globally are reportedly shifting or planning to shift gold home as a precautionary move.
Japan’s Political Shifts: LDP Faces Voter Blowback Over Inflation
Japan’s ruling Liberal Democratic Party (LDP) suffered a historic electoral defeat in Tokyo’s local assembly elections, signaling growing voter discontent over surging food prices and stagnant wages. The LDP lost 8 of its 30 seats, surrendering its top position to Governor Yuriko Koike’s regional party, Tomin First.
With upper house elections on July 20, this loss raises risks of further political fragmentation. The populist right-wing Sanseito party gained seats for the first time, showcasing a shift toward fringe movements. PM Ishiba’s government also faces diplomatic and economic pressure as Trump threatens tariffs on Japanese imports. Tokyo’s results act as a warning sign that inflation and trade anxieties are materially influencing voter behavior.
U.S.-Korea Defence Diplomacy: Rolls-Royce Eyes GE Replacement
As South Korea reassesses its KF-21 fighter jet engine partner, UK officials are lobbying aggressively for Rolls-Royce to replace GE Aerospace, citing U.S. export restrictions that limit Seoul’s ability to sell jets internationally. The KF-21’s export prospects to Indonesia and the UAE are reportedly at risk due to American national security clauses.
Rolls-Royce proposes a joint development model to de-risk the engine program. However, entrenched U.S.–Korea defense ties, including Hanwha’s integration with U.S. military platforms, complicate this pivot. The U.K. seeks not only defense industrial collaboration but strategic geopolitical alignment with Seoul as a hedge against U.S. protectionism.
Energy Sector on Edge: Majors Withdraw Staff Amid Escalation Risks
European energy giants BP, TotalEnergies, and Eni have begun evacuating foreign staff from Iraqi fields, citing risk of Iranian retaliation after U.S. strikes on Tehran’s nuclear facilities. Operations remain intact, but local authorities confirm precautionary withdrawals, with Total reportedly pulling 60% of its expats.
Rumaila, Zubair, and southern Iraqi fields are proximate to Iranian territory and vulnerable to missile or proxy militia attacks. Analysts caution that Iran could exploit asymmetric tactics via regional militias, threatening key infrastructure without directly engaging U.S. forces. Shell, also present via Basra Gas, declined comment. The withdrawal underscores the fragile security balance as military posturing continues to escalate.
Oil Markets Volatile: Trump Demands Surge in U.S. Production
Following Brent crude’s spike to $81.40 and a subsequent intraday fall to $76.90, President Trump urged the Department of Energy to “DRILL, BABY, DRILL!!!” to stabilize prices. His public messaging emphasizes a fear that elevated oil costs play into enemy strategies, pressuring energy firms and OPEC+ to expand output.
So far, Middle East supply has not been disrupted, and no damage to the Strait of Hormuz—which handles 21 million barrels/day—has been recorded. However, analysts from S&P, SEB, and RBC warn of continued upside risk if Iran or its proxies target tankers, refineries, or pipelines. Several tankers have already changed course or anchored to avoid chokepoints, signaling preemptive market caution.
Financial Markets and Central Bank Tensions
Trump’s repeated interventions into Fed policy, combined with tariff-driven inflation concerns, have created a highly politicized environment for monetary policy. He has publicly demanded immediate rate cuts to 1–2%, pressuring Powell amid signs of internal division among Fed governors.
With inflation nearing the Fed's 2% target but geopolitical risks rising, Powell must testify to Congress this week and defend the institution's independence. A shift in Fed leadership post-2026 under a Trump administration may fundamentally reshape U.S. monetary credibility if dovish, politically loyal appointees take over.
European Fixed Income Competition: Vanguard Cuts Fees
As competition heats up in Europe’s bond ETF market, Vanguard has slashed fees on 7 of its 15 European fixed income ETFs. The changes reduce average expense ratios to 0.11%, part of a broader push to gain share from leaders like BlackRock and State Street.
This move aligns with Vanguard’s U.S. fee overhaul earlier this year, aimed at democratizing access to fixed income. European investors increasingly demand lower-cost bond solutions as the bond market now exceeds equities in size, yet remains more opaque and less efficient. The fee cut should help catalyze inflows from cost-sensit

Analysis of the latest gold trend on June 24:
I. Macro-driven analysis
1️⃣ Geopolitical conflict escalates, risk aversion rises
On June 23, local time, Iran launched the twentieth round of large-scale missile and drone attacks on Israel, using the "Khyber" long-range missile to strike targets in Israel for the first time. At the same time, US submarines launched 30 "Tomahawk" cruise missiles and 12 MOP bunker-buster bombs at nuclear facilities in Iran, directly escalating the military conflict.
Iran claimed that it had released a large number of drones and warned that Israel's air defense system was close to saturation, causing the Middle East war to quickly enter a high-risk stage. The market's risk aversion sentiment has risen sharply, and gold has jumped higher during the day, continuing a wide range of fluctuations.
2️⃣ Trump's remarks disturbed market sentiment
Last Friday, Trump's statement that "the third aircraft carrier has been deployed in the Middle East" was confirmed by many parties to be exaggerated. In fact, it was only a conventional troop mobilization arrangement, which temporarily weakened the market's expectations for further escalation of the geopolitical situation, resulting in a retreat of gold's safe-haven buying in the late trading and suppressed gains.
However, with the fact of the conflict last weekend, risk aversion quickly returned, and gold formed a "high opening gap" pattern in early trading on Monday, and its risk aversion attribute was strengthened again.
3️⃣ The game between major powers intensified and medium- and long-term risks increased
The US strikes on Iran's nuclear facilities are aimed at curbing its nuclear capabilities. Iran's possible retaliatory countermeasures (such as blocking the Strait of Hormuz and expanding proxy conflicts) may trigger a global energy supply chain crisis. At the same time, Russia's provision of air defense support and the appearance of Chinese reconnaissance ships in the Persian Gulf have made the geopolitical situation more complicated, providing solid support for the medium- and long-term trend of gold.
2. Technical analysis of gold
🔍 Intraday market review and trend structure
Affected by risk aversion, gold continued to open high and go low on Monday this week, which was highly similar to the trend of last Monday. The highest intraday reached around 3398, and then adjusted.
The upward surge in the early Asian session just tested the previous trend line pressure level, and the overall structure still tended to rebound weakly. Intraday operations should maintain the idea of "mainly shorting at highs".
⏱ Analysis of key technical structures
4-hour chart: The moving average system has not turned significantly, indicating that the short-term rise of gold lacks sustainability, and the risk aversion has driven the rise and then retreated quickly;
1-hour chart: After the short-term downward trend was broken, gold once rose to around 3398. The current key support level is at 3340. If it continues to break down, it will test the 3320 first-line support;
Structural form: The hourly chart forms a preliminary prototype of a "double bottom". If 3340 is not broken, a second rebound may be launched, but the upward space is still limited by the strong resistance in the 3395-3405 area.
3. Trading strategy:
🎯 Sell at high rebound and short 3390-3405. If the strong pressure level is not broken, short short. Exit after breaking 3410. Target 3366-3355
🔄 Long with light position in callback 3350-3340. Short-term long test after stabilization. Stop loss after breaking 3335. Focus on 3380-3390 in rebound
🚫 Avoid chasing up —— The current volatile market is not suitable for chasing up —— ——
📌 Operation tips:
The current volatility of gold is dominated by geopolitical risk news, which is prone to rapid rise and fall. Pay attention to controlling positions and stop loss discipline;
Pay attention to the trend of the US dollar index, the linkage of crude oil prices, and the synchronous performance of market risk aversion indexes (such as VIX) during the trading session;
If the price breaks through 3405 and stabilizes, it is necessary to adjust the thinking and follow the trend.

Trade Idea: XAUUSD Short (SELL LIMIT) 1. Trend Alignment: H1 shows a clear down-trend — lower highs at 3446 → 3397 → 3347. SMAs on H1/M15 have turned down.
2. High-Probability Pullback: Price has broken the 3340 support twice and pulled back. Resistance here is offering a tight stop and plenty of room to TP.
3. Structural SL: Stop sits just above the prior swing high (~3350–3352)
Entry
Sell Limit @ 3340.37
Prior day low (now resistance) on H1 & M15
Stop Loss
3352.00
Just above the swing high around 3350–3351
Take Profit
3293.07
Invalidation
15 min candle close < 3310
Time Expiry
8:30 AM PST
Cancel if not triggered by then
FUSIONMARKETS:XAUUSD

Gold continues to decline, can it still change the trend?Information summary:
Will the Fed cut interest rates in July? The latest statements of Fed officials have released a heavy signal. Fed Governor Michelle Bowman said that as long as inflationary pressures remain moderate, she will support a rate cut at the next policy meeting in July. At the same time, Trump has continued to put pressure on the Fed.
Next, investors need to pay attention to the testimony of Fed Chairman Powell on the semi-annual monetary policy report to the House Financial Services Committee today.
Market analysis:
Gold fell sharply today, directly breaking the key support level of 3350. From a 4-hour perspective, the MA moving average shows a short trend arrangement, and the MA5\10 moving average crosses the MA20/30 long-term moving average downward, which indicates that the short force is dominant. In addition, the RSI indicator also fell rapidly and entered the oversold area, but this may also suggest that prices have a rebound trend in the short term.
I think the current market price decline trend is more obvious, unless there is significant positive data, the gold price may continue to decline.

Gold intraday Short opportunityGold is currently moving with steady bearish momentum to the downside. at the opening of the week we saw downside momentum which is supported by price trading below the 50 SMA and trading with bearish momentum on the RSI below 45.
Potential retracement towards the $3344 price levels before continuation to the downside support at $3300. Looking to capitalize on this short opportunity for the day before price reacts to the major support at $330

Weakness continues, continue to short the bear market📰 Impact of news:
1. Pay attention to Powell's speech in New York
2. Pay attention to geopolitical influence
📈 Market analysis:
Gold opened lower and showed a weak situation. The 1H moving average was arranged downward. In the short term, bears still occupied the main trend. From the 4-hour analysis of gold, the bulls still had repeated resistance before breaking down. Once it breaks down, the market will go further bearish. Pay attention to 3330 below. 3400 is still the key above in the short term. Only by breaking through the bulls can the rebound continue. In terms of operation, high-altitude and low-long are temporarily maintained. Pay attention to the short-term resistance of 3355-3365 above, and the support of 3340-3330 below. Pay attention to the breakthrough! Pay attention to Powell's speech in the New York session.
🏅 Trading strategies:
SELL 3370-3365-3355
TP 3340-3330
BUY 3340-3335-3320
TP 3345-3355-3365
If you agree with this view, or have a better idea, please leave a message in the comment area. I look forward to hearing different voices.
TVC:GOLD FXOPEN:XAUUSD FOREXCOM:XAUUSD FX:XAUUSD OANDA:XAUUSD

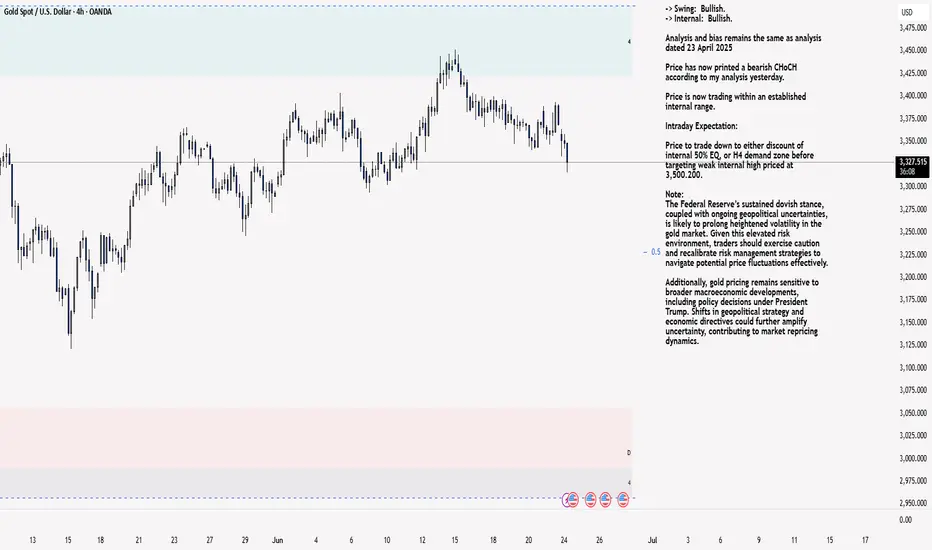
XAU/USD 24 June 2025 Intraday AnalysisH4 Analysis:
-> Swing: Bullish.
-> Internal: Bullish.
Analysis and bias remains the same as analysis dated 23 April 2025
Price has now printed a bearish CHoCH according to my analysis yesterday.
Price is now trading within an established internal range.
Intraday Expectation:
Price to trade down to either discount of internal 50% EQ, or H4 demand zone before targeting weak internal high priced at 3,500.200.
Note:
The Federal Reserve’s sustained dovish stance, coupled with ongoing geopolitical uncertainties, is likely to prolong heightened volatility in the gold market. Given this elevated risk environment, traders should exercise caution and recalibrate risk management strategies to navigate potential price fluctuations effectively.
Additionally, gold pricing remains sensitive to broader macroeconomic developments, including policy decisions under President Trump. Shifts in geopolitical strategy and economic directives could further amplify uncertainty, contributing to market repricing dynamics.
H4 Chart:
M15 Analysis:
-> Swing: Bullish.
-> Internal: Bullish.
Following previous high, and printing of bearish CHoCH, price has pulled back to an M15 supply zone, where we are currently seeing a reaction. Therefore, I shall now confirm internal high.
Price is now trading within an established internal range.
The remainder of my analysis shall remain the same as analysis dated 13 June 2025, apart from target price.
As per my analysis dated 22 May 2025 whereby I mentioned price can be seen to be reacting at discount of 50% EQ on H4 timeframe, therefore, it is a viable alternative that price could potentially print a bullish iBOS on M15 timeframe despite internal structure being bearish.
Price has printed a bullish iBOS followed by a bearish CHoCH, which indicates, but does not confirm, bearish pullback phase initiation. I will however continue to monitor, with respect to depth of pullback.
Intraday Expectation:
Price to continue bearish, react at either M15 supply zone, or discount of 50% internal EQ before targeting weak internal high priced at 3,451.375.
Note:
Gold remains highly volatile amid the Federal Reserve's continued dovish stance, persistent and escalating geopolitical uncertainties. Traders should implement robust risk management strategies and remain vigilant, as price swings may become more pronounced in this elevated volatility environment.
Additionally, President Trump’s recent tariff announcements are expected to further amplify market turbulence, potentially triggering sharp price fluctuations and whipsaws.
M15 Chart:
XAUUSD (GOLD), bullish setup activeXAUUSD (GOLD), bullish setup active. 1H timeframe has given me the confirmation for a bullish setup. If you want to have higher R:R, wait for the pullback to be completed and then enter around 3351-56. Also look at my yesterdays setup in 5-15m timeframe.
Cheers
GOLD Growth Ahead! Buy!
Hello,Traders!
GOLD is trading along the
Rising support and is already
Making a bullish rebound so
As we are bullish biased due
To the strong uptrend we
Will be expecting a further
Bullish move up on Gold
Buy!
Comment and subscribe to help us grow!
Check out other forecasts below too!
Disclosure: I am part of Trade Nation's Influencer program and receive a monthly fee for using their TradingView charts in my analysis.

Gold Spot / U.S. Dollar (XAUUSD) 2-Hour Chart2-hour candlestick chart displays the price movement of Gold Spot (XAUUSD) against the U.S. Dollar, with the current price at 3,373.97, reflecting a +5.99 (+0.18%) change. The chart highlights recent price trends, including a notable upward movement, with key support and resistance levels marked around 3,366.81 and 3,410.25, respectively. The time frame spans from approximately 6:00 AM to 3:35 PM CEST on June 23, 2025.

XAUUSD POSSIBLE TRADE SETUPPotential Trade Setup on XAUUSD
Overview:
Gold (XAUUSD) has shown consistent bullish momentum for over 16 months. Recently, we’ve seen a continuation of that strength, especially after breaking above the key $2,320 resistance zone. While there has been some temporary consolidation, the overall bullish structure remains intact, supported by ongoing geopolitical tensions and inflation hedging.
That said, I am still anticipating a possible continuation of the bullish momentum that has been in play for quite some time. Moving forward, I will be looking for a clear break above the 3380 region — followed by a successful retest of the breakout zone — before entering a long position.
Alternatively, a short opportunity may arise if the 3350 intraday resistance holds and the price fails to break above it. In that case, I will look for signs of further downward momentum toward the 3300 region.
🧭 Trading Plan:
✅ BUY:
Look for a break and retest of the 3355 region on the 4H timeframe.
🔻 SELL: Bias (Alternative Scenario):
If the price stays below the 3350 zone, then look for a potential short opportunity moving forward.
🎯 Targets & Risk Management: Targeting 1:2 R:R on both setups.
RiseAn artistic view that may be wrong or right.
Price on the hourly frame broke the structure .Gold waiting for takeoff

GOLD's rise has been steady, decisive move aheadGold is the focus, plain and simple. We’re in an ascending channel, and price is respecting that structure with precision, higher highs, and no major signs of exhaustion yet.
Recently a clear resistance level was just taken out, and now I am watching for the classic retest. That breakout? A big deal, and a strong clue as well. If that zone holds as support, that’s a green light for a potential upmove toward 3,460 which matches the top of the channel.
But if it fails, we could expect a slight pullback, it might mean we could be in for a healthy dip before the next move.
Bottom line: follow the structure, and don’t force trades here without confirmation first

Gold short from 3314Gold projection for the next week.
First a long up until 3300 region then from there i will be lookibg for shorts.

Gold sell setup H4Hello! Friends,
Greetings. Please leave a Like if you like the idea.
Before start talking about technical Let's share your LOVE by giving me LIKES to support this work. Thanks in advance.
