XAUUSD BREAKOUT TRADE (READ CAPTION)hi trader's. what do you think about gold
current price: 3318
gold is breakout bullish trade line gold retest down side. then gold taking support and jump upside
support zone: 3314,3295
resistance zone :3345,3365
stop loss: 3282 market low
GOLDMINICFD trade ideas

GOLD to the MoonHiper Clear Structure and the beginning of a new impulse towards 3.600 and 3.700
Hope everybody had a chance to got in
gg

The gold bull-bear game intensifiesThe gold bull-bear game intensifies: a breakthrough opportunity is hidden in the short-term shock
The gold market experienced violent fluctuations this week, and the core contradiction came from contradictory employment signals:
ADP cooling: The number of private sector jobs in the United States unexpectedly decreased in June, which once strengthened the expectation of a rate cut in September and pushed the gold price up
Non-farm counterattack: The subsequent non-farm employment announced exceeded expectations (206,000), which quickly extinguished the enthusiasm for rate cuts and gold prices gave up gains
Central bank support: Global central banks continue to buy gold (China increased its gold reserves in June), building a safety cushion for long-term prices
The essence of the "data fight" reflects that the resilience of the US economy remains, but cracks have appeared. The Federal Reserve dares neither cut interest rates too early (inflation risk) nor over-tighten (loosening of the employment market). This swing state will prolong the volatility cycle of gold, but every sharp drop is an opportunity for central banks and long-term investors to enter the market.
Technical aspect: Breakthrough signal of the four-hour chart
Current market characteristics:
Key position: 3344-3346 area has become the watershed between long and short positions. After three unsuccessful tests, the probability of this breakthrough has increased
Morphological structure: Breakthrough of the downward trend line of the four-hour chart + MACD golden cross, long arrangement of hourly moving average
Volume coordination: After yesterday's retracement to 3330 support, the volume rebounded, showing strong low-level support
Operation strategy:
Bull defense line: 3330-3325 (if broken, it will turn into shock)
Upward target:
▶ The first target is 3360 (previous high psychological position)
▶ The second target is 3380 (Fibonacci extension position)
▶ Ultimate target 3400 (option barrier)
Specific plan:
Conservatives:
Light long position at 3333-3335 (stop loss 3323)
After breaking through 3347, add more positions (stop loss 3335)
Radicals:
Batch layout above the current price of 3340, with 3325 as the ultimate defense
Risk warning:
⚠️ Beware of the volatility caused by Powell's speech on Friday night
⚠️ If 3320 is lost, beware of a deep correction to the 3300 mark
Currently, gold is in the "accumulation breakthrough" stage, with a bullish technical side but requiring fundamentals to cooperate. It is recommended to use the "small stop loss breakthrough" strategy, and it is better to miss it than to go against the trend. If it can stand firm at 3350 this week, it will no longer be a fantasy to look at 3400 in the third quarter.
"Gold (XAUUSD) is moving down to grab liquidity."Looking for Impulse Down.
Gold/XauUsd: This chart shows a clear Market Structure Shift (MSS) following a liquidity sweep (SMT) near the highs. Price is now respecting a bearish order block and forming lower highs, indicating smart money distribution.
Targeting sell-side liquidity at 3274.75 and 3246.50. Until price reclaims the most recent supply (above 3,300), the bearish bias remains intact.
Educational Use Only: This breakdown is for study and informational purposes and is not financial advice.
Learn & Earn!
Wave Trader Pro

XAU/USD 1H Outlook
FVG Fill (3320–3318)
Price is expected to drop into the unfilled Fair Value Gap between 3320 and 3318.
London/NY Liquidity Hunt
After filling the FVG, look for a swift bullish impulse during the London and New York sessions to trigger stop-runs and collect liquidity.
Downward Correction to 3305 & 3298
Once the liquidity grab completes, expect a retracement:
First target: 3305
On a break below 3305, next target is the unfilled FVG at 3298
Summary:
Drop → FVG fill (3320–3318) → Bullish liquidity hunt (London/NY) → Retracement toward 3305 (then 3298)

short gold week The market is at a point where we must sell, it's at a maximum of Elliott Waves, wave 5 is already extremely extended, so prepare for a mega drop of several weeks while everyone continues to buy at the lows, it will continue to go down. In summary, we have a bullish market on H4, now there will be a correction on H1, that is, a bearish trend on H1 for several weeks; it is not an ABC, but 5 bearish waves.

Gold (XAUUSD) Analysis : Bullish Structure Setup + Target🧠 Gold (XAUUSD) Technical Analysis
Gold has recently been trading within a clearly defined descending channel, which has governed price action over the past several sessions. This structure is characterized by a series of lower highs and lower lows, forming well-established channel resistance and channel support levels. However, recent bullish pressure has led price to aggressively test the upper boundary of this channel, signaling the potential for a structural breakout.
We are now at a technical inflection point, where a successful breakout and retest could mark the beginning of a significant trend reversal and short-to-medium term bullish move.
🔍 Key Technical Levels & Zones
🔷 Channel Resistance (~3,325)
The price is currently testing the descending trendline acting as channel resistance.
This area has previously rejected price several times, increasing its significance.
A confirmed break and close above this level may shift the market bias from bearish to bullish.
🔷 Central Zone – Dual Demand (~3,325–3,330)
This horizontal zone intersects with the channel resistance and aligns with two previous demand zones, now acting as a key decision area.
The market must validate this zone as new support before any sustained upward movement can occur.
🔷 Next Reversal Zone – Target (~3,370)
The next major area of interest lies around 3,370, a zone identified by previous swing highs and visible liquidity pools.
This level is likely to act as a magnet for price if bullish structure is confirmed.
📈 Price Structure Outlook
The potential breakout is supported by a strong bullish impulse off the channel support, followed by a series of higher lows suggesting growing bullish momentum. The projected movement scenario is as follows:
Break above the channel resistance
Retest and confirm the central zone as support
Continuation toward the 3,370 reversal zone
This would complete a classic break–retest–continuation pattern.
✅ Trade Considerations (Not Financial Advice)
Entry Type Entry Condition Target Stop Loss
Aggressive Break & 2H close above 3,330 3,370 Below 3,320
Conservative Retest & bullish confirmation above 3,325 3,370 Below 3,310
Risk Management:
Use position sizing aligned with your risk tolerance (max 1–2% per trade).
Monitor volume closely during breakout and retest for confirmation.
⚠️ Invalidation Scenario
If price fails to break above the channel and is rejected strongly, especially with a bearish engulfing or long upper wick, the downside could resume. In such a case, price may revisit the channel midline or even the lower boundary around 3,290.
📝 Summary
Gold is at a critical juncture, testing long-standing channel resistance.
A break above and successful retest of the 3,325–3,330 zone could lead to a rally toward 3,370.
This setup reflects a potential shift in structure from bearish to bullish on the 2H timeframe.

Gold on Hold: Consolidation Without a SignalGold is holding up well for now and consolidating at the current level. But there’s no clear opportunity to buy or sell. It’s just guesswork at this point. And why would I need that? I want to make money, not to be "right."
On a global, long-term horizon (up to a year), I believe the metal will go higher. On the daily and weekly charts, the trend is still upward, and both geopolitical factors and the Fed’s rate policy support the continuation of the trend. But when exactly will it happen? That’s unclear. For now, there are no setups for a trade.
Interestingly, gold and other precious metals might move in different directions. Gold could start a correction while other metals could rise, as they are undervalued. But undervaluation isn’t a direct reason to buy. It’s always better to follow this rule: the market knows better than all of us what the fair price should be right now. Still, when it comes to entering a position, my opinion that the metal is undervalued can be taken into account—and if there’s a proper setup, the entry can be made. It’s like a puzzle. One factor is one piece, then another, and another—and once the full picture comes together, that’s when we enter the position.

Gold Price Analysis - 4-Hour Chart4-hour candlestick chart for the Gold Spot price in U.S. Dollars (XAUUSD), sourced from OANDA. The chart displays the price movement over time, with green candles indicating an increase in price and red candles indicating a decrease. The chart also features various technical indicators and annotations, including a trend line and a support level.

#GOLD Buy 3294 - 3290#GOLD Buy 3294 - 3290
Stoploss 3282
Breakeven 3294.5
TakeProfit 1: 3296
TakeProfit 2: 3304
TakeProfit 3: 3314
TakeProfit 4: 3326
TakeProfit 5: 3340
Trade at your own risk
Protect your capital
The Wizard 🧙♂️ FDT
Wed 09 Jul ‘25 03:00 PM

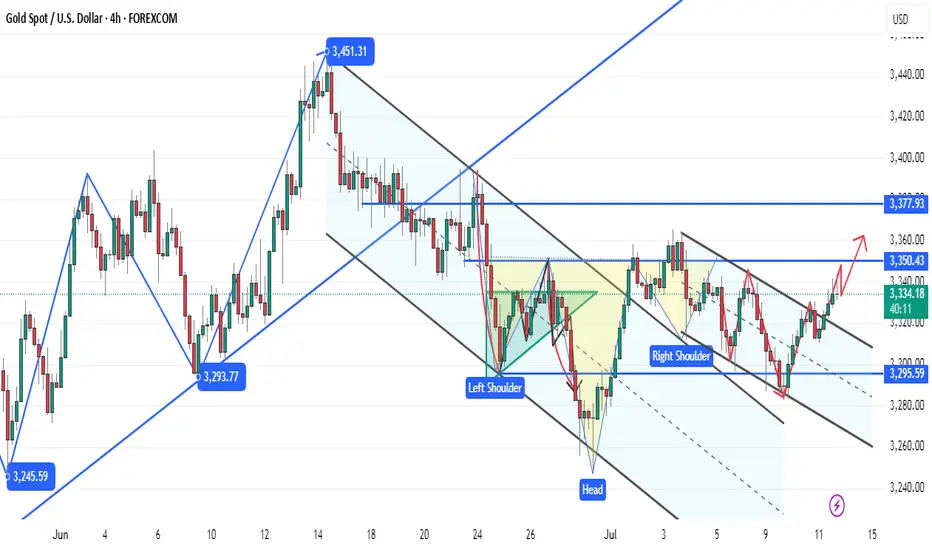
Trade Analysis (GOLD – XAUUSD)
Trade Analysis (GOLD – XAUUSD)
This chart highlights a classic bullish reversal setup forming after an extended downtrend. Here's the breakdown:
Descending Channel Structure: Price moved within a well-defined falling channel, forming lower highs and lower lows. This is often a sign of controlled bearish pressure rather than a full-on collapse.
Liquidity Grabs: Key swing highs and lows (circled) show areas where liquidity was swept before price reversed. These are classic signs of institutional moves clearing stop zones.
Bullish Breakout & Retest: Price eventually broke out of the descending channel to the upside, then came back for a clean retest of the structure—confirming the breakout is valid.
Higher Low Formation: After the retest, price formed a higher low, signaling buyer strength and potential for a trend reversal.
Projected Bullish Move: Based on market structure and momentum, we anticipate a bullish continuation towards higher highs as shown by the projection.

XAUUSD - UniverseMetta - Signal#XAUUSD - UniverseMetta - Signal
H4 - Rebound from the channel border towards the formation of a potential 3rd wave on D1. Stop behind the local minimum.
Entry: 3297.457
TP: 3330.716 - 3390.419 - 3439.762 - 3487.197
Stop: 3279.737

Gold is in a tug-of-war again
The oscillating pattern under the tug-of-war between gold risk aversion and the dollar
News: The interweaving of long and short factors has caused gold to fall into a tug-of-war
Positive factors:
Trump's new tariff policy: The United States will impose a 25% tariff on Japanese and Korean goods from August 1, and US stocks fell in response. The market's risk aversion sentiment has increased, and the price of gold has rebounded from a low of 3296 points to 3345 points.
The central bank continues to buy gold: The People's Bank of China continued to increase its gold holdings in June, buying for the eighth consecutive month, which has long supported the price of gold.
The long-term weakness of the US dollar: Although the US dollar index has strengthened in the short term, it has fallen 10% this year, close to a three-and-a-half-year low. Gold is still attractive as an anti-inflation asset.
Negative factors:
The US dollar has strengthened in the short term: Boosted by strong non-agricultural data, the US dollar index rebounded to 97.67, suppressing gold buying (especially non-US currency holders).
Geopolitical risks have cooled: There has been no major conflict in the international situation recently, and the demand for safe havens has declined. The rise in gold prices lacks sustainability.
Personal opinion:
Gold is currently in the game stage of "safe-haven support level vs. US dollar suppression level", and the short-term trend depends on the market's expectations of the Fed's policies and trade frictions. If the US dollar continues to rebound, gold prices may be under pressure; but if US economic data weakens or geopolitical risks reappear, gold prices may break through the range of fluctuations.
Technical aspect: shock narrowing, direction to be broken
Daily level: range fluctuations (3295-3345), moving average adhesion, unclear trend, need to wait for breakthrough signals.
Key points:
Resistance level: 3345 (multiple highs fall back, break through to see 3400).
Support level: 3295-3300 (break through may fall to 3270-3260).
4-hour chart: MACD golden cross is fragile. If the price falls below 3320, it may turn into a dead cross, exacerbating the risk of a pullback.
Weakness of hourly chart: K-line is under pressure from the short-term moving average. If the rebound in the early trading is weak, it may continue to fluctuate downward.
Personal strategy:
Short-term bearish: Before the effective breakthrough of 3345, you can lightly hold short orders, and wait for the price to rebound to 3320-3330 before testing short orders, with the target at 3300-3295.
Bull opportunity: It may pull back to the support area of 3290-3295 to stabilize, and you can arrange long orders.
Summary and operation suggestions
Core logic: Gold is stuck in the deadlock of "news disturbance + technical shock", and we need to be wary of false breakthroughs.
Key points: Upward breakthrough: If it stands firm at 3345, it will look to 3400. Downside risk: If it loses 3295, it may test the support of 3270-3260.
Subjective tendency: In the short term, it is more inclined to bearish volatility, because the dollar is strong and the sustainability of risk aversion is questionable. However, if the Fed releases dovish signals or US stocks fall sharply, gold may reverse quickly.


Xausd techinical analysis.Xausd techinical analysis next move posibale at h1 time frame.not finchinal advice.

Gold Spot / U.S. Dollar (XAU/USD) 4-Hour Chart4-hour chart from OANDA displays the recent price movement of Gold Spot (XAU/USD) against the U.S. Dollar. The current price is $3,325.120, reflecting a decrease of $11.320 (-0.34%). The chart highlights a recent upward trend with a buy signal at $3,325.410 and a sell signal at $3,324.830, indicating a potential trading range. A shaded area suggests a possible price target or support/resistance zone around $3,355.478, with historical price levels marked on the right side. The timeframe covers the period around July 7-8, 2025.

GOLD BUY ZONES Gold Buy Zone We Have
Bullish Engulfing Area ( 3317 - 3311 )
Order Block Area ( 3304 - 3295 )
Target We Are Expect Previous High Lets Gooo

XAUUSD Outlook: How Risk Sentiment Could Shape the Next MoveI’m currently analysing XAUUSD (Gold) 🟡, which has come under bearish pressure 📉, showing signs of downside momentum. In the video 🎥, we also explore the inverse correlation between Gold and risk assets like the NASDAQ 📊.
Keep a close eye on NASDAQ movements—if risk assets break bullish 🚀, we may see further weakness in Gold. On the other hand, if risk sentiment shifts and risk assets break bearish 🛑, Gold could attract safe-haven demand and gain strength 💪.
We also dive into the price action, market structure, and pull up the volume profile 🧩. Gold is currently trading around the Point of Control (POC) ⚖️—a key level where significant volume has accumulated. A clean break above or below this area could act as a technical trigger for the next move 📈📉.
As always, this is not financial advice ⚠️—just my market view.

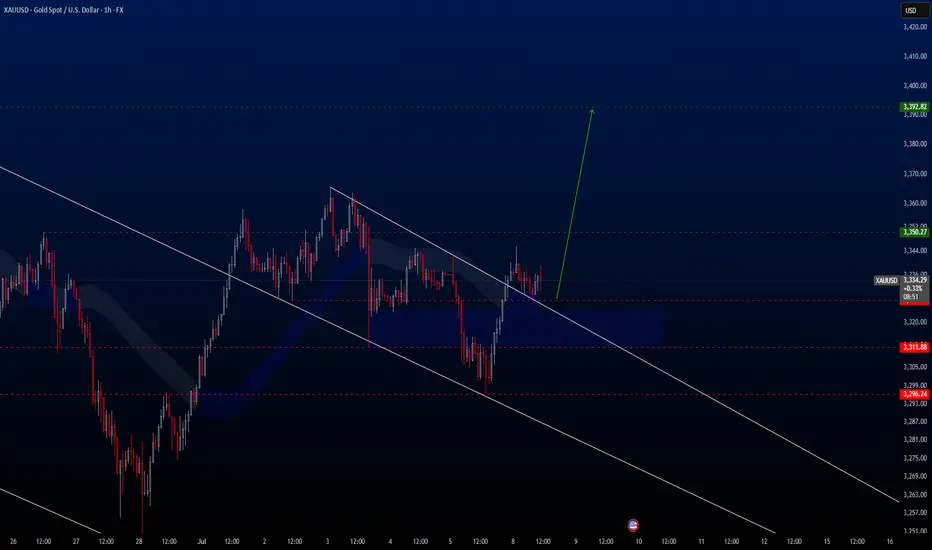
XAUUSD Hello traders,
Today we're taking advantage of a great buying opportunity on the XAUUSD pair. This setup is ideal for both medium- and long-term positions. I anticipate that the price will rise toward the 3392.82 USD level in the coming weeks.
That’s why I’ve positioned this trade as a medium-term opportunity.
Gold H1 | Approaching an overlap resistanceGold (XAU/USD) is rising towards an overlap resistance and could potentially reverse off this level to drop lower.
Sell entry is at 3,344.65 which is an overlap resistance.
Stop loss is at 3,368.00 which is a level that sits above a swing-high resistance.
Take profit is at 3,313.35 which is a pullback support.
High Risk Investment Warning
Trading Forex/CFDs on margin carries a high level of risk and may not be suitable for all investors. Leverage can work against you.
Stratos Markets Limited (tradu.com ):
CFDs are complex instruments and come with a high risk of losing money rapidly due to leverage. 63% of retail investor accounts lose money when trading CFDs with this provider. You should consider whether you understand how CFDs work and whether you can afford to take the high risk of losing your money.
Stratos Europe Ltd (tradu.com ):
CFDs are complex instruments and come with a high risk of losing money rapidly due to leverage. 63% of retail investor accounts lose money when trading CFDs with this provider. You should consider whether you understand how CFDs work and whether you can afford to take the high risk of losing your money.
Stratos Global LLC (tradu.com ):
Losses can exceed deposits.
Please be advised that the information presented on TradingView is provided to Tradu (‘Company’, ‘we’) by a third-party provider (‘TFA Global Pte Ltd’). Please be reminded that you are solely responsible for the trading decisions on your account. There is a very high degree of risk involved in trading. Any information and/or content is intended entirely for research, educational and informational purposes only and does not constitute investment or consultation advice or investment strategy. The information is not tailored to the investment needs of any specific person and therefore does not involve a consideration of any of the investment objectives, financial situation or needs of any viewer that may receive it. Kindly also note that past performance is not a reliable indicator of future results. Actual results may differ materially from those anticipated in forward-looking or past performance statements. We assume no liability as to the accuracy or completeness of any of the information and/or content provided herein and the Company cannot be held responsible for any omission, mistake nor for any loss or damage including without limitation to any loss of profit which may arise from reliance on any information supplied by TFA Global Pte Ltd.
The speaker(s) is neither an employee, agent nor representative of Tradu and is therefore acting independently. The opinions given are their own, constitute general market commentary, and do not constitute the opinion or advice of Tradu or any form of personal or investment advice. Tradu neither endorses nor guarantees offerings of third-party speakers, nor is Tradu responsible for the content, veracity or opinions of third-party speakers, presenters or participants.

GOLDAlthough there is a bearish divergence visible on the weekly timeframe (which often signals a possible slowdown or reversal in the trend) the daily timeframe shows that gold has broken out of a bullish flag pattern a continuation pattern that usually leads to further upside.
This breakout suggests that, despite the divergence gold still has room to move higher in the short term. Based on this pattern it could rise up to around 38000 before it begins a retracement (a temporary pullback). After the retracement the overall upward trend may resume, especially if strong support levels hold.

$XAU mau breakdown besarDisclaimer:
THIS IS NOT A SELL INSTRUCTION
BUT SERVES AS A REFERENCE FOR THE BIG MAJOR TREND IF IT TURNS OUT TO BE VALID
From the retest to the nearest resistance, I suspect that gold may fail to break through the red resistance area.
And from the chart, there’s already a slight hint of a breakdown.
Will gold plunge and break its major daily trendline support?
