XAUUSD is bullishFrom the chart, you will understand that xauusd is about to buy
Reasons;
1; In daily timeframe, you will see a hammer candlestick
2; Falling wedge pattern breakout
3; In 4 hrs, Third trendline touch
4; In lower timeframe, you will see a double bottom before the falling wedge breakout
GOLDMINICFD trade ideas
XAUUSD and USOILHesitation Geopolitical factors have led to the escalation of relations between several countries. The Middle East is in chaos. Although this is a trading market, the relationship between the two is too close. This is why the Asian market XAUUSD reached a high of 3400.
But it is not stable. Because after the news that stimulated the rise in gold prices over the weekend, there were some negative news. For example, peace talks, time differences, negotiations and other factors have eased the tense atmosphere. Then the gold price fell with the trend, reaching a low of 3347.
From the overall situation, the market still has the momentum to rise in the short term. But this depends on Iran's response. Including the impact of the Strait of Hormuz. This is the key factor in the rise or fall of oil prices. Investors with larger funds can arrange long orders in advance.
The view on XAUUSD is to buy at low levels. The impact of geopolitics is too huge. On the basis of interest rate cuts, buying is the key to profit. But everyone's financial situation is different, so when trading, remember to control the position ratio. Prevent trading errors from leading to account liquidation.

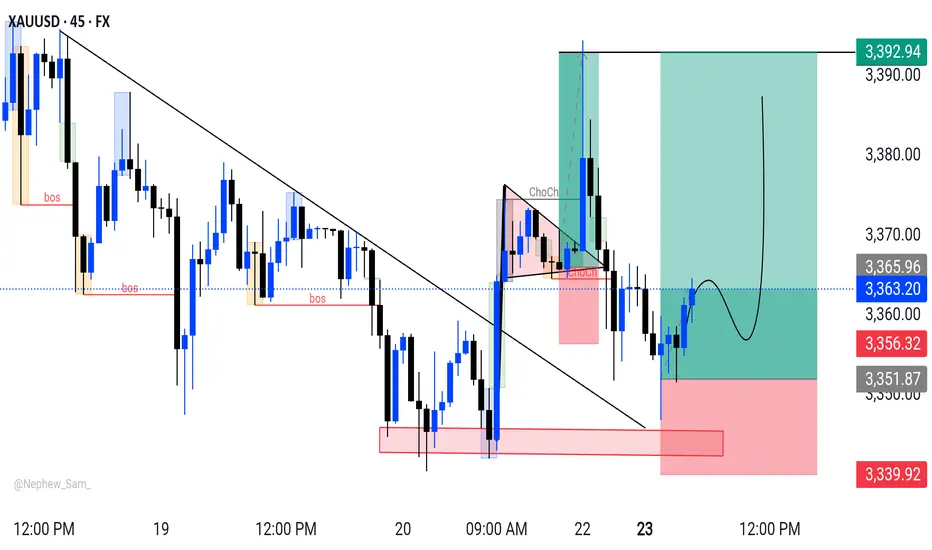
XAUUSD M45 Outlook "Gold (XAUUSD) breaks out of descending triangle pattern, signaling potential trend reversal. Price action suggests further upside, targeting $3,392.94 resistance level. Traders, keep a close eye on this development. #gold #XAUUSD #trading"
XAUUSD Analysis todayHello traders, this is a complete multiple timeframe analysis of this pair. We see could find significant trading opportunities as per analysis upon price action confirmation we may take this trade. Smash the like button if you find value in this analysis and drop a comment if you have any questions or let me know which pair to cover in my next analysis.

XAUUSDAt the moment, the world is in a major crisis, generating distrust in the future of the economic system, but at the same time, there is significant speculation about the returns of energy industry companies. This observation, like many others mentioned in global financial news, can serve as a reference for verifying the direction of the markets. It is important to emphasize that if we want to take advantage of all these changes in so many assets, we must be very cautious and aware of the risks involved. Please, this idea is only to share my thoughts on the future of gold in the coming days, where we are looking for a price stabilization after a great deal of turmoil resulting from great optimism and great uncertainty about institutional decisions. Tell me what you think about it.
Vincent Ramirez Cambronero

Hold on to the high point and go short decisively!Gold closed the weekly line today, maintaining the idea of oscillating downward. The 4H consecutive negatives tested the support of the lower Bollinger track. Although it was roundabout and saw-sawed, every decline would be accompanied by a new low. Therefore, hold the high point to see the bottom break and accelerate. The lower side will gradually look to 3338 and 3315. Among them, 3315 is a strong support for the weekly line. If it is not broken, you can consider going long; the upper rebound pressure is 3361 and 3375. In terms of operation, short according to the rebound strength, and the specific points are subject to the bottom 🌐 notification.
Operation suggestion: Short gold in batches near 3361-3375, with a target of 3350-3340.

XAUUSD Short Opportunity🔻 XAUUSD Short Opportunity – Targeting 3258.840
Gold is showing signs of weakness after testing key resistance zones.
I'm currently watching a short-term sell setup with a downside target at 3258.840.
If bearish pressure continues, this level could be hit soon.
📉 Keep an eye on confirmation candles and momentum shifts.
👉 Follow me for more real-time setups and precision entries in Gold & Forex!

When will the price of gold fall?Market news:
In the early Asian session on Friday (June 20), spot gold fell narrowly and is currently trading around $3,360 per ounce. London gold prices fluctuated violently under the dual influence of the Fed's hawkish stance and geopolitical tensions. Powell's hawkish stance cooled the market's expectations for interest rate cuts. As a non-yielding asset, international gold is under obvious pressure under high interest rate expectations. In sharp contrast to the Fed's hawkish stance, geopolitical tensions have provided important safe-haven support for international gold prices. The escalation of the Israeli-Iranian conflict has not only exacerbated tensions in the Middle East, but also triggered market concerns about the global security environment. As a traditional safe-haven asset, gold is often sought after when geopolitical risks rise. In the short term, the continued escalation of the conflict between Israel and Iran may continue to drive safe-haven funds into the gold market, but the direction of the Fed's monetary policy and the specific implementation of the Trump administration's tariff policy will have a key impact on the medium- and long-term trend of gold prices.
Technical Review :
Gold maintained a volatile closing. The daily chart closed with alternating buying and selling for four consecutive trading days. There was no trend continuation. We will continue to pay attention to the 3350/3390 range during the day. Today's trading ideas are still short-term, selling at high prices and buying at low prices to participate in the volatile trend.So far this week, gold has been difficult to break out of the continuity of buying and selling. Yesterday, Thursday, under the temporary performance of gold's short-term dollar trend, we are optimistic that gold will fluctuate in the range, with the maximum range at 3350/3400, but there may often be a breakout on Thursday. Therefore, today we should pay attention to both trading within the range and the strength after the breakout.
Today's analysis:
Gold fluctuated overall yesterday due to the early closure of the US market, and the fluctuation was not large. However, gold as a whole is still biased towards selling. Gold is now weak in buying and rebounding, so there is a lot of room for gold selling. Next, we will continue to sell gold. If there is no particularly large profit to support gold, then gold buying may not cause any big waves in the short term. Gold 1-hour moving average continues to cross and sell downward. Gold selling is strong and there is still room for downward movement. After gold fell yesterday, the highest rebound was around 3378, and then it continued to fall back. After rebounding several times, it did not break through 3378 again. Gold continued to sell at high prices under pressure at 3378. Gold is now fluctuating and falling, and the center of gravity is constantly moving downward. With this trend, gold may accelerate downward at any time.
Operation ideas:
Short-term gold 3335-3338 buy, stop loss 3328, target 3370-3380;
Short-term gold 3360-3370 short, stop loss 3387, target 3330-3340;
Key points:
First support level: 3352, second support level: 3344, third support level: 3331
First resistance level: 3378, second resistance level: 3388, third resistance level: 3400

The rebound is weak, is it expected to continue to decline? 📰 Impact of news:
1. Geopolitical situation
2. Pay attention to the impact of short-term trends of the US dollar and silver on gold
📈 Market analysis:
The weekly level large range sweep is still going on, with a focus on the space defense dividing line area of the 10-day moving average and the 3315-3310 area. After falling back to the lifeline in four hours, it continued to bend downward under pressure. During the sweeping decline, the suppression became more obvious. Whether there will be a wave of large-volume market, the pattern is expected to further open and guide the direction. In this process, note that the lifeline 3375 is also the resistance point determined by the last rebound last night. Use this as suppression to sweep the range below. On the whole, for the future gold, if it can maintain the rhythm of defending highs and breaking lows, and successfully closes at a low level today, then next week it is expected to further switch downwards to sweep space. Therefore, we will continue to focus on two support areas, one is 3345-3335, and the other is 3315-3310 after breaking
🏅 Trading strategies:
BUY 3345-3335
TP 3355-3365
SELL 3365-3375
TP 3345-3335-3315
If you agree with this view, or have a better idea, please leave a message in the comment area. I look forward to hearing different voices.
TVC:GOLD FXOPEN:XAUUSD FOREXCOM:XAUUSD FX:XAUUSD OANDA:XAUUSD

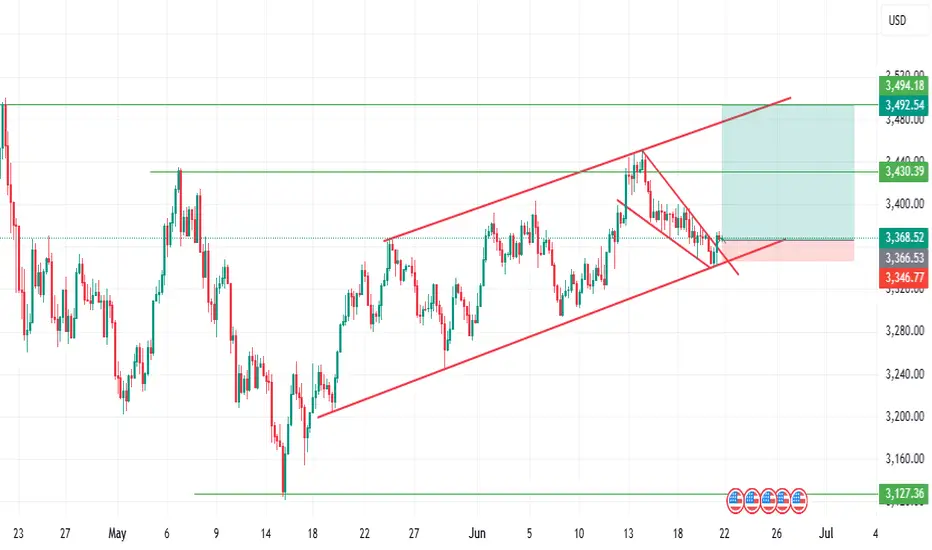
GOLD's rise has been steady, decisive move aheadGold is the focus, plain and simple. We’re in an ascending channel, and price is respecting that structure with precision, higher highs, and no major signs of exhaustion yet.
Recently a clear resistance level was just taken out, and now I am watching for the classic retest. That breakout? A big deal, and a strong clue as well. If that zone holds as support, that’s a green light for a potential upmove toward 3,460 which matches the top of the channel.
But if it fails, we could expect a slight pullback, it might mean we could be in for a healthy dip before the next move.
Bottom line: follow the structure, and don’t force trades here without confirmation first

Gold prices continue temporary downtrend⭐️GOLDEN INFORMATION:
Gold prices (XAU/USD) came under renewed selling pressure during Friday’s Asian session, dipping to their lowest level in over a week, near the $3,344–$3,345 range. The decline was largely driven by the Federal Reserve’s hawkish tone, which emphasized persistent inflation risks and suggested a more gradual path to interest rate cuts—dampening demand for the non-yielding precious metal. Nevertheless, fragile market sentiment and a cautious risk environment may continue to lend some support to gold, potentially cushioning it against steeper declines.
⭐️Personal comments NOVA:
Selling pressure continues to maintain, pushing gold price down to 3304 today, the downtrend price line is maintaining well.
⭐️SET UP GOLD PRICE:
🔥SELL GOLD zone: 3418- 3420 SL 3425
TP1: $3400
TP2: $3382
TP3: $3370
🔥BUY GOLD zone: $3306-$3304 SL $3299
TP1: $3315
TP2: $3328
TP3: $3340
⭐️Technical analysis:
Based on technical indicators EMA 34, EMA89 and support resistance areas to set up a reasonable SELL order.
⭐️NOTE:
Note: Nova wishes traders to manage their capital well
- take the number of lots that match your capital
- Takeprofit equal to 4-6% of capital account
- Stoplose equal to 2-3% of capital account

Gold Prices Pull Back Amid Profit-Taking and Unchanged Fed ratesMacro approach:
- Gold prices have recently pulled back as investors took profits at elevated levels to offset losses elsewhere amid rising geopolitical tensions in the Middle East and steady Fed holding rates.
- Speculation is mounting that the US may involve into the Middle East conflicts, raising fears of a broader regional tensions.
- Meanwhile, a dovish Fed outlook signaling two potential rate cuts this year and concerns over growing US debt continues to provide underlying support for gold prices.
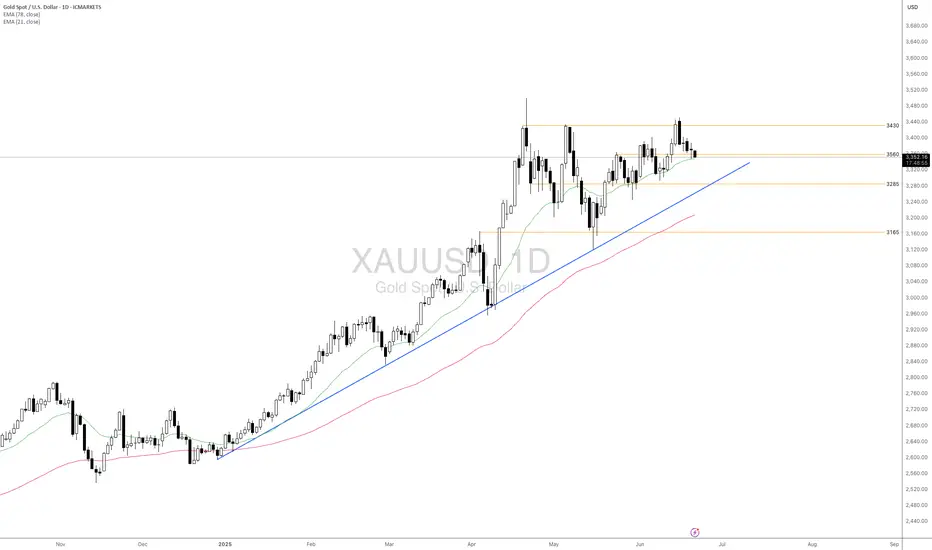
Technical approach:
- XAUUSD is retesting EMA21, and the support level is around 3560. The price is above both EMAs, indicating that the upward momentum is intact.
- If XAUUSD closes below EMA21, it may continue to plunge and retest the following support at 3285, which is the confluence with the ascending trendline.
- On the contrary, remaining above 3560 may prompt a potential retest of the key resistance at around 3430.
Analysis by: Dat Tong, Senior Financial Markets Strategist at Exness
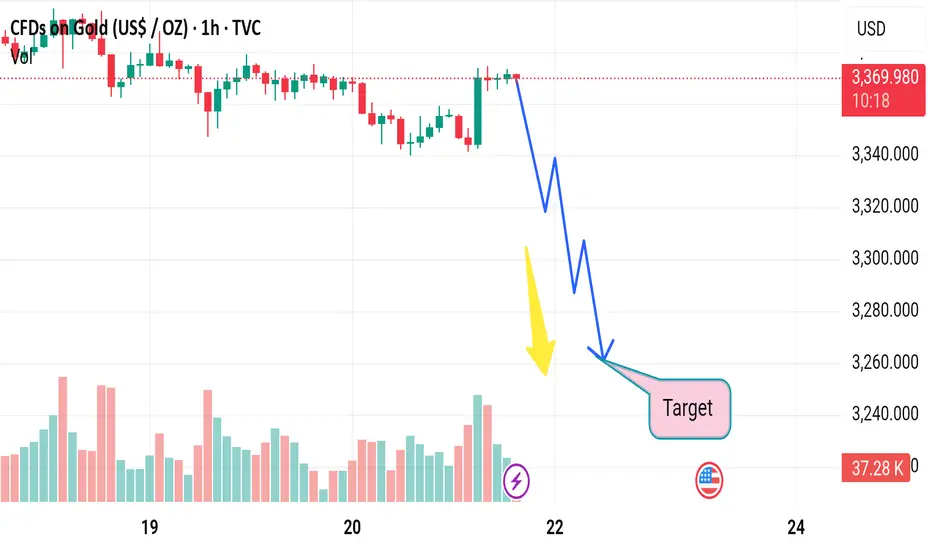
Market next target 📉 Original View (Bearish Outlook):
Predicts a downward move from around $3,370 to the target near $3,250.
Sharp drop illustrated with zigzag downward arrows.
Yellow arrow highlights growing volume — likely interpreted as early selling pressure.
---
🔄 Disruption: Bullish Reversal or Trap Setup
🧠 Problems With Bearish Thesis:
1. Volume Spike Might Indicate Demand:
The yellow arrow highlights a volume surge, but this might be buyer absorption, not selling dominance.
If this volume came during a wick-heavy candle or hammer, it suggests buying interest at lows.
2. No Break of Major Support Yet:
Price is still above $3,350, a key psychological and technical zone.
No clear breakdown has occurred — the downtrend is assumed, not confirmed.
3. Oversold Momentum?
Momentum indicators (not shown) may reveal oversold conditions, making a short-term rebound more probable.
Gold analysis - Bullish outlook in play!Hey traders! 👋
Let’s break down what’s happening on Gold (XAU/USD).
On the higher timeframe, Gold remains in a strong bullish trend. Price is currently rising from the May 14th low and appears to be targeting the all-time high around 3500.120.
Zooming in, we can see a minor pullback unfolding, likely a setup for the next leg higher. I’ve marked the minor low (A) and minor high (B) to define our current dealing range. Connecting these with a Fibonacci retracement, price has tapped into the discount zone, showing signs of potential accumulation.
On the lower timeframe, there’s a clear market structure shift, suggesting momentum could soon flip back to the upside.
📌 My plan:
Buy now at 3354
Stop Loss: 3312.11
Take Profit Targets:
– TP1: 3400.00
– TP2: 3452.00
– TP3: 3501.14
⚠️ Note: There's still a possibility of a deeper dip toward 3031, so I’m factoring that into my risk management.
What’s your take on this setup? Drop your thoughts in the comments below. Let’s discuss!

Gold in the Spotlight – Safe Haven or Short-Term Speculation?Hello everyone, great to see you again in our latest discussion about XAUUSD.
This week, gold has seen wild swings—soaring to new highs amid geopolitical tensions, then sharply pulling back. This highlights gold’s dual nature: both a safe-haven asset in times of crisis and a highly reactive instrument during speculative surges.
The Fed’s decision to hold interest rates at 4.50% and maintain a cautious stance on monetary policy continues to weigh on the precious metal. Still, growing expectations of rate cuts later this year remain a key bullish factor for gold, which doesn’t generate yield.
Meanwhile, persistent conflicts in the Middle East and the ongoing Russia–Ukraine war are fueling defensive investment demand. Central banks around the world are also steadily accumulating gold, reinforcing its role as a hedge against global economic and political uncertainty.
As for me, I remain optimistic about long-term upside potential. What are your expectations for gold?

THE KOG REPORTTHE KOG REPORT
In last week’s KOG Report we said we would want the lower level red box to be tested and rejected in order to give us the move upside into that 3330-35 region where we wanted to monitor the price for the short. We managed to get a pin point move, however, we had to exit the short trades early due to the support level holding us up. We then continued to follow Excalibur and the red box indi’s which were suggesting higher pricing and by the end of the week we had completed all our bullish above target levels, plus Excalibur trade targets and LiTE again performed at 100% accuracy.
A phenomenal week in Camelot, not only on Gold but the numerous other pairs we trade, analysis and post on.
So, what can we expect from the week ahead?
For this week we can expect some gaps on open which is going to make it difficult due to skewed data. We will however stick with the red box levels and the tools we have to make a plan for the two scenarios we may see potential of.
Scenario one:
Price opens and gaps upside, we’ll be looking for the levels of 3455-60 for a potential reaction in price, if achieved, an opportunity may be available to short there back down into the 3450, 3443 and 3435 levels.
Scenario two:
If we do open and gap downside, we’ll look for the levels of 3430-23 to hold us up, and if achieved, an opportunity to long there back up into the 3450-5 level and in extension of the move 3465 may be available.
It’s a difficult one again as no one knows how the market is going to open and what is going to happen. So we’ll update traders as much as we can during the day and the week with KOG’s bias of the day and red box target levels
KOG’s bias of the week:
Bearish below 3465 with targets below 3425, 3420, 3410 and 3406
Bullish on break of 3465 with targets above 3477, 3485, 3492, 3495 and 3503
Red Boxes:
Break above 3435 for 3443, 3448, 3465 and 3476 in extension of the move
Break below 3420 for 3410, 3406, 3397, 3385 and 3380 in extension of the move
Many of our followers and traders have seen the power of the red boxes, Imagine this on your own TV screen, 4H for swing trading, 1H for day trading and 15min for scalping. Any pair on any chart 23hrs a day. Add to that the Knights indicator giving you swing points, key levels and retracement levels and our custom volume indicator telling you when to long, when to short and when to stand back from your trades.
LEARN AND GENERATE YOUR OWN SIGNALS. You don't need any of us to guide you.
Please do support us by hitting the like button, leaving a comment, and giving us a follow. We’ve been doing this for a long time now providing traders with in-depth free analysis on Gold, so your likes and comments are very much appreciated.
As always, trade safe.
KOG

Gold Pullback: Bear Trap or Buy Dip?📊 Chart Analysis: A clear pullback within the established uptrend is visible, testing key support at —a healthy correction that reinforces the bullish structure.
🔍 News Contradiction🌍: Despite escalating Middle East tensions (typically a gold-positive catalyst), prices are trending lower—a classic bear trap scenario 🚫📉. This divergence underscores the importance of buying dips amid emotional sell-offs.
💡 Trading Framework:
Fed policy statement yesterday failed to spark volatility, as markets had already priced in dovish expectations 💨;
Weekly pattern: Asian sessions have consistently seen rallies 📈, followed by profit-taking pullbacks in later sessions 📉;
Tactical entry: Use intraday highs from Asian trading as resistance references for long positions 🎯.
Technical Confirmations:
Risk Warning: Geopolitical bullish signals being ignored suggests deliberate bearish manipulation (bear trap 🚫);
Timing Strategy: Asian session highs serve as ideal resistance markers—look to enter on retracements to 38.2% Fib levels 🎯
⚡️⚡️⚡️ XAUUSD ⚡️⚡️⚡️
🚀 Buy@ 3335 - 3345
🚀 TP 3360 - 3370
Accurate signals are updated every day 📈 If you encounter any problems during trading, these signals can serve as your reliable guide 🧭 Feel free to refer to them! I sincerely hope they'll be of great help to you 🌟 👇

CHECK XAUUSD SIGNAL READ CAPTAINxauusd buy now ✅
entry point (3355) (3353)
TAKE PROFIT 1: (3360)
TAKE PROFIT 2: (3370)
LAST TARGET (3378)
STOP LOSS (3345)

Gold Formation as Growing trendXAUUSD (Gold) Price Analysis
Gold is currently testing trend support, undergoing a deep correction amid a complex fundamental backdrop. Several key factors are influencing market sentiment:
Geopolitical tensions in the Middle East Comments from the Federal Reserve Former President Trump's expressed desire for lower interest rates These developments are contributing to market uncertainty, which typically supports gold as a safe haven.
🔍 Technical Outlook
Support Zone: 3350
Resistance Levels: 3400 and 3420
Before further upside, a retest of the 3350 support zone is possible. You can see more details in the Chart Ps Support with like and comments for more analysis.

Gold 15-Min Breakout Zones l Smart Money Trap Exposed – 🔥 Gold – 15 Min & 1hr Scalping Analysis
⚡️ Objective: Precision Breakout Execution
Time Frame: 30-Minute Warfare
☄️ Hanzo Protocol: Dual-Direction Entry Intel
👌Bullish After Break : 3380
Price must break liquidity with high volume to confirm the move.
➕Reasons
— 1hr Major Key level
— Retest at 3380 x7 wick's
— Choch x2 Retest at same point 3380
— Trend Line At Exact Point
👌Bearish After Break : 3357
Price must break liquidity with high volume to confirm the move.
➕Reasons
— 1hr 3wicks Touch at same point of key
— Gap Zone
— Choch x2 Retest at same point 3362 / 15 min Tf
— Body Close / Gap Zone / Hidden Support 3357


XAUUSD - Breakdown: Israel-Iran Conflict - RISK OFF Part III missed to Publish my Idea here, I frequently share charts on my X handle for those who would like to follow, @JOHNDOUGHFX
OK let get into it.. I will publish my entire Idea as I did from the start of the sells, it has been quiet accurate but with terrible choppy PA.
FOMC likely a no move event. Rates to stay high due to tariff risks, Gold has been sentiment driven from last week-so Risk ON/OFF dominates.
Israel-Iran talks ongoing → expect noise + fake escalations before a “Deal"
Gold Order Flow zones at 3409 / 3450
Israel–Iran conflict = main wildcard.
Expect sudden headline moves: escalation threats → quick spikes.
But watch for fake outs followed by a “deal” headlines.
That’s your Risk ON trigger.
Buy the rumor, sell the news.
Key levels for OANDA:XAUUSD :
⚠️ Liquidity trap zone: 3409–3415
⚠️ Double top watch: 3448–3450 (psy level)
Below 3400, we could fade toward:
🔻 3350
🔻 3330
🔻 3322
Plan both sides, don’t chase breakouts.
For today's Analysis, Yesterday we have closed a bullish Doji Candle, signaling buyers, even though we broke below today, there was no selling pressure breaking the previous Daily low, and it has reacted close to As we have tapped the 39 Area, and pulled back, 43-45 if defended, will see price push higher into the high 65-70-75 extended Price Points before we can look for sells again.
As Iran - US tensions are now extended for 2 weeks, I believe the typical news escalations will keep price action on the edge, at present the market is sentiment driven with Risk OFF, so plan your trades accordingly. Risk ON can come with any optimistic news, especially a "DEAL"
Cheers and have a good last trading day!!

Gold Outlook: Sharp Breakout or Pullback Ahead?Despite heightened geopolitical tensions alongside a weak US Dollar, gold's price action remains in pullback mode below the $3,400 level, awaiting a catalyst.
Technically, gold remains at the upper boundary of a long-term ascending channel, anchored by the 2016 and 2020 highs. It also sits just beneath the projected breakout zone of a large cup-and-handle pattern, with a potential target near $4,000.
If gold manages a firm close above $3,500 and clears the upper boundary of the channel, bullish momentum could lift prices toward $3,700, and possibly $4,000, during the second half of 2025.
Conversely, sustained weakness below the $3,300 level would open the door to near-term support zones at $3,290, $3,240, $3,100, and $2,800, which may offer "buy-the-dip" opportunities along its primary uptrend.
- Razan Hilal, CMT
