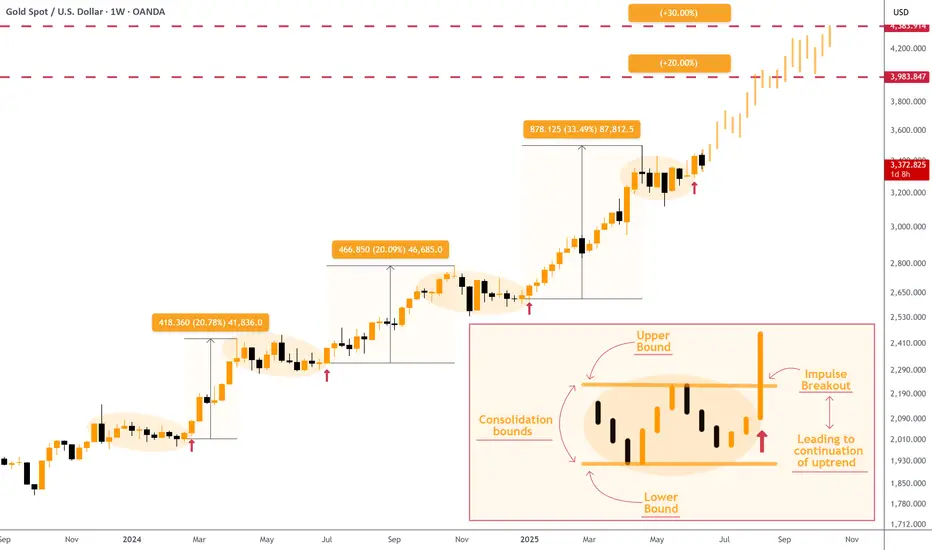
$XAU — Endless Up-Trend on GOLD!Gold ( TVC:XAU ) continues its powerful uptrend , repeating a clear and profitable trading pattern: explosive moves (20-30% gains) , brief sideways consolidations, and renewed breakouts. Since early 2024, three such cycles have occurred, each flagged by red breakout arrows on the 1W chart.
Currently, gold is forming another tight consolidation range between roughly $3,200–3,450. Historically, these consolidations have consistently resolved upward. If the pattern repeats, the next target zones lie around $3,985 (+20%) and $4,385 (+30%) . Such bullish targets align with major banks: Goldman Sachs targets $3,700 by year-end and potentially $4,500 in high-risk scenarios, while J.P. Morgan forecasts $4,000 by mid-2026.
Several factors fuel gold’s bullish momentum:
• Central-bank buying remains robust, projected to surpass 1,000 tonnes for the fourth consecutive year.
• Geopolitical risks, tariff disputes, and a weakening USD have enhanced gold’s appeal as a safe-haven asset.
• Central banks increasingly prioritize gold for reserve diversification and risk management, not just speculation.
So, to be short: if weekly closes stay above the $3,200 support, gold likely continues its bullish momentum toward the $4,000 handle .
GOLDMINICFD trade ideas
Gold delivering excellent Scalp opportunities Fundamental analysis: Gold was among the losers (Short-term) of the Fed's decision this throughout yesterday’s session for then first time within #8-Month period. Valuable ground's given and #3,400.80 benchmark looks unreachable for at least this week’s borders. Fed kept rates unchanged, and signaled that current Rate would continue through #2025 to support the next phase of the economic recovery. Investors clearly show their interest to try riskier assets like equities and as long as DX is without a recovery (currently on steep Descending Channel), Gold will keep constantly deliver Bull spikes. Daily chart turned Neutral with Resistance level priced at #3,395.80 - #3,400.80 and if invalidated I expect historic upside potential of Gold (my estimations show even #3,452.80 and #3,500.80 in succession within #2 - #3 Month variance). Quarterly Investors will pressure on the Resistance based on Bullish Fundamental outlook on Gold. However with Gold’s Technicals critically Bearish, I won’t be surprised to see values below #3,352.80 benchmark tested and invalidated.
My position : I have monitored the Price-action from sidelines and spotted few patterns however didn’t engaged as my Profit range is already decent. However I spotted excellent post-Fed opportunity and Bought Gold aggressively on #3,363.80 and closed the order on #3,378.80 last night. I will continue Scalping current #3,357.80 - #3,395.80 range as it is excellent Trading lately.

Wyke of Gold ZoneHey guys as we can see we have a super breakout from the sideways phase and now with the retest we go Liq hunting :D

GOLD 1H CHART ROUTE MAP UPDATE & TRADING PLAN FOR THE WEEKHey Everyone,
Please see our updated 1h chart levels and targets for the coming week.
We are seeing price play between two weighted levels with a gap above at 3340 and a gap below at 3418. We will need to see ema5 cross and lock on either weighted level to determine the next range.
We will see levels tested side by side until one of the weighted levels break and lock to confirm direction for the next range.
We will keep the above in mind when taking buys from dips. Our updated levels and weighted levels will allow us to track the movement down and then catch bounces up.
We will continue to buy dips using our support levels taking 20 to 40 pips. As stated before each of our level structures give 20 to 40 pip bounces, which is enough for a nice entry and exit. If you back test the levels we shared every week for the past 24 months, you can see how effectively they were used to trade with or against short/mid term swings and trends.
The swing range give bigger bounces then our weighted levels that's the difference between weighted levels and swing ranges.
BULLISH TARGET
3340
EMA5 CROSS AND LOCK ABOVE 3340 WILL OPEN THE FOLLOWING BULLISH TARGETS
3463
EMA5 CROSS AND LOCK ABOVE 3463 WILL OPEN THE FOLLOWING BULLISH TARGET
3483
EMA5 CROSS AND LOCK ABOVE 3483 WILL OPEN THE FOLLOWING BULLISH TARGET
3508
BEARISH TARGETS
3418
EMA5 CROSS AND LOCK BELOW 3418 WILL OPEN THE FOLLOWING BEARISH TARGET
3393
EMA5 CROSS AND LOCK BELOW 3393 WILL OPEN THE SWING RANGE
3372
3353
EMA5 CROSS AND LOCK BELOW 3393 WILL OPEN THE SECONDARY SWING RANGE
3330
3306
As always, we will keep you all updated with regular updates throughout the week and how we manage the active ideas and setups. Thank you all for your likes, comments and follows, we really appreciate it!
Mr Gold
GoldViewFX

XAUUSD – Support Under Threat, Deeper Decline LoomsGold is stalling below the 3,444 USD resistance, forming a series of lower highs — a clear sign of weakening bullish momentum. The support area around 3,358 USD is under pressure, and a break below this level could trigger a drop toward 3,280 USD.
On the news front, the FOMC has reaffirmed its hawkish stance, making no mention of a rate cut despite signs of slowing economic growth. This has strengthened the USD, placing additional downward pressure on gold.
In summary, XAUUSD is on the verge of breaking its bullish structure. If current support fails, sellers may take full control of the market.
XAUUSD Trade Idea:
Position: SELL if price breaks below 3,358 USD
Target: 3,304 – 3,280 USD
Stop Loss: Above 3,400 USD

Buy GoldThe $3,390 support level remains a key battleground for bulls and bears. A strong hold here opens the path for a high-momentum breakout, potentially propelling XAU/USD to test the $3,720–$3,760 region. This setup offers a clear structure, supported by both price action and historical behavior, making it a high-probability bullish opportunity — provided the zone remains intact.

Gold: Will It Hold or Be Manipulated?Gold: Will It Hold or Be Manipulated?
During this week, the picture of gold did not change much. The price found a strong support area near the 3375 level, and it seems that it will not decrease further without some major news.
The price of gold has recently been dominated only by the war between Israel and Iran, which is in its 6th day without any agreement yet between the US and Iran.
Today we have the FOMC meeting, but in my opinion, the decision that the FED may take regarding the interest rate has no impact on the price of gold, since Gold is a safe asset and the current situation is critical.
We may see speculative moves to lower gold during the FOMC, but under normal conditions, it should not fall given the current geopolitical tensions in the Middle East.
It can only fall from any manipulation, because from a fundamental perspective, gold should rise or at least a long pause around our area may be needed.
Key target zones: 3420 | 3450 | 3470 | 3490
You may find more details in the chart!
Thank you and Good Luck!
❤️PS: Please support with a like or comment if you find this analysis useful for your trading day❤️

GOLD fluctuates, but remains generally stable sidewaysOANDA:XAUUSD has been volatile and volatile but has remained broadly stable as investors assess the conflict between Israel and Iran while keeping an eye on this week's Federal Reserve policy meeting.
Spot gold was steady at $3.38/oz at press time, down from a high of $3,403/oz yesterday (Tuesday).
Israel and Iran traded fire for a fifth day on Tuesday as US President Donald Trump called for the evacuation of the Iranian capital Tehran and cut short his trip to the G7 summit in Canada, amid reports he had asked his administration's National Security Council to prepare in the Situation Room.
According to Reuters, Tehran has asked Oman, Qatar and Saudi Arabia to urge Trump to push Israel for a regional ceasefire in exchange for Iran's willingness to be flexible in nuclear talks.
Trump's latest Truth Social post stated: "I have not communicated with Iran in any way, shape or form about (peace talks). This is all fake news! If they want to negotiate, they know how to communicate with me. They should make a deal at the negotiating table, it will save lives!!!"
Forexlive commented that those who know Trump know that he will definitely wait for Iran to come to him. According to reports, Iran is trying to negotiate a ceasefire, but has not received any substantive news so far.
Non-yielding gold is seen as a hedge against geopolitical and economic uncertainty and has generally performed well in low interest rate environments. So, fundamentally speaking, gold should be positive in the current market environment, although the sharp declines often make new traders lose their confidence in the trend. I myself have been the same way, there have been many times this year when I did not believe in myself, did not believe in the uptrend and ended up with bad results…
The Fed's interest rate decision and Chairman Jerome Powell's speech will be released today (Wednesday). Traders are now expecting the Fed to cut interest rates twice by the end of the year.
According to CME's "Federal Reserve Watch" on June 18:
• The probability of the Federal Reserve keeping interest rates unchanged in June is 97.3% and the probability of a 25 basis point rate cut is 2.7%;
• The probability of a rate stay unchanged in July is 85.3%, the probability of a cumulative 25 basis point rate cut is 14.4% and the probability of a cumulative 50 basis point rate cut is 0.3%.
Technical Outlook Analysis OANDA:XAUUSD
On the daily chart, gold has been trading back and forth between the 0.236% Fibonacci retracement level and the 3,400USD whole price point, which was noted as the nearest support and resistance sent to readers in the previous issue.
However, the overall technical structure remains unchanged with the uptrend still dominating the chart, with the EMA21 support as the important support and the trend as the main trend. Meanwhile, the 0.236% Fibonacci retracement level is the nearest support and the price channel is the short-term trend.
In terms of momentum, the Relative Strength Index (RSI) remains above 50 and 50 is considered support in this case for the RSI, with the distance far from the overbought zone suggesting that there is still room for upside ahead.
During the day, if gold breaks above the raw price point of $3,400, it will give a positive signal for the bullish outlook and the target is then around $3,435 in the short term.
Finally, the notable positions will be listed as follows.
Support: $3,371 – $3,350
Resistance: $3,400 – $3,435
SELL XAUUSD PRICE 3423 - 3421⚡️
↠↠ Stop Loss 3427
→Take Profit 1 3415
↨
→Take Profit 2 3409
BUY XAUUSD PRICE 3351 - 3353⚡️
↠↠ Stop Loss 3347
→Take Profit 1 3359
↨
→Take Profit 2 3365

GOLD H4 Update: Bulls will target 3600/3750 USD Market Update🏆 Gold Market Mid-Term Update (June 16, 2025)
📊 Price & Technical Outlook
Current Spot Price: around $3,414
Technical Setup
* Gold consolidating above major support at \~\$3,180–3,200
* Testing resistance at \~\$3,380–3,400; breakout could push toward \$3,600
* Recent price action considered a healthy consolidation with upside potential
🏆 Bull Market Overview
* Pullback likely complete; supported by strong geopolitical and macro tailwinds
* Key price levels: \$3,000 / \$3,200 / \$3,400 (resistance near \$3,400)
* Bullish target: \$3,600, with further upside possible if momentum holds
* Short-term dips remain buying opportunities—“buy the dip” remains favored
⭐ Recommended Strategy
BUY/HOLD: Continue to accumulate on dips, using \$3,200–3,300 as entry zones
Target: Maintain bull target at \$3,600, with breakout opportunity above \$3,400
🏦 Macro & Market Drivers
Fed & Central Bank Outlook
* Investors positioning for possible Fed rate cuts later this year, likely totaling around 75 bps by end of 2025
* Ongoing dollar weakness supports gold
Geopolitical Tensions
* Middle East unrest, U.S.–Iran dynamics, and global evacuations are fueling safe-haven demand for gold
* Continued volatility in global hotspots likely to keep gold elevated
Risk Appetite & Market Behavior
* Both stocks and gold are climbing—an unusual “optimism + fear” scenario
* Central banks, especially in China, India, and Turkey, have been strong gold buyers in 2025
* Speculative positions in gold futures remain high
U.S.–China & Trade Tariffs
* Unresolved U.S.–China tariffs and tensions continue to support gold
* Any easing in trade friction could temper gold’s advance
📰 Latest Market Sentiment
* Wall Street remains bullish on gold for the upcoming week, though some caution persists ahead of the upcoming Fed meeting
* Macro environment is seen as supportive for gold and other precious metals
* Gold’s rally is positively influencing the broader precious metals market
🌏 Demand Themes
* **Asian Buyers**: China may relax gold import quotas to manage currency, while India demand remains strong though can be seasonally slower
* **Central Banks**: Over 240 tonnes of gold added in Q1 by central banks, with China and India as top buyers
⚠️ Risks & Watchpoints
* Fed surprises: A more hawkish tone at the next meeting could push gold back toward \$3,200–3,300
* Geopolitical breakthroughs: Any stable resolutions could reduce safe-haven demand
* Large speculative position unwinds could create short-term volatility
🔎 Mid-Term Outlook Summary
| Scenario | Support | Resistance | Catalysts |
| --------- | ------------- | ---------- | ----------------------------------- |
| Base case | \$3,200–3,300 | \$3,400 | Rate cut expectations + geopolitics |
| Bull case | Above \$3,400 | \$3,600+ | Escalating risk, dovish Fed |
| Bear case | Below \$3,200 | — | Hawkish Fed, easing global tensions |
✔️ Final Take
* Technical and fundamental momentum supports a continued bull phase with key target at \$3,600
* Best strategy: accumulate on dips between \$3,200–3,300
* Key factors to watch: Fed’s next move (June 17), Middle East developments, U.S.–China trade actions, central bank buying

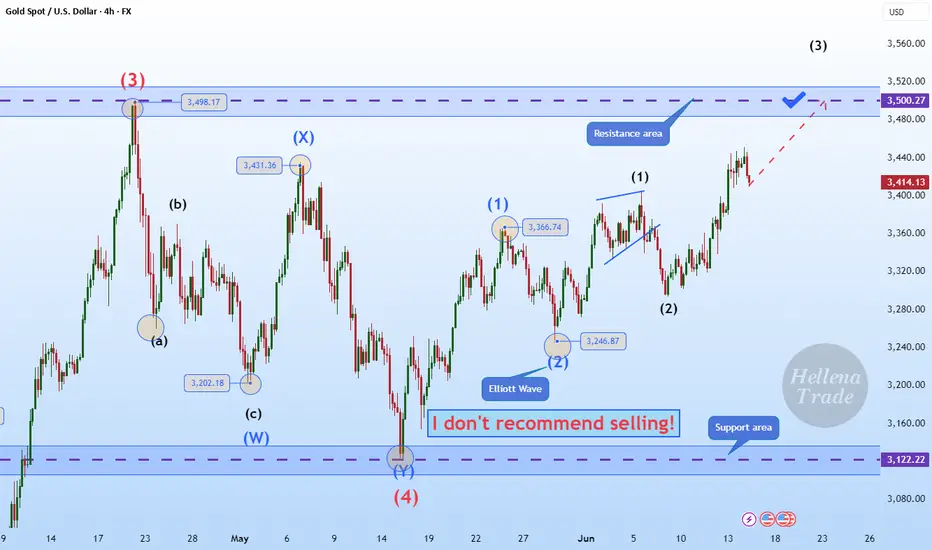
Hellena | GOLD (4H): LONG to resistance area of 3500.Colleagues, I believe that, as with the euro, the upward five-wave impulse is not yet over. At the moment, I see the formation of wave “3” of the lower order and wave ‘3’ of the middle order, which means that the upward movement will continue at least to the resistance area of 3500 — this is the maximum of wave “3” of the higher order, which means that a correction is possible at this level.
Manage your capital correctly and competently! Only enter trades based on reliable patterns!
Lingrid | GOLD Weekly Analysis: Geopolitical Safe-Haven RallyOANDA:XAUUSD demonstrated exceptional strength this week as geopolitical tensions from Israeli-Iranian conflicts drove massive safe-haven demand. The metal successfully broke above the critical 3,360 resistance level, confirming the completion of an inverse head and shoulders pattern that has been forming since April.
The 4H chart reveals the market appears to be forming an ascending triangle pattern within a broader upward trendline, suggesting continued bullish momentum. The recent breakout above the monthly high resistance zone indicates strong institutional buying pressure.
The daily chart presents an even more compelling picture with the completion of an inverse head and shoulders pattern, a classic bullish reversal formation. This technical setup, combined with the massive flag pattern completion, projects potential targets toward $3,650-$3,700 levels. The right shoulder formation confirms the pattern's validity, while sustained buying above previous resistance zones validates the upward trajectory.
We should monitor the $3,430-$3,450 resistance area closely, as a decisive break could accelerate momentum toward the projected targets. The combination of geopolitical risk premiums and technically sound chart patterns creates a favorable environment for continued gold appreciation in the mid-term.
Traders, if you liked this idea or if you have your own opinion about it, write in the comments. I will be glad 👩💻

GOLD On June 18, 2025, the U.S. Initial Jobless Claims came in at 245,000, a decrease of 5,000 from the previous 250,000 and in line with forecasts around 246,000.
Interpretation of the Data:
Current Level:
Claims are stabilizing near the highest levels seen in the past eight months but remain historically low overall, indicating the labor market is slowing but still relatively resilient.
Labor Market Momentum:
The slight decline suggests a modest easing in layoffs but also reflects a gradual loss of labor market momentum, consistent with softer hiring trends seen in recent months.
Seasonal and Technical Factors:
Some elevation in claims is attributed to seasonal factors such as summer school breaks allowing non-teaching personnel to claim benefits, and technical adjustments.
Impact on Markets and Fed Policy:
The Fed views stable but slightly elevated claims as a sign that the labor market is cooling but not weakening sharply.
This supports the expectation that the Fed will hold interest rates steady at 4.25%–4.50% in the June 18TH meeting while monitoring future data for signs of further labor market weakening or inflation pressures.
The data reduces immediate pressure for aggressive rate cuts but keeps the door open for gradual easing later in the year if the labor market softens further.
#GOLD

GOLD 3HR PYTHUnemployment Claims Data Context
Forecast: 246,000
Previous: 248,000
The weekly initial jobless claims report is a key indicator for the Federal Reserve, signaling the current state and momentum of the U.S. labor market.
Fed Interpretation: Greater Than Forecast
Indication: A figure above 246,000 suggests the labor market is softening more than expected.
Fed Response:
The Fed would view higher-than-forecast claims as a sign of rising layoffs and potential weakening in employment growth.
This outcome increases concern about the durability of the economic expansion and may raise the likelihood of future interest rate cuts, especially if the trend persists.
The Fed would likely emphasize caution in its policy statement and may signal greater willingness to ease policy if labor market weakness continues.
Fed Interpretation: Less Than Forecast
Indication: A figure below 246,000 signals a stronger-than-expected labor market.
Fed Response:
The Fed would interpret lower-than-forecast claims as evidence that the labor market remains resilient, with fewer layoffs and ongoing job creation.
This outcome reduces the urgency for immediate rate cuts and supports the case for holding rates steady, especially if inflation remains above target.
The Fed is likely to maintain a cautious, data-dependent stance, awaiting further evidence before considering policy changes.
Federal Funds Rate Decision Outlook
Expected Outcome:
The Federal Reserve is widely expected to hold the federal funds rate steady at 4.25%–4.50% during the June 18, 2025 meeting.
Supporting Factors:
Inflation is moderating but remains above target.
Labor market data, including unemployment claims, shows stability without overheating.
Economic uncertainties, including trade policies, encourage a cautious approach.
Market Odds:
There is a near 100% probability of no rate change today, with markets focusing on the Fed’s forward guidance and economic projections for clues on future rate moves.
The Federal Reserve is expected to maintain the current federal funds rate range of 4.25%–4.50%, reflecting a balanced approach amid moderating inflation and steady labor market conditions.
Market participants will closely watch the FOMC statement, economic projections, and press conference for any shifts in tone that could influence future rate expectations and market volatility.

GOLD Unemployment Claims Data Context
Forecast: 246,000
Previous: 248,000
The weekly initial jobless claims report is a key indicator for the Federal Reserve, signaling the current state and momentum of the U.S. labor market.
Fed Interpretation: Greater Than Forecast
Indication: A figure above 246,000 suggests the labor market is softening more than expected.
Fed Response:
The Fed would view higher-than-forecast claims as a sign of rising layoffs and potential weakening in employment growth.
This outcome increases concern about the durability of the economic expansion and may raise the likelihood of future interest rate cuts, especially if the trend persists.
The Fed would likely emphasize caution in its policy statement and may signal greater willingness to ease policy if labor market weakness continues.
Fed Interpretation: Less Than Forecast
Indication: A figure below 246,000 signals a stronger-than-expected labor market.
Fed Response:
The Fed would interpret lower-than-forecast claims as evidence that the labor market remains resilient, with fewer layoffs and ongoing job creation.
This outcome reduces the urgency for immediate rate cuts and supports the case for holding rates steady, especially if inflation remains above target.
The Fed is likely to maintain a cautious, data-dependent stance, awaiting further evidence before considering policy changes.
Federal Funds Rate Decision Outlook
Expected Outcome:
The Federal Reserve is widely expected to hold the federal funds rate steady at 4.25%–4.50% during the June 18, 2025 meeting.
Supporting Factors:
Inflation is moderating but remains above target.
Labor market data, including unemployment claims, shows stability without overheating.
Economic uncertainties, including trade policies, encourage a cautious approach.
Market Odds:
There is a near 100% probability of no rate change today, with markets focusing on the Fed’s forward guidance and economic projections for clues on future rate moves.
The Federal Reserve is expected to maintain the current federal funds rate range of 4.25%–4.50%, reflecting a balanced approach amid moderating inflation and steady labor market conditions.
Market participants will closely watch the FOMC statement, economic projections, and press conference for any shifts in tone that could influence future rate expectations and market volatility.

Gold within known rangeTechnical analysis: Descending Channel on Hourly 4 chart was discontinued as there was an attempt on the same chart to develop Ascending Channel and extend the Intra-day’s relief rally above #3,402.80 benchmark. My action plan remains intact as I will continue operating with Scalp Sell and Buying orders as long as #3,362.80 - #3,402.80 zone holds (so far it hasn't been crossed again to the upside or downside) and reversal towards #3,417.80 Resistance in extension if #3,402.80 benchmark gets invalidated. Consider the Lower High’s Upper zone test on the Daily chart’s scale, while Hourly 4 chart turned Bearish on my key indicators sessions ago. As expected, yesterday's session Daily candle closed below the #3,395.80 Resistance, widely above both of the Daily chart’s MA’s, turning flat for the session (isolated within Neutral rectangle however). That is a strong indication that the market is attempting to Price the Bottom here (temporary or not), which just so happens to be a Lower High's Lower zone within Daily chart’s Ascending Channel. It is no surprise that today's Hourly 4 chart’s candle is attempting to engage Bearish sequence so far and since its on Bearish Technicals (invalidated Ascending Channel), I consider it the most optimal re-Buy entry for a Short-term recovery back towards #3,288.80 - #3,392.80 Resistance belt or above (representing last week’s High’s).
My position: Even though I mentioned remaining on sidelines, I used #3,388.80 - #3,392.80 as an excellent re-Buy zone and closed my set of Scalping orders within #3,393.80 - #3,398.80 and remained off for the session. It is indeed clash of Bearish Technicals and War news (Fundamentally Bullish) as I will keep my Trading activity to minimum, protecting my capital for now.

GOLD 3HR LINE CHARTUnemployment Claims Data Context
Forecast: 246,000
Previous: 248,000
The weekly initial jobless claims report is a key indicator for the Federal Reserve, signaling the current state and momentum of the U.S. labor market.
Fed Interpretation: Greater Than Forecast
Indication: A figure above 246,000 suggests the labor market is softening more than expected.
Fed Response:
The Fed would view higher-than-forecast claims as a sign of rising layoffs and potential weakening in employment growth.
This outcome increases concern about the durability of the economic expansion and may raise the likelihood of future interest rate cuts, especially if the trend persists.
The Fed would likely emphasize caution in its policy statement and may signal greater willingness to ease policy if labor market weakness continues.
Fed Interpretation: Less Than Forecast
Indication: A figure below 246,000 signals a stronger-than-expected labor market.
Fed Response:
The Fed would interpret lower-than-forecast claims as evidence that the labor market remains resilient, with fewer layoffs and ongoing job creation.
This outcome reduces the urgency for immediate rate cuts and supports the case for holding rates steady, especially if inflation remains above target.
The Fed is likely to maintain a cautious, data-dependent stance, awaiting further evidence before considering policy changes.
Federal Funds Rate Decision Outlook
Expected Outcome:
The Federal Reserve is widely expected to hold the federal funds rate steady at 4.25%–4.50% during the June 18, 2025 meeting.
Supporting Factors:
Inflation is moderating but remains above target.
Labor market data, including unemployment claims, shows stability without overheating.
Economic uncertainties, including trade policies, encourage a cautious approach.
Market Odds:
There is a near 100% probability of no rate change today, with markets focusing on the Fed’s forward guidance and economic projections for clues on future rate moves.
The Federal Reserve is expected to maintain the current federal funds rate range of 4.25%–4.50%, reflecting a balanced approach amid moderating inflation and steady labor market conditions.
Market participants will closely watch the FOMC statement, economic projections, and press conference for any shifts in tone that could influence future rate expectations and market volatility.

GOLD 3HR OANDA Unemployment Claims Data Context
Forecast: 246,000
Previous: 248,000
The weekly initial jobless claims report is a key indicator for the Federal Reserve, signaling the current state and momentum of the U.S. labor market.
Fed Interpretation: Greater Than Forecast
Indication: A figure above 246,000 suggests the labor market is softening more than expected.
Fed Response:
The Fed would view higher-than-forecast claims as a sign of rising layoffs and potential weakening in employment growth.
This outcome increases concern about the durability of the economic expansion and may raise the likelihood of future interest rate cuts, especially if the trend persists.
The Fed would likely emphasize caution in its policy statement and may signal greater willingness to ease policy if labor market weakness continues.
Fed Interpretation: Less Than Forecast
Indication: A figure below 246,000 signals a stronger-than-expected labor market.
Fed Response:
The Fed would interpret lower-than-forecast claims as evidence that the labor market remains resilient, with fewer layoffs and ongoing job creation.
This outcome reduces the urgency for immediate rate cuts and supports the case for holding rates steady, especially if inflation remains above target.
The Fed is likely to maintain a cautious, data-dependent stance, awaiting further evidence before considering policy changes.
Federal Funds Rate Decision Outlook
Expected Outcome:
The Federal Reserve is widely expected to hold the federal funds rate steady at 4.25%–4.50% during the June 18, 2025 meeting.
Supporting Factors:
Inflation is moderating but remains above target.
Labor market data, including unemployment claims, shows stability without overheating.
Economic uncertainties, including trade policies, encourage a cautious approach.
Market Odds:
There is a near 100% probability of no rate change today, with markets focusing on the Fed’s forward guidance and economic projections for clues on future rate moves.
The Federal Reserve is expected to maintain the current federal funds rate range of 4.25%–4.50%, reflecting a balanced approach amid moderating inflation and steady labor market conditions.
Market participants will closely watch the FOMC statement, economic projections, and press conference for any shifts in tone that could influence future rate expectations and market volatility.

GOLD 1HRUnemployment Claims Data Context
Forecast: 246,000
Previous: 248,000
The weekly initial jobless claims report is a key indicator for the Federal Reserve, signaling the current state and momentum of the U.S. labor market.
Fed Interpretation: Greater Than Forecast
Indication: A figure above 246,000 suggests the labor market is softening more than expected.
Fed Response:
The Fed would view higher-than-forecast claims as a sign of rising layoffs and potential weakening in employment growth.
This outcome increases concern about the durability of the economic expansion and may raise the likelihood of future interest rate cuts, especially if the trend persists.
The Fed would likely emphasize caution in its policy statement and may signal greater willingness to ease policy if labor market weakness continues.
Fed Interpretation: Less Than Forecast
Indication: A figure below 246,000 signals a stronger-than-expected labor market.
Fed Response:
The Fed would interpret lower-than-forecast claims as evidence that the labor market remains resilient, with fewer layoffs and ongoing job creation.
This outcome reduces the urgency for immediate rate cuts and supports the case for holding rates steady, especially if inflation remains above target.
The Fed is likely to maintain a cautious, data-dependent stance, awaiting further evidence before considering policy changes.
Federal Funds Rate Decision Outlook
Expected Outcome:
The Federal Reserve is widely expected to hold the federal funds rate steady at 4.25%–4.50% during the June 18, 2025 meeting.
Supporting Factors:
Inflation is moderating but remains above target.
Labor market data, including unemployment claims, shows stability without overheating.
Economic uncertainties, including trade policies, encourage a cautious approach.
Market Odds:
There is a near 100% probability of no rate change today, with markets focusing on the Fed’s forward guidance and economic projections for clues on future rate moves.
The Federal Reserve is expected to maintain the current federal funds rate range of 4.25%–4.50%, reflecting a balanced approach amid moderating inflation and steady labor market conditions.
Market participants will closely watch the FOMC statement, economic projections, and press conference for any shifts in tone that could influence future rate expectations and market volatility.

GOLD 30MIN Unemployment Claims Data Context
Forecast: 246,000
Previous: 248,000
The weekly initial jobless claims report is a key indicator for the Federal Reserve, signaling the current state and momentum of the U.S. labor market.
Fed Interpretation: Greater Than Forecast
Indication: A figure above 246,000 suggests the labor market is softening more than expected.
Fed Response:
The Fed would view higher-than-forecast claims as a sign of rising layoffs and potential weakening in employment growth.
This outcome increases concern about the durability of the economic expansion and may raise the likelihood of future interest rate cuts, especially if the trend persists.
The Fed would likely emphasize caution in its policy statement and may signal greater willingness to ease policy if labor market weakness continues.
Fed Interpretation: Less Than Forecast
Indication: A figure below 246,000 signals a stronger-than-expected labor market.
Fed Response:
The Fed would interpret lower-than-forecast claims as evidence that the labor market remains resilient, with fewer layoffs and ongoing job creation.
This outcome reduces the urgency for immediate rate cuts and supports the case for holding rates steady, especially if inflation remains above target.
The Fed is likely to maintain a cautious, data-dependent stance, awaiting further evidence before considering policy changes.
Federal Funds Rate Decision Outlook
Expected Outcome:
The Federal Reserve is widely expected to hold the federal funds rate steady at 4.25%–4.50% during the June 18, 2025 meeting.
Supporting Factors:
Inflation is moderating but remains above target.
Labor market data, including unemployment claims, shows stability without overheating.
Economic uncertainties, including trade policies, encourage a cautious approach.
Market Odds:
There is a near 100% probability of no rate change today, with markets focusing on the Fed’s forward guidance and economic projections for clues on future rate moves.
The Federal Reserve is expected to maintain the current federal funds rate range of 4.25%–4.50%, reflecting a balanced approach amid moderating inflation and steady labor market conditions.
Market participants will closely watch the FOMC statement, economic projections, and press conference for any shifts in tone that could influence future rate expectations and market volatility.

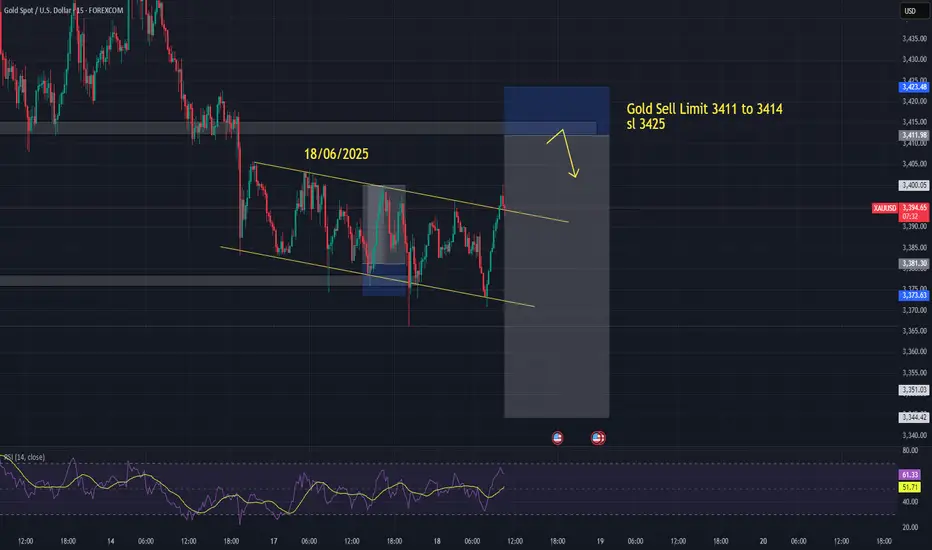
Gold Sell Setup – 18/06/2025📉 Gold Sell Setup – 18/06/2025 📉
Chart shows a clear descending channel formation on the XAUUSD pair.
🔸 Sell Limit Zone: 3411 to 3414
🔸 Stop Loss: 3425
🔸 Expected Reaction: Price is currently at the upper boundary of the descending channel, suggesting potential resistance and reversal.
🟡 RSI is approaching overbought territory, adding confluence for a possible bearish move.
⚠️ Note: Wait for proper rejection confirmation before executing the trade. Trade safe!
6/17 Gold Analysis and Trading SignalsGood morning!
Yesterday, gold opened with a gap-up and surged to around 3451, but failed to sustain above key resistance. After another failed attempt to break higher, prices gradually turned lower and finally broke below 3400, finding short-term support near 3382.
The primary driver of this decline was a waning of geopolitical risk sentiment, which had previously fueled the rally. Additionally, the market is now pricing in expectations that the Fed will keep rates unchanged, a factor that was likely preemptively reflected in price.
🔍 Fundamental Focus:
Today’s U.S. session will feature a key news release, which may prove decisive for gold’s next directional move. With yesterday’s advance pullback, market dynamics are likely to be more volatile today. We recommend caution, especially ahead of the announcement.
📉 Technical View:
Gold is currently in a post-decline consolidation phase.
The main resistance lies between 3430–3450, while 3415 on the 30-minute chart also presents a short-term cap.
For those entering long positions, target zones should remain conservative, ideally around 3412–3418, and then be adjusted depending on volume momentum and breakout structure.
📊 Weekly Structure Outlook:
The weekly chart shows that gold is at a key trend inflection point.
If no additional bullish catalysts emerge, the market is likely to develop into a bearish consolidation, with the next major downside target around 3200.
📌 Trading Plan (For VIP):
✅ Sell Zone: 3436–3466
✅ Buy Zone: 3347–3323
✅ Flexible Trade Zones: 3428 / 3415 / 3403 / 3392 / 3378 / 3362 / 3354

Potential Scenarios (Neutral Outlook):1. Overall Trend (Short-Term):
From early June onward, the trend has shown a clear upward movement, especially after June 11, suggesting bullish momentum.
However, in the most recent candles (last 24–36 hours), there is a consolidation/sideways movement, potentially indicating a pause or reversal.
2. Key Support and Resistance Zones:
Resistance Zone: Around 3,460–3,470 (the recent high before price pulled back).
Support Zone: Near 3,380–3,390, previously tested before the last push upward.
3. Price Structure & Patterns:
There was a strong rally from June 11–13, followed by a pullback and consolidation.
This could be forming a bullish flag or pennant, which often precedes a continuation upward if confirmed by volume or breakout above resistance.
4. Recent Candlestick Behavior:
Current candles are small-bodied with wicks on both sides — this suggests indecision or low momentum, often found before a breakout or reversal.
🧭 Potential Scenarios (Neutral Outlook):
Bullish Continuation: A breakout above the recent high (~3,460) could resume the uptrend toward 3,500+.
Bearish Reversal: A drop below the 3,380 support area could trigger a correction toward 3,340 or lower.
📌 Note: Watch for upcoming economic events marked on the chart — especially those with the U.S. flag, as USD news often significantly affects XAU/USD.

GOLD - Price will bounce from support area and start to growHi guys, this is my overview for XAUUSD, feel free to check it and write your feedback in comments👊
Some days ago price declined to $3220 level and then started to grow, and soon reached $3380 level and even broke it.
Then price started to trades inside wedge, where it at once started to decline and in a short time declined to support line of wedge.
After this, Gold rose and broke $3220 level and continued to move up in wedge, where it also made two gaps before.
Price rose to $3380 level and some time traded very close to this level, but later corrected to support line.
Next, price made a strong impulse, breaking $3380 level and exiting from wedge as well, and continued to grow.
Recently, Gold started to fall, so I think that it will fall to support area and then bounce up to $3500
If this post is useful to you, you can support me with like/boost and advice in comments❤️
Disclaimer: As part of ThinkMarkets’ Influencer Program, I am sponsored to share and publish their charts in my analysis.
