HelenP. I Gold may correct to support zone and then rebound upHi folks today I'm prepared for you Gold analytics. After rebounding from the trend line, XAUUSD began to grow steadily within the rising structure, confidently pushing through local resistance and breaking above the previous support 2 area. This breakout was backed by strong bullish momentum, with the price clearly holding above the broken level, turning it into a support base. Following that surge, the price entered a short-term consolidation, trading within the upper boundary of the chart, just above the 3400 level. This area now acts as a crucial support zone, and the market is currently hovering slightly above it after a local peak. Given the strength of the recent impulse and the confirmation of previous resistance as support, I expect a brief correction to the support zone before a continuation of the bullish move. That’s why I set my current goal at 3470 points — the next potential resistance area where the price may encounter renewed selling pressure after the rally continues. If you like my analytics you may support me with your like/comment ❤️
Disclaimer: As part of ThinkMarkets’ Influencer Program, I am sponsored to share and publish their charts in my analysis.
GOLDMINICFD trade ideas

Excellent Profits throughout yesterday's sessionAs discussed throughout yesterday's session commentary: "I have engaged multiple re-Buy Scalp orders on #3,412.80 Bottom and closed them on #3,420.80 and engaged Swing order on #3,423.80 which was closed on #3,4335.80 which finalized last week in excellent way."
My position: As Gold delivered #3,388.80 - #3,392.80 Support zone test throughout yesterday's session, I have used that opportunity to Buy Gold with both Swing and Scalp orders (#3,388.80 Swing) and #4 aggressive Scalp orders from #3,390.80 towards #3,396.80 - #3,398.80 finishing the session in excellent Profit. I will not engage for today's session as Gold is Technically Bearish and Fundamentally Bullish which displays very mixed / unpredictable Trading as I will remain on sidelines, Highly satisfied with my results.
Keep in mind that as long as #3,377.80 Support is preserved, Bull structure is preserved and Price-action will push for #3,400.80 benchmark test or above. If however #3,377.80 gets invalidated and market closes below it, #3,352.80 benchmark will be tested.

XAUUSDAccording to geopolitical situations all around the world, the trend of XAU is very bullish, as it is visualized in the chart i expect that XAU price to make a new ATH and probably within 10 days to reach 3650-3700$
Due to uncertainty and the manipulation of the crypto market i have paused trading crypto till i would see that there is better trading conditions.
NFA
DYOR

Bullish reversal off 50% Fibonacci support?The Gold (XAU?USD) has bounced off the pivot and could rise to the 1st resistance which acts as a pullback resistance.
Pivot: 3,374.04
1st Support: 3,348.45
1st Resistance: 3,444.62
Risk Warning:
Trading Forex and CFDs carries a high level of risk to your capital and you should only trade with money you can afford to lose. Trading Forex and CFDs may not be suitable for all investors, so please ensure that you fully understand the risks involved and seek independent advice if necessary.
Disclaimer:
The above opinions given constitute general market commentary, and do not constitute the opinion or advice of IC Markets or any form of personal or investment advice.
Any opinions, news, research, analyses, prices, other information, or links to third-party sites contained on this website are provided on an "as-is" basis, are intended only to be informative, is not an advice nor a recommendation, nor research, or a record of our trading prices, or an offer of, or solicitation for a transaction in any financial instrument and thus should not be treated as such. The information provided does not involve any specific investment objectives, financial situation and needs of any specific person who may receive it. Please be aware, that past performance is not a reliable indicator of future performance and/or results. Past Performance or Forward-looking scenarios based upon the reasonable beliefs of the third-party provider are not a guarantee of future performance. Actual results may differ materially from those anticipated in forward-looking or past performance statements. IC Markets makes no representation or warranty and assumes no liability as to the accuracy or completeness of the information provided, nor any loss arising from any investment based on a recommendation, forecast or any information supplied by any third-party.

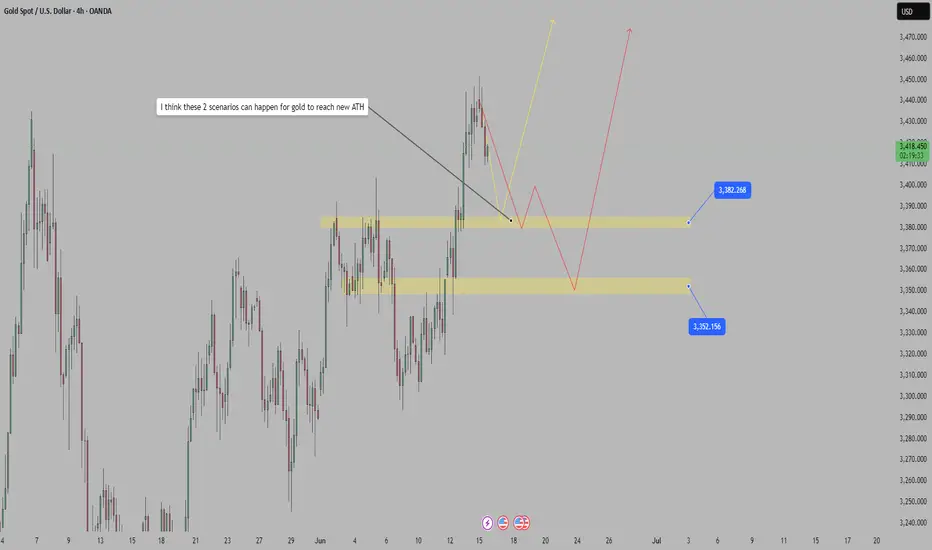
I think these 2 scenarios can happen for gold to reach new ATHGold supported by Israel-Iran conflict, US intervention in focus
Gold's sharp rise came late last week after Israel struck multiple targets in Iran, including Tehran's nuclear facilities.
The attack sparked fierce retaliation from Iran, which launched a barrage of missiles at key Israeli targets, including the financial capital Tel Aviv. Some of the Iranian missiles were also seen penetrating Israel's "Iron Dome" defense system.
What do you think?
Best regards, StarrOne !!!
GOLD WEEKLY CHART MID/LONG TERM ROUTE MAPHey Everyone,
Following up on last week’s chart update, we saw another perfect test of the channel top, right in line with our Goldturn Channel expectations. The new weekly candle completed the channel top challenge with precision.
Our weekly chart idea is now playing out perfectly. We continued to get strong support above 3281, followed by another hit onto the 3387 channel top. But this time, we got something new: a body close above 3387, which confirms the gap to 3482 as active. We’ll now look for that 3482 target to be hit, ascending inline with the channel top.
Any rejection around these upper levels will likely see price retrace to find support at lower Goldturn levels. These are opportunities we’ll be watching closely to buy back in.
Price action remains well-contained between 3281 and 3387, but with that recent close above 3387, we’re now shifting focus toward higher expansion. The structure is rising, and the channel is guiding price beautifully, offering more room for smart, calculated positioning.
As long as we hold above the half-line and especially above 3281, we stay in buy-the-dip mode, favouring long setups from intraday Goldturn zones for quick 20–40 pip scalps or more extended swing entries when structure permits.
Should we see a failure to maintain above 3387 or a close back below 3281, we’ll reassess potential movement toward the lower channel boundary. Until then, the structure remains bullish within the channel and price is following our path perfectly.
The Goldturn methodology continues to prove its worth, cutting through noise, filtering out the fake outs, and keeping us on the right side of the market.
Stay sharp, stay patient.
MR GOLD
GOLDVIEWFX

Daily live trade with XAUUSD in 15m/30m/1h 20250616Daily live trade with XAUUSD in 15m/30m/1h 20250616

Gold is challenging ATHGold meets resistance at 3,440 on Friday, despite a surge in geopolitical risks amid the Iran-Israel war. We expect the market to have a correction before rising to all-time highs.
The ideal ATH level is 3,650
What we want to see to achieve ideal level ?
The market rebounded from the POI level driven by a strong bull signal.
The market break and retest the last high at 3,500.
If the market reverses sharply after breaking 3,500, all the above scenarios will be invalid and a false breakout pattern will occur.
Fundamental level that you should pay attention:-
The Federal Reserve’s interest rate decision will be announced next week, and investors expect Powell to keep interest rates unchanged.
The Iran-Israel war could intensify geopolitical risks in the Middle East. If tensions escalate further, we expect gold price to surge.
The Federal Circuit will appeal Trump's tariffs as an abuse of presidential power on July 31, 2025

Excellent last week / more Profits aheadAs discussed throughout my Friday’s session commentary: “ My position: Gold is Trading on Bullish extension due Middle East crisis escalation. I am looking at my calculated my re-Buy zones to Buy every dip on Gold and continue Scalping (Buy orders only) towards #3,452.80 benchmark potential extension. However if Gold closes the week below #3,400.80 benchmark, Gold will continue ranging and I will alter my perspective (less likely).
I have engaged multiple re-Buy Scalp orders on #3,412.80 Bottom and closed them on #3,420.80 and engaged Swing order on #3,423.80 which was closed on #3,4335.80 which finalized last week in excellent way.
Technical analysis: Gold has now completed the Daily chart’s Triangle peak (local High’s) and thus I am expecting a new Bullish direction starting early week’s phase towards #3,452.80 psychological benchmark and #3,500.80 benchmark in extension (needless to mention, fueled by renewed Middle East crisis escalation as an catalyst). Personally I believe it will be a big one on strong Bull Volume once Buying accumulation is done (happening now). Hourly 4 chart is extending strongly Golden Cross formation and points to an Bullish Short to Medium-term Buying sustainability. A green closing on today's session Daily chart’s candle points to Bullish direction / upwards motion in succession. Personally I believe that only if Selling benchmark gets invalidated and Sellers make a break-out to the downside (now at #3,400.80) does the trend resumes its previous Bearish bias. This is total Bullish trend and total Bullish domination.

GPLD (XAUUSD) Breakout or Trap? Triangle Breakout AheadGold (XAUUSD) is forming an Ascending Triangle pattern, approaching a crucial resistance zone. Price action indicates potential for either a breakout or a false breakout (trap). Key targets and rejection levels are clearly marked on the chart. Stay alert for a possible rejection near the upper trendline or a breakout confirmation above the resistance zone.
This analysis is for educational purposes only — not financial advice. Always manage risk properly.

Xauusd Buy SetupsThis trading setup focuses on price behavior influenced by ongoing geopolitical tensions between Israel and Iran, which have been driving volatility and sharp market reactions around key technical levels.
Setup 1: Rejection and Reversal at 3375
• Watch for a clear rejection of the 3375 level.
• Enter a long position only if a bullish candle closes above the high of the rejected candle.
• Target: 3440, a notable resistance level likely to be tested if bullish sentiment follows through.
Setup 2: Breakout Confirmation Above 3450
• If the price closes above 3450, this confirms a strong bullish breakout.
• Buy targeting 3500, aligning with a continuation of momentum driven by market reaction to geopolitical developments.
Technical Confirmation:
This strategy is supported by powerful custom indicators:
• Doji, Hammer, Star Scanner – effective for spotting early signs of trend reversals or exhaustion.
• Candle Reversal Zones – mark key levels where trend shifts or continuation moves are most likely to occur.
Together, these tools help confirm high-probability entries in volatile environments influenced by the Israel-Iran conflict.

Hanzo / Gold 30 Min ( Accurate Tactical Break Out Zones )🔥 Gold – 30 Min Scalping Analysis (Bearish Setup)
⚡️ Objective: Precision Breakout Execution
Time Frame: 30-Minute Warfare
Entry Mode: Only after verified breakout — no emotion, no gamble.
👌Bullish After Break : 3412
Price must break liquidity with high volume to confirm the move.
👌Bearish After Break : 3372
Price must break liquidity with high volume to confirm the move.
☄️ Hanzo Protocol: Dual-Direction Entry Intel
➕ Zone Activated: Strategic liquidity layer detected — mapped through refined supply/demand mechanics. Volatility now rising. This isn’t noise — this is bait for the untrained. We're not them.
🦸♂️ Tactical Note:
The kill shot only comes after the trap is exposed and volume betrays their position.
Hanzo / Gold 30 Min ( Accurate Tactical Break Out Zones )

XAUUSD Price Analysis | Bearish Reversal in ProgressGold has sharply broken down from the upper boundary of a well-respected parallel channel, hinting at a potential trend reversal.
🔎 Technical Breakdown:
Strong rejection at ~$3,440 resistance zone
Break in market structure = early signs of bearish momentum
Support 1: $3,300 – key short-term zone
Support 2: $3,250 – major confluence level
If price fails to hold above $3,300, a continuation toward $3,250 looks likely in the coming sessions.
📊 Trade Setup
Bias: Bearish
Entry Zone: On pullbacks below $3,390
TP1: $3,300
TP2: $3,250
SL: Above $3,420 (recent swing high)
⚠ Watchlist Dates:
🗓 June 18 – FOMC Meeting (high impact)
💬 What’s your outlook? Will gold hold $3,300 or are bears in control? Let’s discuss below!
#Gold #XAUUSD #PriceAction #TradingView #TechnicalAnalysis #Forex #FOMC #MarketOutlook

GOLD 4H CHART ROUTE MAP UPDATE & TRADING PLAN FOR THE WEEKHey Everyone,
This is an update from last weeks 4H chart route map, as levels are still valid and playing out as analysed. I have only updated the swing ranges accordingly.
3376 and 3438 was hit perfectly last week with ema5 cross and lock confirmation. We are now looking for ema5 cross and lock above 3438 for a continuation into 3498. Failure to lock above will follow with a rejection into the lower Goldturns for support and bounce inline with our plans to buy dips.
We will see levels tested side by side until one of the weighted levels break and lock to confirm direction for the next range.
We will keep the above in mind when taking buys from dips. Our updated levels and weighted levels will allow us to track the movement down and then catch bounces up.
We will continue to buy dips using our support levels taking 20 to 40 pips. As stated before each of our level structures give 20 to 40 pip bounces, which is enough for a nice entry and exit. If you back test the levels we shared every week for the past 24 months, you can see how effectively they were used to trade with or against short/mid term swings and trends.
The swing range give bigger bounces then our weighted levels that's the difference between weighted levels and swing ranges.
BULLISH TARGET
3376 - DONE
EMA5 CROSS AND LOCK ABOVE 3376 WILL OPEN THE FOLLOWING BULLISH TARGETS
3438 - DONE
EMA5 CROSS AND LOCK ABOVE 3438 WILL OPEN THE FOLLOWING BULLISH TARGET
3498
EMA5 CROSS AND LOCK ABOVE 3498 WILL OPEN THE FOLLOWING BULLISH TARGET
3551
BEARISH TARGETS
3302
EMA5 CROSS AND LOCK BELOW 3302 WILL OPEN THE FOLLOWING BEARISH TARGET
3235
EMA5 CROSS AND LOCK BELOW 3235 WILL OPEN THE SWING RANGE
3171
3113
EMA5 CROSS AND LOCK BELOW 3113 WILL OPEN THE SECONDARY SWING RANGE
3045
2987
As always, we will keep you all updated with regular updates throughout the week and how we manage the active ideas and setups. Thank you all for your likes, comments and follows, we really appreciate it!
Mr Gold
GoldViewFX

GOLD DAILY CHART ROUTE MAPHey Everyone,
Following up on our previous analysis, price action has continued to respect our Goldturn channel beautifully. After the strong move to 3272, we saw another push toward the channel top near 3433. This time, the ascending movement to the channel top was completed perfectly, hitting inline with our 3433 axis target.
The key takeaway here is that the channel levels are being respected with precision, validating the strength and reliability of our Goldturn channel framework. 3272 continues to provide solid support, and price remains well-contained within our defined range, reaffirming our strategy of buying dips near the lower end rather than chasing strength at the top.
We will now look for a break above the channel and then support to form above the channel top to confirm a continuation higher. However, failure to lock above the channel will likely result in a rejection back into the range, reinforcing the significance of these key levels.
We remain focused on trading within this structure, using our weighted Goldturns to guide entries on the lower timeframes (1H and 4H). As long as the range remains intact, we’ll continue to target quick 30–40 pip intraday moves while keeping an eye out for a breakout setup.
This is the beauty of our Goldturn channels, drawn using weighted averages rather than pure price action. This method helps us filter out noise and stay on the right side of the market, avoiding common traps.
Keep a close eye on how price behaves around 3272 and 3433. A clean break and sustained hold above the channel top could shift the game, but until that happens, we stick to the range plan.
Let’s stay patient and disciplined.
Mr Gold
GoldViewFX

GOLD - At CUT n REVERSE Region? Holds or not??#GOLD .. perfect move as per our analysis and now market just at his CUT N REVERSE region, that is around 3367-68 to 3370-71
Keep close that region because that is our ultimate region of the week and month.
Only holdings of that region means you can see again bounce for now otherwise not.
NOTE: we will go for cut n reverse below that region on confirmation.
Good luck
Trade wisely

Gold: surged amid Middle East unrestThe newly emerged Middle East tensions pushed investors back into gold, as a safe-haven asset. The price of gold started the previous week in a relatively calm mood, however, the geopolitical tensions pushed the price of gold toward new highs, reaching the level of $3.443 shortly on Friday trading session, however, is ending the week modestly lower, at $3.432. The all time highest level stays close to current levels at $3.497, reached April 22nd this year. Analysts from Goldman Sachs revised their forecast for the price of gold to $3.700 at the end of this year, and $4K for the next year. The rationale for a revision was a strong demand for gold coming from central banks.
The RSI took the uptrend during the week, ending it at the level of 61 on Friday. At this moment on charts, it seems like investors are eyeing the overbought market side for one more time. The MA50 continues to be the supporting line for the price of gold. Both MA50 and MA200 continue to move as two parallel lines with an uptrend, without an indication that the course might be changed anytime soon.
As long as geopolitical tensions are making investors unrest, the price of gold will head toward the upside. The uncertainty is driving the demand for safe-haven assets. However, charts are pointing to the possibility of a short term reversal for the price of gold. It should not expect some significant reversal, but rather till the level of $3.380. Also, the current level at $3.430 is the one to watch, considering that the same highs gold reached at the beginning of May and around 20th of April this year. In case that current level is pushed toward the upside, then it should be expected that the price of gold will reach a new all time highest level in the coming period. It should also be considered that the FOMC meeting is scheduled for Wednesday, next week, which might imply some higher volatility. It is not expected that the Fed will cut interest rates, but investors are set to hear the Feds view on macroeconomic projections.

BUYS ON XAUUSD🧠 Current Context on Daily (1D):
🔸 Price is currently in a clear short-term bearish structure following a Break of Structure (BOS).
🔸 It’s dropping towards a zone where a bullish order block begins, around the 75%-100% Fibonacci retracement.
📌 The 50 EMA on the daily chart (around 3,281) is still below price, indicating the overall macro trend remains bullish, but the current move is a healthy bearish correction.
📉 What to expect in the next few hours/days:
🔻 Scenario 1 – Continuation of the drop (likely in the short term):
Price could continue falling toward:
75% retracement zone (~3,339)
100% retracement zone (~3,302), which aligns with a previous demand zone and is close to the 50 EMA
✅ In that area, we could expect:
Mitigation of the daily OB
Bullish reaction if there's a liquidity sweep or confirmation on H4/H1
📈 Scenario 2 – Reversal from current level (less likely without confirmation):
Price is close to the 71% Fib level, so a small bounce may occur, but without liquidity being taken or clear reversal signals, it’s likely to be weak or temporary.
🔥 Conclusion:
It's not yet time to buy impulsively. The price is dropping in an orderly fashion and hasn’t reached a key liquidity zone or the 50 EMA.
👉 Wait for price to reach the 3,339 – 3,302 zone and show PA (price action) confirmation of a reversal.
That could offer a high-probability long opportunity.

XAUUSD: That is the most effective buy entry.Gold is practically neutral on its 1D technical outlook (RSI = 55.335, MACD = 29.660, ADX = 20.560), consolidating above its 4H MA50 since yesterday. The HL on the Channel Up has been priced under the 4H MA50, the latest one just under the 0.618 Fibonacci retracement level. That is the most efficient level to buy again and target the top of the Channel Up (TP = 3,500) not more than +4.78%, which was the previous bullish wave.
See how our prior idea has worked out:
## If you like our free content follow our profile to get more daily ideas. ##
## Comments and likes are greatly appreciated. ##

Bears under strong pressure, gold price adjusted⭐️GOLDEN INFORMATION:
Gold prices (XAU/USD) saw a modest rebound during Thursday’s Asian session, recovering part of the prior day’s decline and stabilizing around the $3,362–$3,363 zone, marking the weekly low. Lingering trade uncertainties and escalating geopolitical tensions in the Middle East continue to weigh on global risk sentiment, supporting demand for the safe-haven metal.
Meanwhile, the U.S. Federal Reserve concluded its two-day policy meeting on Wednesday by holding interest rates steady, while signaling a more cautious approach to future rate cuts. This shift, driven in part by concerns that President Donald Trump’s tariff policies could fuel inflation, boosted the U.S. Dollar to its highest level in over a week. The resulting Dollar strength is capping gold’s upside momentum, keeping the metal below the $3,400 threshold and prompting investors to remain cautious.
⭐️Personal comments NOVA:
Bears continue to put selling pressure on gold prices. Accumulating below 3400.
⭐️SET UP GOLD PRICE:
🔥SELL GOLD zone: 3414- 3416 SL 3421
TP1: $3402
TP2: $3390
TP3: $3376
🔥BUY GOLD zone: $3347-$3345 SL $3340
TP1: $3355
TP2: $3368
TP3: $3380
⭐️Technical analysis:
Based on technical indicators EMA 34, EMA89 and support resistance areas to set up a reasonable BUY order.
⭐️NOTE:
Note: Nova wishes traders to manage their capital well
- take the number of lots that match your capital
- Takeprofit equal to 4-6% of capital account
- Stoplose equal to 2-3% of capital account


XAUUSD 4H Analysis – Key SMC Levels in PlayPrice has been respecting market structure with multiple Breaks of Structure (BoS) and a confirmed Change of Character (ChoCh) from bearish to bullish. After sweeping a Buy Side Liquidity (BSL) and reacting off an Order Block (OB), price is currently consolidating above a bullish OB.
We're now at a decision point :
Bullish Scenario : If price holds this OB and shows a clear intent to push higher, we could target the previous highs near 3420+.
Bearish Scenario : If the OB fails and we get a clean break below the structure, I'm eyeing the next OB + FVG zone around 3315–3303 as the next point of interest.
Price action inside this range will confirm the next move. Keep an eye on rejections and reaction from the OB zone to decide entry.
🧠 Marked levels :
OBs, FVGs, BSL, IDM block
Key structural breaks (BoS, ChoCh)
Bias remains neutral-to-bullish until OB fails
📌 Wait for confirmation before entry – patience is profit.
#XAUUSD #SmartMoneyConcepts #OrderBlock #GoldAnalysis #BreakOfStructure

Gold Distribution I missed the perfect entry for this distribution model, but since the technical target hasn't been reached yet, I'll look for valid entries if they arise. The time displacement is good, it swept internal liquidity and left more to the downside. It looks more like a trend than a range deviation, so I'll be cautious with this trade if I take it.
