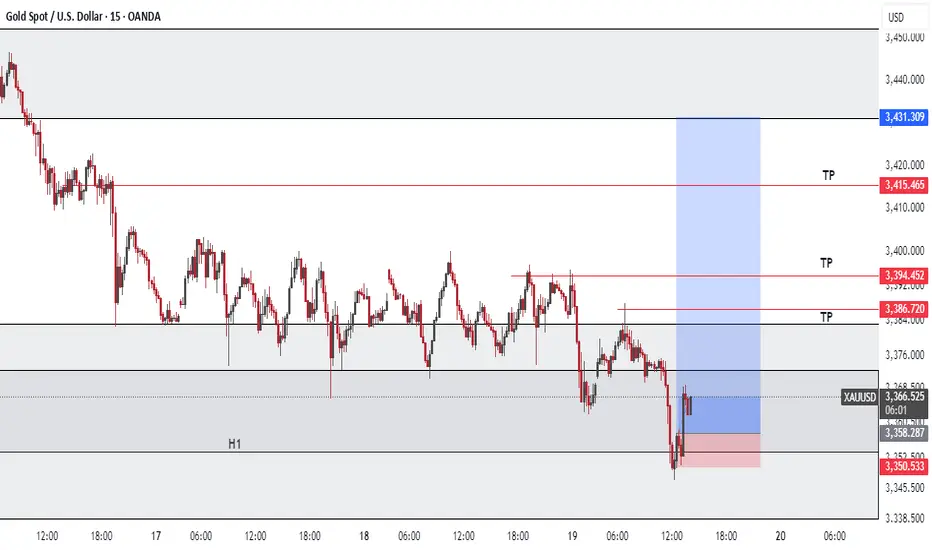
Gold Distribution I missed the perfect entry for this distribution model, but since the technical target hasn't been reached yet, I'll look for valid entries if they arise. The time displacement is good, it swept internal liquidity and left more to the downside. It looks more like a trend than a range deviation, so I'll be cautious with this trade if I take it.
GOLDMINICFD trade ideas

XAU/USD Smart Money Setup | Daily Demand Holding SeenForex | ICT-Based Analysis
Gold (XAU/USD) is respecting the Daily Demand Zone after forming a clean sweep of short-term liquidity ($$$).
Price is showing signs of potential reversal after mitigation of demand and may target the ATH liquidity above.
Key Observations:
- Daily Demand Zone tested & holding.
- Short-term liquidity ($$$) taken below recent lows.
- FVG + Break in structure expected for confirmation.
- Possible move toward $3,500 ATH area if bullish order flow continues.
- Rejection zone: $3,370–$3,395 (Short-term supply).
💡 Patience is key. Wait for clear bullish confirmation before execution.
Strategy: ICT Smart Money | Liquidity Sweep | Order Block | BOS | FVG
Analyst: SeenForex
Date: June 19, 2025
#Gold #XAUUSD #SmartMoney #ICT #ForexAnalysis #OrderBlock #SeenForex #LiquiditySweep #FVG #TechnicalAnalysis #TradingViewIdeas
📈 Follow for more Smart Money setups – SeenForex 🔔

XAUUSD 4H Analysis – Key SMC Levels in PlayPrice has been respecting market structure with multiple Breaks of Structure (BoS) and a confirmed Change of Character (ChoCh) from bearish to bullish. After sweeping a Buy Side Liquidity (BSL) and reacting off an Order Block (OB), price is currently consolidating above a bullish OB.
We're now at a decision point :
Bullish Scenario : If price holds this OB and shows a clear intent to push higher, we could target the previous highs near 3420+.
Bearish Scenario : If the OB fails and we get a clean break below the structure, I'm eyeing the next OB + FVG zone around 3315–3303 as the next point of interest.
Price action inside this range will confirm the next move. Keep an eye on rejections and reaction from the OB zone to decide entry.
🧠 Marked levels :
OBs, FVGs, BSL, IDM block
Key structural breaks (BoS, ChoCh)
Bias remains neutral-to-bullish until OB fails
📌 Wait for confirmation before entry – patience is profit.
#XAUUSD #SmartMoneyConcepts #OrderBlock #GoldAnalysis #BreakOfStructure

Gold Buy- Go for buy if you got entry setup
- Refine entry with smaller SL for better RR, if your strategy allow
A Message To Traders:
I’ll be sharing high-quality trade setups for a period time. No bullshit, no fluff, no complicated nonsense — just real, actionable forecast the algorithm is executing. If you’re struggling with trading and desperate for better results, follow my posts closely.
Check out my previously posted setups and forecasts — you’ll be amazed by the high accuracy of the results.
"I Found the Code. I Trust the Algo. Believe Me, That’s It."

Long XAUUSDCentral banks are still buying gold and we got risk off sentiment from Israel/Iran war. Demand for gold is still high. We are on a pullback since it is a very crowded trade+ Trump giving Iran 2 weeks for a deal + the Fed not cutting rate since they are waiting on inflation data to see if those numbers rise.
A few investment banks see gold hitting 3500 before year end.
Technically (which is 20% of the reason why I am looking at gold long) we got last leg 78.6 fib+ 50 Daily MA + H4 200 MA + bigger time frame 38.2 fib
3325 will be the zone I will look to get in... if we get there.
Trump might just attack Iran during the weekend and we get a market open gap on gold... who knows..
Good luck and happy trading!

XAU/USD – Technical AnalysisThe chart reflects a sustained bearish phase within a well-defined descending channel, yet current price action suggests a potential trend shift may be underway.
🧠 Key Observations:
Price Compression Near Channel Support:
The market is testing the lower boundary of the descending channel, indicating possible exhaustion of selling momentum.
Ichimoku Cloud Analysis:
Price remains below the cloud, confirming bearish structure for now. However, cloud thinning ahead signals a weakening trend, which often precedes a reversal.
Projected Recovery Path:
A forecasted move is highlighted, suggesting a break above $3,360–$3,380, targeting the upper cloud resistance near $3,400. This level aligns with prior structure and volume interest.
Volume Profile (left):
Strong volume nodes align with support zones, reinforcing the potential for a bounce if momentum shifts.
📌 Strategy Insight:
While bearish momentum remains in control, signs of stabilization and potential reversal are emerging. Traders should wait for:
A confirmed break above the cloud, or
A bullish engulfing with volume support to validate long entries.
✅ Summary:
Trend remains bearish, but the setup shows early signs of accumulation and reversal. A breakout from the cloud and descending channel could trigger a shift toward $3,400+ in the near term. Monitoring phase active.

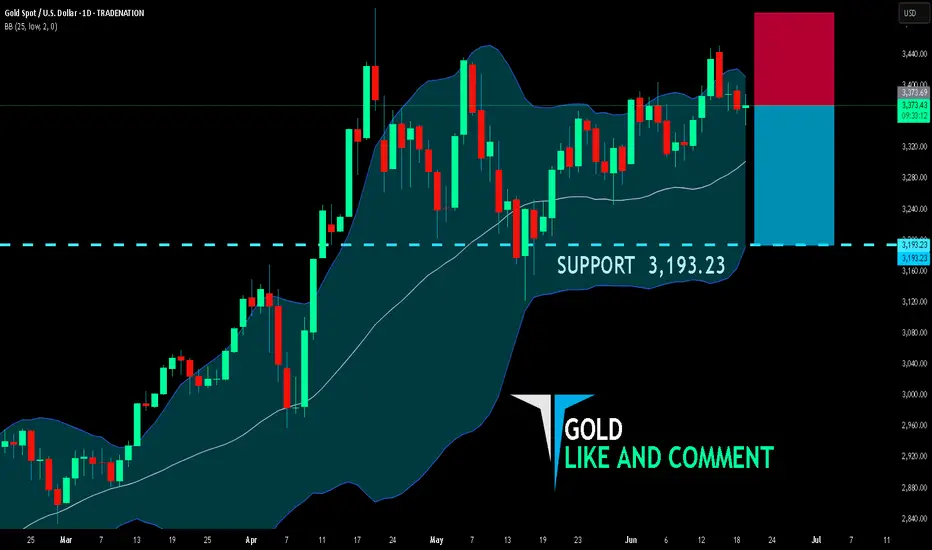
GOLD BEARISH BIAS RIGHT NOW| SHORT
GOLD SIGNAL
Trade Direction: short
Entry Level: 3,373.69
Target Level: 3,193.23
Stop Loss: 3,493.66
RISK PROFILE
Risk level: medium
Suggested risk: 1%
Timeframe: 1D
Disclosure: I am part of Trade Nation's Influencer program and receive a monthly fee for using their TradingView charts in my analysis.
✅LIKE AND COMMENT MY IDEAS✅
XAUUSD FULL DAILY OUTLOOK — 16 JUNE 2025👋 Hello traders, welcome to a key week for gold.
The bullish expansion continues to unfold cleanly, following weeks of calculated breakout sequences.
After liquidating major liquidity pockets below 3120 earlier this year, gold shifted into controlled higher timeframe expansion.
The breakout above May’s consolidation confirms full bullish structure control. However, we are now entering premium exhaustion territory, where liquidity traps become increasingly dangerous for emotional traders.
This is where most fail — chasing late breakouts — but we stay patient and execute only inside clean zones.
🔎 STRUCTURE PROGRESSION
✅ Weekly BOS fully confirmed → higher timeframe bullish structure intact.
✅ Daily has printed higher lows at 3120 → 3246, leading to the recent higher high at 3448.
✅ Price is now extended into premium expansion.
✅ EMA 5/21/50 fully locked bullish — trend continuation bias.
✅ RSI remains firm but near extended levels.
✅ Fibonacci extensions above are now fully in play.
🎯 DAILY BIAS — 16 JUNE 2025
Primary bias remains bullish as long as price holds above 3355 structure.
Price sits inside premium expansion, where liquidity traps may unfold near 3448–3505.
Controlled pullbacks into 3405–3385 remain healthy for continuation, while deeper dips into 3325 open better risk-reward positioning.
Bullish continuation remains the base case, but aggressive premium sweeps before FOMC remain highly probable.
🔼 DAILY SUPPLY ZONES
Price Zone Context
3448 – 3460 Breakout premium supply (first liquidity trap zone)
3500 – 3505 1.272 Fibonacci extension — major liquidity pocket
3570 – 3575 1.618 Fibonacci extension — exhaustion premium trap
🔽 DAILY DEMAND ZONES
Price Zone Context
3405 – 3385 Shallow pullback liquidity zone
3355 – 3325 Main Daily OB demand — structure protection
3290 – 3255 Deep flush zone — extreme HL recalibration zone
⚠ THE BATTLE THIS WEEK
✅ Price may attempt premium sweeps above 3448 → 3505 before any deeper correction.
✅ Below 3385 lies the first reactive zone for controlled pullbacks.
✅ FOMC remains the dominant macro driver — liquidity will likely front-run into Wednesday.
✅ Patience is key — the market may trigger both traps before any clear directional expansion unfolds.
🔐 Mindset Reminder:
In premium we don't chase — we wait for the market to exhaust liquidity and show real intent.
Our job is not to predict reversals, but to execute once liquidity confirms displacement.
🚀 If this helped you build your map for the week, hit that 🚀, drop your thoughts below, follow for full sniper insights.
We trade clean. We execute precise.
— GoldFxMinds

XAUUSD likely to reach level 3292XAUUSD is currently consolidating the liquidity levels. XAUUSD is likely to reach level 3292 as it is one of the liquidity levels.

Middle East tensions rise; gold may hit new highs next weekThe Middle East situation has continued to escalate over the weekend, indicating that gold may witness a rally at Monday's opening. On Friday morning, risk aversion surged rapidly, pushing the gold price to around 3,444, followed by a pullback. During the European session, the price quickly retreated to around 3,408 before rebounding—our strategy to go long near 3,410 at the time proved profitable. In the U.S. session, gold mounted a second rally, peaking at around 3,446 before entering a pullback and consolidation phase. However, from a fundamental perspective, the overall trend remains bullish; thus, buying on dips remains the primary trading approach.
From a 4-hour technical view, immediate support lies in the 3,405–15 range, with key support at the recent resistance-turned-support zone near 3,375–80. When gold pulls back, traders should focus on longing near these levels. The critical bullish pivot for short-term traders has shifted up to the 3,345–50 zone; as long as gold holds above this level on the daily time frame, the dip-buying strategy should be maintained.
XAUUSD
buy@3405-3415
tp:3340-3360
Investment itself is not the source of risk; it is only when investment behavior escapes rational control that risks lie in wait. In the trading process, always bear in mind that restraining impulsiveness is the primary criterion for success. I share trading signals daily, and all signals have been accurate without error for a full month. Regardless of your past profits or losses, with my assistance, you have the hope to achieve a breakthrough in your investment.

XAUUSD: Market Analysis and Strategy for June 19Gold technical analysis
Daily chart resistance 3450, support below 3338
Four-hour chart resistance 3400, support below 3338
One-hour chart resistance 3375, support below 3350
Fundamentally, the geopolitical situation has eased. The market was affected by the Fed's decision this week to keep interest rates unchanged and not cut interest rates, which weakened the bullish momentum and buyers took profits, leading to a decline.
From the current trend analysis, the support below focuses on the four-hour level 3338 and the one-hour level 3350 support. The upper pressure focuses on the suppression near the daily level 3450, and the short-term long-short strength and weakness dividing line 3400. Keep the high-selling and low-buying range operation during the day.
Sell: 3375near SL: 3380
Sell: 3350near SL: 3355
Buy: 3338near SL: 3333

Range-bound Trading amid Geopolitical and Policy GamesGold Market Brief: Range Bound Trading Amid Geopolitical and Policy Games
I. Core Drivers
- Geopolitical Hedge Cooling: Iran's signal to restart nuclear talks has weakened risk aversion, triggering intraday gold pullbacks, though Middle East tensions remain a wild card.
- Fed Policy Expectations: The Fed kept rates unchanged this week, with Powell's "data-dependent" stance fueling 60% odds of a September rate cut. Dovish signals may push gold above $3,400, while hawkish cues could drag it to $3,350.
II. Key Technical Levels
Supports:
- $3,380: 4-hour MA30 + June 17 low ($3,375.5), bolstered by the ascending channel lower 轨 (lower trendline).
- $3,350: Daily MA10 + June 12 congestion zone, a psychological pivot for policy betting.
Resistances:
- $3,400: Intraday high + 4-hour MA10 + descending trendline forming "triple resistance".
- $3,450: June 13 high converging with weekly Fibonacci 61.8% retracement ($3,448).
III. Short-term Outlook & Focus Points
- Range-bound Trend: Gold likely to oscillate between $3,350-$3,450, with breakthroughs hinging on escalated geopolitics or stronger rate cut bets.
- Catalyst Events: Monitor June 19 Fed meeting, June 21 CPI data, and Middle East developments as potential range breakers.
XAU/USD Trading Strategy for Today
buy@3370-3380
tp:3395-3405
sell@3395-3405
tp:3385-3375
I am committed to sharing trading signals every day. Among them, real-time signals will be flexibly pushed according to market dynamics. All the signals sent out last week accurately matched the market trends, helping numerous traders achieve substantial profits. Regardless of your previous investment performance, I believe that with the support of my professional strategies and timely signals, I will surely be able to assist you in breaking through investment bottlenecks and achieving new breakthroughs in the trading field.

Gold 4H – Into the Golden Pocket, Next Move Loading?After our last successful setup, here's how I'm looking at Gold now:
Price is approaching a confluence zone that includes:
- A 4H FVG (Fair Value Gap)
- 0.618–0.786 fib retracement
- Strong trendline support
- 1D imbalance zone
I’m watching for a reaction from this golden pocket to catch the next potential impulsive leg toward the 3,450–3,500 region. If we see a rejection wick and break of short-term structure, it could be game on for bulls. If this zone breaks clean, we reassess at the 1.0 fib near 3,323.
Patience is key — let the market come to you.

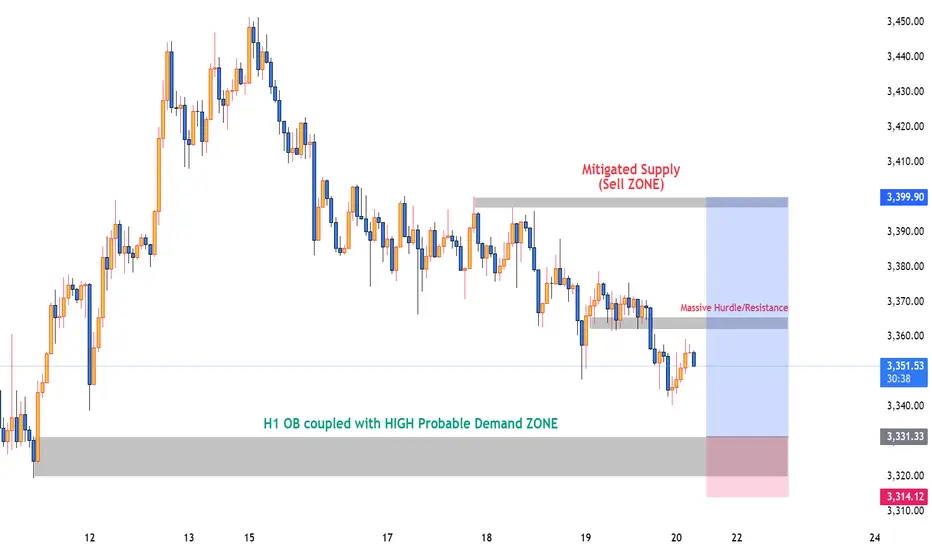
Gold XAUUSD Possible Move🚨 Trade Setup Alert
📍 H1 Orderblock Zone at 3330–3320
🔑 High-probability BUY setup after liquidity sweep 🟢
🎯 Target: 3362 and possibly 3396+
🛑 SL below 3315
📍 Mitigated Supply Zone at 3396–3400
🔻 Possible SELL setup if price rejects that level 🔴
🎯 Target: 3365 / 3340
🛑 SL above 3412
⚠️ Key Level: 3362–3365 must break to reach upper supply zone.
✅ A level viz. 3340 shared yesterday, I bought from 3340 and bagged +180 pips 💸
👀 Watch price action closely near these zones for confirmation.
📊 Trade with proper risk management! 💼
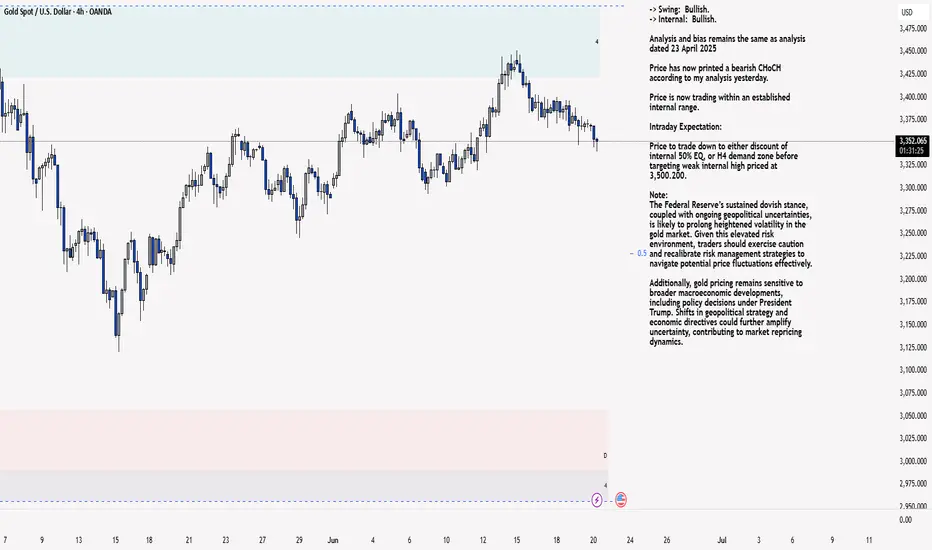
XAU/USD 20 June 2025 Intraday AnalysisH4 Analysis:
-> Swing: Bullish.
-> Internal: Bullish.
Analysis and bias remains the same as analysis dated 23 April 2025
Price has now printed a bearish CHoCH according to my analysis yesterday.
Price is now trading within an established internal range.
Intraday Expectation:
Price to trade down to either discount of internal 50% EQ, or H4 demand zone before targeting weak internal high priced at 3,500.200.
Note:
The Federal Reserve’s sustained dovish stance, coupled with ongoing geopolitical uncertainties, is likely to prolong heightened volatility in the gold market. Given this elevated risk environment, traders should exercise caution and recalibrate risk management strategies to navigate potential price fluctuations effectively.
Additionally, gold pricing remains sensitive to broader macroeconomic developments, including policy decisions under President Trump. Shifts in geopolitical strategy and economic directives could further amplify uncertainty, contributing to market repricing dynamics.
H4 Chart:
M15 Analysis:
-> Swing: Bullish.
-> Internal: Bullish.
Following previous high, and printing of bearish CHoCH, price has pulled back to an M15 supply zone, where we are currently seeing a reaction. Therefore, I shall now confirm internal high.
Price is now trading within an established internal range.
The remainder of my analysis shall remain the same as analysis dated 13 June 2025, apart from target price.
As per my analysis dated 22 May 2025 whereby I mentioned price can be seen to be reacting at discount of 50% EQ on H4 timeframe, therefore, it is a viable alternative that price could potentially print a bullish iBOS on M15 timeframe despite internal structure being bearish.
Price has printed a bullish iBOS followed by a bearish CHoCH, which indicates, but does not confirm, bearish pullback phase initiation. I will however continue to monitor, with respect to depth of pullback.
Intraday Expectation:
Price to continue bearish, react at either M15 supply zone, or discount of 50% internal EQ before targeting weak internal high priced at 3,451.375.
Note:
Gold remains highly volatile amid the Federal Reserve's continued dovish stance, persistent and escalating geopolitical uncertainties. Traders should implement robust risk management strategies and remain vigilant, as price swings may become more pronounced in this elevated volatility environment.
Additionally, President Trump’s recent tariff announcements are expected to further amplify market turbulence, potentially triggering sharp price fluctuations and whipsaws.
M15 Chart:
XAU/USD: Gold's Critical Decision Point! FOR JUNE 06, 2025 📊 CURRENT SNAPSHOT
---
🎯 THE SETUP: "Golden Triangle Breakout"
Gold is sitting at a CRITICAL JUNCTURE - trapped between major support and resistance levels, forming what I call the "Golden Pressure Cooker" pattern.
🔍 KEY LEVELS TO WATCH
🔴 RESISTANCE ZONE (The Ceiling)
* LWH (Last Week High): \$3,403.55 - Ultimate target
* LWL (Last Week Low): \$3,297.94 - Immediate resistance
* 4H FVG: \$3,350 area - Major supply zone
🟡 CURRENT BATTLEFIELD
* Price Action: Consolidating in tight range
* PWL (Previous Week Low): \$3,245.28 - Key pivot
🔴 DANGER ZONE (The Floor)
* DIE ZONE: \$3,121.70 - Critical support
* Break below = Major bearish signal
---
📈 MARKET STRUCTURE ANALYSIS
What the Chart is Telling Us:
1. 📊 Consolidation Phase: Gold has been ranging for several sessions
2. ⚡ 4H FVG Above: Acting as a magnet for price
3. 🎯 Triple Test: Price respecting the PWL level multiple times
4. 📉 Volume Decline: Typical before major moves
---
🚀 TRADING SCENARIOS
SCENARIO 1: "Golden Rocket" 🚀 (BULLISH)
IF price breaks above \$3,297.94 (LWL):
* Target 1: \$3,330- +1.2% gain
* Target 2: \$3,350(FVG) - +3.9% gain
* Stop Loss: \$3,280 - Risk: -0.5%
Risk/Reward: 1:1.8 ⭐⭐⭐
SCENARIO 2: "Golden Avalanche" 📉 (BEARISH)
IF price breaks below \$3,245.28 (PWL):
* Target 1: \$3,200 (Psychological level)
* Target 2: \$3,121.70 (Die Zone)
* Stop Loss: \$3,297.94 (LWL)
---
💡 SIMPLE TRADING PLAN
🎯 FOR BULLS (Buy Setup):
```
ENTRY: Break above $3,298 with volume
STOP: $3,285
TARGET 1: $3,330
TARGET 2: $3,360
🎯 FOR BEARS (Sell Setup):
```
ENTRY: Break below $3,245 with volume
STOP: $3,298 (LWL)
TARGET 1: $3,200
TARGET 2: $3,122 (Die Zone)
---
⚠️ RISK MANAGEMENT RULES
1. Position Size: Risk only 1-2% of account
2. Wait for Confirmation: Don't jump early
3. Volume is Key: Breakouts need volume
4. Time Limit: Close if no movement in 2 days
---
🔥 WHY THIS SETUP MATTERS
Gold is at a crossroads! The tight consolidation suggests big players are accumulating positions. When this range breaks, expect explosive movement in either direction.
Smart Money Clues:
* Multiple tests of PWL = Strong support
* 4H FVG above = Price magnet effect
* Low volume = Calm before the storm
---
📊 MARKET CONTEXT
* Dollar Weakness: Could fuel gold rally
* Economic Uncertainty: Safe haven demand
* Technical Setup: Clean breakout pattern
* Timeframe: Perfect for swing trades
---
🎯 MY VERDICT
Gold is COILED and ready to EXPLODE!
The setup favors the bullish scenario due to:
✅ Strong support holding at PWL
✅ 4H FVG acting as price magnet
✅ Multiple failed attempts to break lower
✅ Overall uptrend structure intact
But remember: Respect the levels and trade the breakout, not your bias!
---
🚨 ACTION ITEMS
1. Set Alerts: \$3,298 (bull trigger) & \$3,245 (bear trigger)
2. Watch Volume: Breakouts need confirmation
3. Be Patient: Wait for clean breaks
4. Have Both Plans: Ready for either direction
---
Trade Smart, Stay Safe! 🥇💰
The market rewards patience and punishes impatience.

Lingrid | GOLD corrective Pullback Presents Potential Long EntryOANDA:XAUUSD is retracing from a double top inside the resistance area near 3450 but remains above the key 3375 support and the ascending channel structure. Price is testing the confluence of the upward trendline and prior breakout level, creating a possible bullish rebound setup. A successful bounce here could ignite momentum toward the 3450–3470 zone.
📈 Key Levels
Buy zone: 3370–3375
Sell trigger: loss of 3360 support
Target: 3450
Buy trigger: breakout above 3400 and hold with strong candle close
💡 Risks
A close below the upward channel could trigger deeper sell-off
Failure to reclaim 3400 may trap bulls in consolidation
Macro catalysts (Fed, CPI) could override local structure
Traders, if you liked this idea or if you have your own opinion about it, write in the comments. I will be glad 👩💻

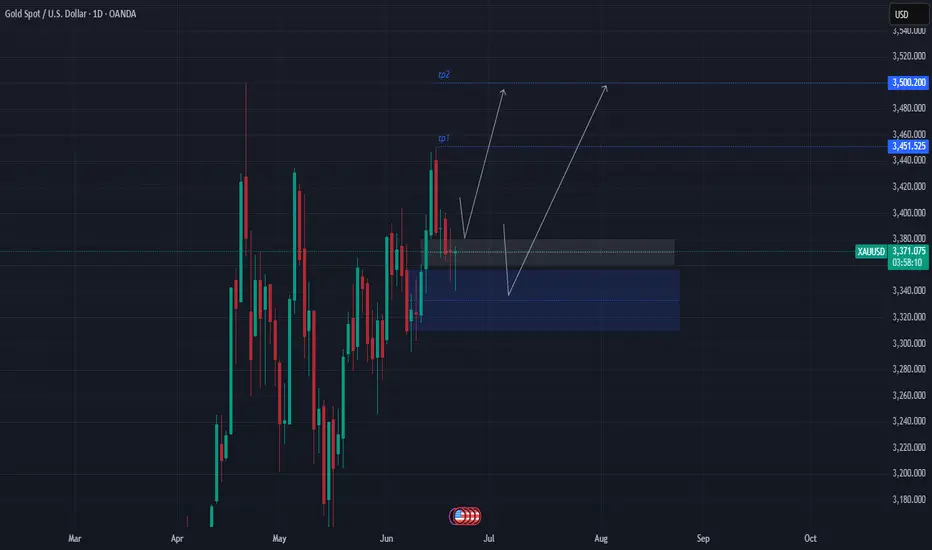
riseAs we expected.it fell to our areas of interest.We expected upcoming upward targets,the first target being 3451
Analysis of the Short-Term Downtrend in Spot Gold Prices AgainstBased on the attached chart and extracted text information, here is a graphical analysis and trend determination of the spot gold price against the US dollar (Gold Spot / US Dollar).
Trend Analysis:
- General Trend: Based on the available data, there appears to be a short-term downtrend. The decline in price and confirmation of selling levels indicate strong selling pressure. However, this trend must be confirmed using other technical indicators.
- Price Range: The chart indicates a broad price range between approximately $3,000 and $3,500 over the past several months. This indicates significant volatility in the price of gold.
Support and Resistance Levels:
- Support Levels:
- The $3,219.944 level represents an important support level.
- The $3,100 and $3,000 levels may also act as support levels if the downtrend continues.
- Resistance Levels:
- The $3,353.820 level (the current buy level) could act as an immediate resistance level.
- Higher levels in the $3,400-$3,500 range represent potential resistance levels if the trend reverses.
- Monitoring Support Levels: The aforementioned support levels should be monitored to identify potential buying points in case of a bounce.
Based on the available data, there is a short-term downward trend in the spot gold price against the US dollar, starting from these areas:
- Entry price of the deal: $3,355.00
- Stop loss price for the trade: $3,381.00
- Target price for the deal TP1: $3,320.00
- Target price for the deal TP2: $3,280.00
- Target price for the deal TP3: $3,219.00

XAUUSD BuyHere the price has come to our zone and given the perfect rejection with decreased sell side momentum so we enter buy from the setup .
Please support and follow to cheer me up .
Thank you !
XAUUSD EXPECTATIONS UPSIDE MOVES🔍 Key Observations:
1. Current Price: 3353
2. Previous Demand Zone / Order Block:
The area between 3347–3354 is a clear H4 order block/demand zone, which price has tapped multiple times and is currently reacting from.
3. Support Confirmation:
This zone has acted as a support multiple times in the past.
Price wicked below it but immediately pushed back above → indicating buyer interest.
4. Market Structure:
Price made a higher high near 3445.
Now it's making a retracement or pullback into the order block zone.
If this zone holds, we could see a reversal to the upside.
---
🔮 Expectations:
If 3347–3354 holds:
Expect a bounce back up toward 3375, 3400, and possibly 3440+.

Beyond the Headlines - Gold Outlook June 16-20, 2025Beyond the Headlines: Gold's Ascent Amidst Global Shifts & Key Technicals 🌐🚀
Everything about the last week can be found here:
OANDA:XAUUSD 💰📈
We all know what's going on, I believe. Israel struck Iran 💥, and this conflict will likely take a bit before things cool down. 🥶
---
## Geopolitical News Landscape 🌍📰
### Israel / Iran
Since June 12, Israel launched "Operation Rising Lion," targeting Iranian nuclear sites like Natanz and Esfahan – over 128 killed, Iran claims. 🇮🇷 retaliated with missile and drone strikes on Haifa and Tel Aviv, killing at least 10. 🚀
**Outlook:** 🔥 Tensions are spiraling. Without urgent mediation, full-scale regional war remains a real risk. 💣
### India / Pakistan
Since the May ceasefire, few clashes have occurred. However, both navies increased readiness, signaling potential escalation at sea. 🚢
**Outlook:** ⚖️ Peace is fragile. A strategic dialogue is key to avoiding a renewed border or maritime conflict. 🙏
### Gaza Conflict
Between June 7–15, Israeli strikes killed at least 41 Palestinians, including 8 near an aid center in Rafah. Over 55,000 total deaths, and famine is looming. 💔
**Outlook:** 🆘 Gaza remains a humanitarian catastrophe. Global pressure for access and a ceasefire must intensify. 🕊️
### Russia / Ukraine
June 13–15: Russia returned the bodies of 1,200 Ukrainian soldiers in a rare POW swap gesture. 🤝 Fighting remains intense in Sumy and Toretsk; Russia hit a major oil refinery. 🏭
**Outlook:** 🕊️ While symbolic moves continue, no peace is in sight – battlefield outcomes will shape diplomacy. ⚔️
### U.S. - China Trade War
The U.S. hiked tariffs to 55% on key Chinese goods. 🇺🇸🇨🇳 responded with 10% on U.S. imports. Talks yielded a partial truce, but military-use rare earths remain unresolved. 💻
**Outlook:** 🔧 Tech remains the battleground. Without progress on critical materials, the trade war may deepen. 📉
### Global Trade War
The OECD revised global growth downward due to rising tariffs from the U.S. targeting 🇨🇳, 🇲🇽, 🇨🇦. Global trade volume is expected to shrink by 0.2–1.5%. 📉
**Outlook:** ⛓️ Supply chain disruption is spreading. Global trade will stay under pressure without coordinated policy. 🌍➡️🌍
### Trump vs. Powell
Trump labeled Powell a "numbskull" for not cutting rates, suggesting he might "force something" if re-elected. 🗳️ The Fed maintains policy independence ahead of a critical June decision. 🏛️
**Outlook:** ⚔️ Political pressure on the Fed is mounting. Expect more friction as the election cycle heats up. 🔥
### U.S. Inflation
CPI rose 2.4% YoY in May (from 2.3%); Core CPI held steady at 2.8%. Monthly growth was modest at 0.1%. Key rises were seen in healthcare and vehicle prices. 🚗🏥
**Outlook:** Inflation is stable but sticky. 🚦 The Fed will likely hold rates steady until clearer disinflation signals appear. 📊
---
## Technical View 📐📈
### Market Structure:
Gold shows a clear **bullish market structure** with higher highs and higher lows. ⬆️ Recent price action suggests we're in a strong uptrend with institutional buying pressure. 🏦
### Key Levels:
* The chart shows a significant low around the **$3,245 area** (marked as "Low") which could act as a key institutional support level. 💪
* The current high near **$3,446** represents a potential institutional resistance zone. 🛑
* Look for potential **order blocks** around the **$3,380-$3,400 range** where price consolidated before the recent breakout. 🧱
### Fair Value Gaps (FVG):
There appear to be several gaps in the price action during volatile moves, particularly during strong rally phases. These could act as future support/resistance areas. 📉📈
### Gann Analysis:
The price movement shows strong adherence to Gann principles:
* The rally from the low follows a steep angle, suggesting strong momentum. 🚀
* Key Gann angles would place support around the **$3,300-$3,320 zone**. 📐
* The current price near **$3,436** is testing natural resistance levels based on Gann square calculations. 📏
### Fibonacci Levels:
From the significant swing low to the current high:
* 23.6% retracement: ~$3,395 📉
* 38.2% retracement: ~$3,370 📉
* 50% retracement: ~$3,345 📉
* 61.8% retracement: ~$3,320 📉
The golden ratio levels suggest key support on any pullback would be around the **$3,370-$3,345 zone**. ✨
### Institutional Levels:
* **Weekly/Monthly Levels:** The **$3,400** and **$3,450** areas appear to be significant institutional levels based on round numbers and previous price action. 🏦💰
* **Smart Money:** The accumulation pattern before the breakout suggests institutional participation. 🧠💡
### Cycle Timing:
Based on the timeframe (appears to be 30-minute bars from May 26-June 15):
* We're seeing approximately **3-week cycles** in the major moves. 🗓️
* The current rally phase appears to be in its mature stage. 🌳
* The next potential cycle turn could be approaching, suggesting caution for new longs at current levels. ⚠️
---
### Trading Considerations:
* Watch for rejection at current levels near **$3,446**. 📉
* Key support confluence around **$3,370-$3,345** for potential re-entry. 🎯
* Volume and momentum divergences would be critical for timing any reversal. 📊🔄
Other indicators tend to show bullish scenario enhancements. 🚀
Gold has formed a ** Standard Bullish Flag pattern ** over a time from early April till today. 🚩🐂
Also, the structure of a ** reverse Head & Shoulders ** is existing and has broken the neckline! 🔄🗣️
Another indicator is an existing "** Ascending Bull Flag **." ⬆️🚩
Please take the time to let me know what you think about this. 💬
-------------------------------------------------------------------------
This is just my personal market idea and not financial advice! 📢 Trading gold and other financial instruments carries risks – only invest what you can afford to lose. Always do your own analysis, use solid risk management, and trade responsibly.
Good luck and safe trading! 🚀📊

XAU / USD 2 Hour ChartHello traders. So here we are at the end of the day and my chart did not need to be changed. We failied to break out above or below the current range that gold is trading in. Saying that, the chart is still valid for small scalp trade set ups. Maybe the overnight sessions will bring some direction. Either way, I will check back during the London session or when Pre NY volume starts tomorrow morning at about 7:30 am est here in the US. Big G gets a shout out. Be well and trade the trend. Let's see how things play out during the overnight sessions.
