Potential Gold LongWith Volatile Markets and constant War Developments
XAU/USD has experienced higher than NORMAL volatility.
Given price can RESPECT this short term trendline, we may have a Target of 3,500 in sight.
2 weeks of Bullish Momentum now followed by a beautiful retracement & Strong Wicks below.
SL - 3,355
TP 1 - 3,440
TP 2 - 3,470
TP 3 - 3,496
GOLDMINICFD trade ideas

GOLD: Short Signal with Entry/SL/TP
GOLD
- Classic bearish formation
- Our team expects fall
SUGGESTED TRADE:
Swing Trade
Sell GOLD
Entry Level - 3370.3
Sl - 3377.8
Tp - 3355.4
Our Risk - 1%
Start protection of your profits from lower levels
Disclosure: I am part of Trade Nation's Influencer program and receive a monthly fee for using their TradingView charts in my analysis.
❤️ Please, support our work with like & comment! ❤️

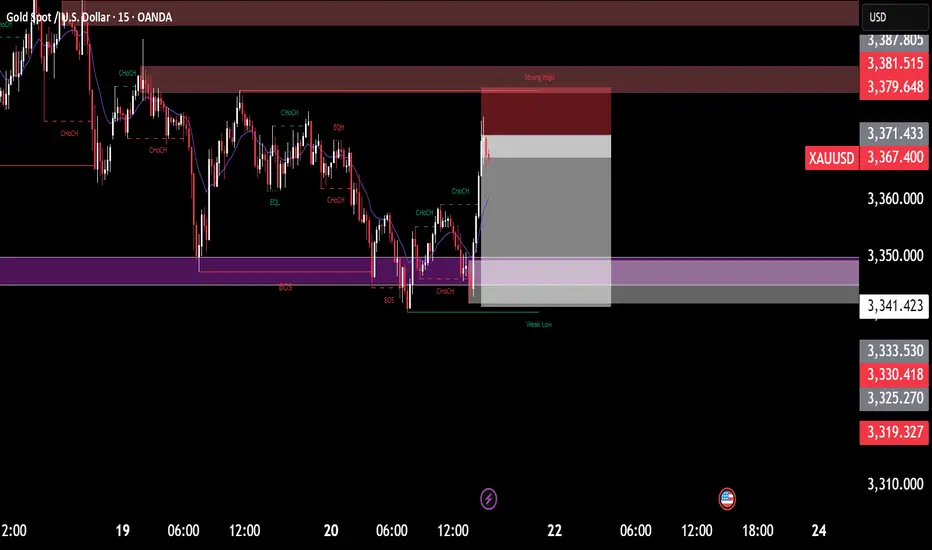
SELL NOW XAUUSD🕓 This setup is valid as long as price holds above the demand zone and continues forming higher lows.
XAUUSD: Trading Strategy for Technical Correction CycleThe morning strategy has realized profits, and the gold price has entered a technical correction cycle. From a technical perspective, gold prices were resisted near $3,380, with short-term moving averages forming suppression, and the RSI indicator falling back from overbought territory, indicating weakening bullish momentum and clear correction demand.
Core shorting range: $3,375 - $3,385
- When the price rebounds above $3,380 and falls back, with long upper shadows or bearish engulfing patterns appearing on K-lines;
- The 4-hour MACD confirms a bearish cross, and the green momentum bars start to expand.
First target: $3,360 - $3,365
- Supported by the middle (middle band) of the hourly Bollinger Bands.
Second target: $3,350 - $3,355
- Supported by the 5-day moving average on the daily chart, resonating with previous lows.
- Stop-loss level: $3,395 (10 USD above the previous high to control single-trade risk)
- Position management: It is recommended to use a 10% position. If the price hits the resistance at $3,385, positions can be built in batches (5% + 5%) to reduce the risk of chasing gains.
I am committed to sharing trading signals every day. Among them, real-time signals will be flexibly pushed according to market dynamics. All the signals sent out last week accurately matched the market trends, helping numerous traders achieve substantial profits. Regardless of your previous investment performance, I believe that with the support of my professional strategies and timely signals, I will surely be able to assist you in breaking through investment bottlenecks and achieving new breakthroughs in the trading field.

XAU/USD) Back support level Read The captionSMC trading point update
Technical analysis of XAU/USD (Gold Spot vs U.S. Dollar) – 2H Timeframe:
---
XAU/USD Bearish Rejection from Resistance – Short-Term Sell Setup
Key Observations:
1. Rejection from Upper Channel & Resistance Zone:
Price was rejected sharply after touching the upper boundary of the ascending channel and the newly established resistance zone (~3400–3420).
A strong bearish candle confirms selling pressure at the top.
2. Support Retest in Progress:
The price is currently descending toward the EMA 200 and the KYY support zone (approximately 3343–3348).
The previous bounce originated from this level, making it a significant retest zone.
3. EMA 200 as Confluence:
The 200 EMA (currently at 3346.92) aligns with the support zone, increasing the likelihood of a bounce or at least temporary pause in bearish momentum.
4. RSI Bearish Signal:
RSI has dropped below 50, confirming a momentum shift toward the downside.
Still above oversold territory, suggesting more downside room.
---
Trade Idea:
Bias: Bearish (Short-Term)
Entry Zone: Around 3390–3400 (confirmed rejection area)
Target Zone: 3348 – 3343 (KYY support + EMA 200)
Stop Loss: Above 3425 (just above resistance zone)
Mr SMC Trading point
---
Summary:
Gold has faced a clear rejection at a key resistance zone within an ascending channel, and is now targeting the EMA 200 and previous structural support. Short opportunities could be considered toward the 3343–3348 zone, with RSI and price action supporting the move.
Please support boost 🚀 this analysis)

XAUUSD GOLD TRADING STRADING June 20, 2025XAUUSD Gold Trading Strategy June 20, 2025:
Yesterday's trading session, gold prices failed to accumulate above the 3360 area. After the price broke the 3360 support area, a downtrend channel was formed on the H1 frame. However, the current war news still supports gold prices to increase due to investors' confidence. We still trade according to this downtrend channel and wait at support areas to be able to trade long term.
Important price areas today: 3325 - 3330, 3360 - 3365 and 3373 - 3378.
Today's trading trend: SELL.
Recommended orders:
Plan 1: SELL XAUUSD zone 3363 - 3365
SL 3368
TP 3360 - 3350 - 3340 - 3330.
Plan 2: SELL XAUUSD zone 3376 - 3378
SL 3381
TP 3373 - 3363 - 3353 - 3330.
Plan 3: BUY XAUUSD zone 3325 - 3327
SL 3322
TP 3330 - 3340 - 3370 - 3400.
Wish you a safe, favorable and profitable trading weekend.🌟🌟🌟🌟🌟

GOLD Sell Setup – Bearish Reversal from Supply ZoneGold (XAUUSD) is trading within a well-defined supply zone around the 3369 – 3370 area. After multiple failed attempts to break above this resistance, price is showing signs of reversal. The structure indicates a bearish move is likely, especially if the market sustains below the sell zone.
---
🔍 Technical Analysis:
Sell Zone: 3369 – 3370
The price has entered a strong resistance zone and is currently rejecting this level, indicating selling pressure.
Stop Loss: 3428.42
A break above this level would invalidate the bearish bias.
Take Profit Levels:
TP1: 3324.81
TP2: 3246.26
TP3: 3167.64
Target Zone: Around 3120, which aligns with a previous demand area on the chart.
Market Behavior:
The lower highs and resistance rejection pattern on the 4H chart suggests weakness in bullish momentum. If price breaks below the most recent support, it may trigger acceleration toward lower targets.
---
📌 Trade Plan:
Enter short positions around 3369
Set SL above 3428
Aim for stepwise profit-taking on each support break
Risk-to-reward ratio remains favorable with proper lot size
---
Conclusion:
Gold is respecting a critical resistance zone, and a bearish continuation is expected if price holds below it. Patience and confirmation on lower timeframes will strengthen the setup. Ideal for swing traders targeting medium-term downside.

Gold continues to fluctuate, and range operations are effective!Gold opened high on Monday and then fell sharply. On Tuesday, it fluctuated and corrected with a cross-yang line. On Wednesday, the overall trend was also volatile. However, after the Fed's interest rate decision was announced on Wednesday, the price of gold fell to around 3362. The low point of this decline was just supported by the 10-day moving average. From a technical point of view, the support of the 10-day moving average at 3350 has become a key point. If this support can be effectively maintained, the gold price is expected to maintain a volatile pattern; once it breaks down, the short-selling force may continue, and then it will be necessary to look at the support of the 20-day moving average near 3350. In terms of upper resistance, the 5-day moving average is currently near 3390, which will suppress the upward movement of gold prices. Further resistance depends on the gains and losses of 3405.
There is not much change in the 4-hour chart. The lower track has not opened, and the support of 3360 is strong. It is still a bullish trend. However, it is worth noting that in the continuous rebound, the Bollinger middle track suppression point has not been broken. Relatively speaking, gold is weak and volatile in the medium term. Under the trend today, if it continues to rise, we must pay attention to the gains and losses of the dense suppression point 3405. If 3405 is broken, the trend strength will come out and we can see the high point of 3430. For intraday trading, we still maintain high-altitude and low-multiple, waiting for the trend strength to break through the space, and we are bullish above the support of 3350 during the day.
Gold operation strategy: It is recommended to short at the rebound of 3385-3390, with a target of 3370-3365; gold falls back to 3350-3355 and buys, with a target of 3375-3385;

Tend to short gold, it may still retrace to 3360-3350 areaAt present, gold as a whole is still fluctuating in the 3395-3365 area. In the short term, both long and short sides are not willing to break through. They may be waiting for the guidance of the Fed's interest rate decision and Powell's monetary policy press conference. However, from the current oscillation structure, because the high point of gold rebound and the low point of retracement are gradually moving downward, the center of gravity of the candlestick chart is shifting downward, and the weight of gold shorts is slightly higher.
From the current structure, 3395-3405 has become a new round of pressure area. Gold has been unable to break through for a long time, and has tried to accelerate downward many times during the retracement process. Although it can stabilize above 3375-3365, it may be easier to break through below after several tests. Once the 3375-3365 area is broken, gold may even continue to move to the 3360-3350 area.
Therefore, within the 3395-3365 oscillation range, we can temporarily maintain the trading rhythm of selling high and buying low in the short term, while we must pay attention to the breakthrough of gold. Once gold breaks through, the trend may be continued, and we need to follow the trend to execute transactions!

Gold is heading more down!Gold is extending its corrective move, aiming to retest the ascending trendline support. Is this the end of the correction? Unlikely!

Key Event Today – FOMC Interest Rate DecisionAs risk-off sentiment cools, gold bulls failed to take control yesterday, resulting in a stalemate with the bears.
From the 4H chart perspective, bearish momentum currently appears stronger,
though bulls are not giving up easily.
Currently, price is rebounding off the 4H MA60 support,
with immediate resistance from the MA20 around 3405.
As time progresses, this resistance is likely to shift lower,
so for now, we’ll treat $3400 as the primary reference point.
For bulls to regain dominance,
they must hold steady above 3405,
and more importantly, protect the support at 3386–3378 during any pullback.
🔔 Key Event Today – FOMC Interest Rate Decision
Today’s trading will also be influenced by the Federal Reserve’s rate decision,
which, based on current expectations, is likely to weigh heavily on bullish sentiment.
📌 Strategy for Today:
Main Bias: Sell the rebound
Secondary Approach: Buy on pullbacks if strong support levels hold
Key support levels to monitor:
⚠️ 3382 zone (minor support)
🔻 Most critical: 4H MA60 around 3366
Stay cautious during the FOMC announcement window, and remember — in volatile markets, reacting with discipline is more important than predicting perfectly.
Gold — Awaiting Clarity at the Neckline (FRL Setup)“Trading is capital management under uncertainty. The red horizontal zone is the zone of uncertainty. Neckline levels are rubicons — thresholds where the market becomes clear to us. Don’t fear uncertainty. Learn to wait for the moment when everything becomes clear.”
Right now, gold is forming an upward trend. But as we know, every trend consists of impulses and corrections — and each of those is a trend of its own.
According to Fractal Reversal Law (FRL):
• Every structure ends with a reversal pattern.
• A neckline is always strictly horizontal and defined by the last impulse’s top.
• The MA100 tells us the scale we’re working with — helping us select the right timeframe to confirm.
🔍 In this setup:
• A potential reversal pattern is forming.
• The neckline coincides perfectly with the MA100 — a strong alignment of structure and scale.
• We also see early signs of MACD divergence, suggesting loss of bearish momentum.
Neckline levels: 3400 for a Double bottom and 3300 for a Double top.
✅ What to wait for:
• A full-bodied candle close above the neckline (not just a wick).
• This signals the end of correction and potential beginning of a new impulse.
🎯 Target:
• Measure the height from the neckline to the bottom of the correction.
• Project it upward from the neckline to estimate the first profit target.

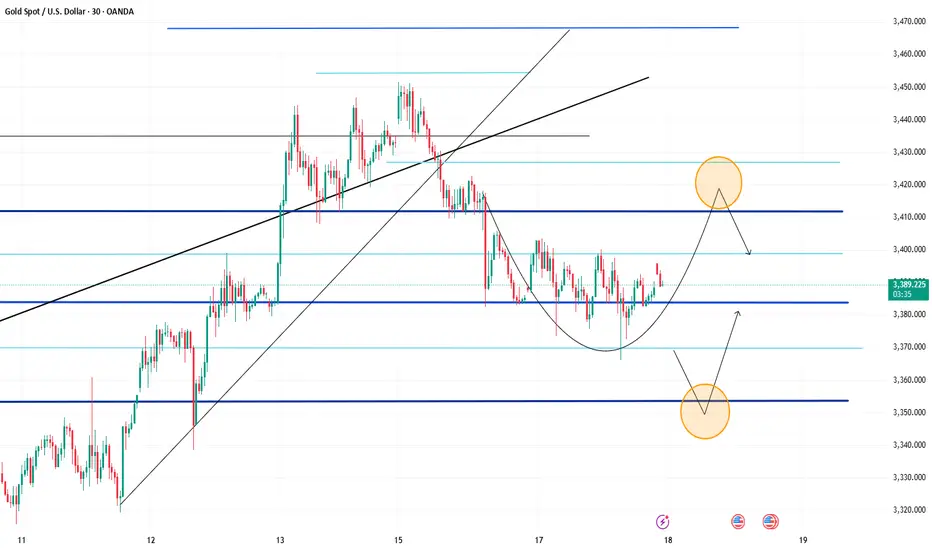
Gold | 4h Structural LookoutPEPPERSTONE:XAUUSD
📅 June 18, 2025
Chart Title: “Gold's Battle at the Midpoint – Compression Before Explosion”
Bias: Neutral-to-Bullish
Structure: Ranging with Bullish Channel
✳️ Technical Summary:
Gold continues to coil near the upper half of its multi-month structure, testing traders’ patience before a potentially explosive move. Current PA is forming a tight consolidation right beneath mid-channel resistance, suggesting a directional breakout is imminent — especially with the FOMC catalyst ahead.
📏 Key Chart Features:
Clear Rising Channel: Acting as medium-term trend guide
Major Consolidation: Identified around 3,330–3,380
Historical Boxes & Reaction Lows: Multiple orange circles show clear buying interest zones
Possible Long-Term Range: Defined between 3,123 and ATH zone (3,500)
EMA Support: Price currently holding both 15 & 60 EMAs
📈 Scenarios to Watch:
🔼 Bullish Breakout Path:
Trigger: Break and close above 3,400
Confirmation: Follow-through above consolidation +full body close
TP1: 3,460
TP2: ATH retest around 3,500–3,540
SL: Below 3,320 or lower trendline
Invalidation: Break below channel
🔽 Bearish Breakdown Path:
Trigger: Breakdown below 3,325 support
First Target: 3,250
Expansion Target: 3,123 – base of the macro range
Extreme Bear Target: 3,000 zone
SL: Above 3,400
Consolidation Zoom in:
#Xauusd #Gold #Trading #MJtrading #forex #Chart #chartanalysis #signal #freesignal

Gold (XAUUSD) – Demand Zone Holding, Silver Leading BreakoutGold has respected its demand zone near $3,367–$3,382 and is attempting to bounce higher. Importantly, Silver (XAGUSD in pink overlay) is leading the upside move, having broken out cleanly above $37.00 and still climbing. This confirms the bullish momentum across precious metals.
Geopolitical tensions, dovish Fed commentary, and risk-off market conditions continue to favor a move toward $3,451, $3,471, and possibly $3,495.
🔍 Technical Breakdown (4H)
Support Zone: $3,367–$3,382 (retest of broken resistance)
Bullish Structure: Rising lows, trendline holds, and higher timeframe support remains intact
Projected Targets:
🎯 TP1: $3,451 (recent high)
🎯 TP2: $3,471 (key extension)
🎯 TP3: $3,495 (top of range)
Stop Loss: Below $3,351 (invalidates demand structure)
🪙 Silver (XAGUSD) Overlay Insight:
Currently at $37.11+, showing leadership in the breakout.
Suggests gold will likely follow through — watch for Gold catching up.
🧠 Macro & Fundamental Context (June 17)
Bullish Drivers:
🔥 Ongoing Middle East war escalation (Iran-Israel, US troop buildup)
🏦 Dovish Fed tone, soft retail sales, rate cuts expected from Sept
🧾 Silver strength confirming demand across metals
Risks:
☮️ Unexpected ceasefire headlines could cause knee-jerk pullbacks
📈 Hot inflation data or hawkish Fed rhetoric could pressure upside
📅 Key Events to Watch:
FOMC members' speeches this week
US Core PCE inflation print
War headline velocity — particularly involving shipping or direct US-Iran confrontation
🧭 Strategy Suggestion:
Tactical Buy on Rejection Wick from current demand zone
Watch Silver momentum — if it breaks $37.50+, gold likely catches up fast
Consider scaling out around $3,451–$3,471 with final target near $3,495

Hanzo / Gold 30 Min ( Accurate Tactical Break Out Zones )🔥 Gold – 30 Min Scalping Analysis (Bearish Setup)
⚡️ Objective: Precision Breakout Execution
Time Frame: 30-Minute Warfare
Entry Mode: Only after verified breakout — no emotion, no gamble.
👌Bullish After Break : 3345
Price must break liquidity with high volume to confirm the move.
👌Bearish After Break : 3400
Price must break liquidity with high volume to confirm the move.
☄️ Hanzo Protocol: Dual-Direction Entry Intel
➕ Zone Activated: Strategic liquidity layer detected — mapped through refined supply/demand mechanics. Volatility now rising. This isn’t noise — this is bait for the untrained. We're not them.
🩸 Momentum Signature Detected:
Displacement candle confirms directional intent — AI pattern scan active.
— If upward: Bullish momentum burst.
— If downward: Aggressive bearish rejection.
🦸♂️ Tactical Note:
The kill shot only comes after the trap is exposed and volume betrays their position.

Gold could go to 3600A retest of 3435 does not lead to a pullback or reversal. The price is consolidating near the level, which indicates to us that the buyers are stronger in the moment. The fall of the dollar may support gold, leading to an overall rise not only to 3500 but also to 3600
Scenario: in the Pacific or Asian session, gold may try to break the 3435 resistance. Consolidation above this level will lead to growth and a retest of 3495 from which a small pullback (a logical reaction to the resistance level) may occur before continuing to grow in the medium term.

Gold Rebounds from Support, Eyes Breakout Above 3,370📊 Market Dynamics:
– Gold briefly dipped to 3,344 this morning before rebounding to 3,355 as of now.
– The USD is steady after cautious Fed commentary, while geopolitical tensions continue to support safe-haven flows into gold.
📉 Technical Analysis:
• Key resistance: 3,370 – 3,380
• Immediate support: 3,344 – 3,340
• EMA: Price remains above EMA 09, signaling continued short-term bullish bias.
• Patterns / Momentum: A bullish engulfing pattern formed on the H1 chart at 3,344.
📌 Outlook:
Gold may continue to rebound toward 3,370–3,380 in the short term. A break above 3,380 could open the path to 3,400.
💡 Trading Strategies:
🔻 SELL XAU/USD at: 3,375 – 3,380
🎯 TP: 3,355 – 3,360
❌ SL: 3,385
🔺 BUY XAU/USD at: 3,344 – 3,348
🎯 TP: 3,365 – 3,370
❌ SL: 3,335

GOLD Under Pressure as Volatility Rises – Key Support in FocusGOLD – Overview
Gold remains under bearish pressure driven by ongoing geopolitical instability and uncertainty around recent U.S. economic data.
As long as the price trades below 3347, a corrective move toward 3322 is expected.
A 15-minute close below 3322 would likely extend the decline toward 3303, where a rebound may occur.
However, if the price reverses and stabilizes above 3347, this would support a move higher toward 3365 and 3379.
Market Note:
Overall conditions remain highly volatile and unstable, with sharp intraday swings likely.
• Support: 3322 / 3303 / 3281
• Resistance: 3364 / 3379 / 3393

Gold Potential Bullish ContinuationAfter retracing to the approx. 3370 - 3380 zone, gold still seems to exhibit signs of overall potential Bullish momentum as the price action may form a credible Higher Low with multiple confluences through key Fibonacci and Support levels which presents us with a potential long opportunity.
Trade Plan:
Entry : CMP 3393
Stop Loss : 3286
TP : 3499 (Before All Time High)

XAUUSD: 1H Chart Trend Continuation or Deeper Pullback?Established Uptrend Channel : The XAUUSD pair is trading within a well-defined, long-term ascending channel (highlighted by the red parallel bands), indicating a clear bullish trend with consistent higher highs and higher lows over the observed period.
Significant Support Confluence : The lower boundary of the ascending channel, particularly the area marked "Confluence Area for support" (green and orange shaded zone), has repeatedly acted as a strong demand zone where price has found support and reversed higher.
Current Corrective Phase and Deciding Point : Price is currently undergoing a short-term correction, forming a smaller, descending channel (white/grey box) within the larger uptrend. This area is labeled "Deciding Area to continue Higher," indicating that the immediate future direction is contingent on whether price breaks out of this smaller channel or continues within it.
Projected Pathways : The chart illustrates two immediate potential scenarios: a resumption of the primary uptrend (green dotted path) upon a successful breakout from the short-term descending channel, or a deeper retracement towards the major ascending channel's support (red dotted path) if the current corrective structure persists or breaks lower.
Disclaimer:
The information provided in this chart is for educational and informational purposes only and should not be considered as investment advice. Trading and investing involve substantial risk and are not suitable for every investor. You should carefully consider your financial situation and consult with a financial advisor before making any investment decisions. The creator of this chart does not guarantee any specific outcome or profit and is not responsible for any losses incurred as a result of using this information. Past performance is not indicative of future results. Use this information at your own risk. This chart has been created for my own improvement in Trading and Investment Analysis. Please do your own analysis before any investments.

Gold Intraday Trading Plan 6/16/2025As explained in my weekly post, I am bullish on gold this week. Therefore, I will look for buying opportunity from 3388-3400, targets by 3487 for today.

GOLD/USD Support Retest & Breakdown SetupGOLD/USD Support Retest & Breakdown Setup 📉🔍
🔹 Overview:
The chart indicates a potential bearish continuation pattern on GOLD/USD as the price is approaching a key support level at 3,335.305. Previous price action shows multiple rejections from the resistance zone (~3,435), followed by lower highs – a sign of weakening bullish momentum.
📊 Technical Analysis:
🔺 Resistance Zone (~3,435)
Multiple rejections (🔴 red arrows) indicate strong supply pressure.
Price has failed to break above this area thrice, forming a clear ceiling.
🔻 Support Zone (~3,335)
Marked as the target for a short setup.
Price is testing this level again after forming a minor consolidation below lower highs.
A clean break below this purple zone may trigger a continuation to the downside, targeting the broader support range below (~3,240).
🟠 Bearish Structure:
Series of lower highs (highlighted with circles).
Breakdown pattern is developing with declining bullish momentum.
📈 Potential Play:
A confirmed breakdown below 3,335 could lead to a drop toward the next major support.
If support holds, short-term bounce is possible but limited by the dominant resistance.
📌 Conclusion:
GOLD/USD is currently in a bearish setup, with the market eyeing a potential breakdown below a critical support zone. If this level fails to hold, we could see accelerated bearish momentum toward the lower support range.
💡 Caution: Wait for a confirmed close below support before entering any short trades.

DeGRAM | GOLD aim to test the lower boundary📊 Technical Analysis
● Hourly price is defending the channel’s lower half: three consecutive wicks bounced at 3 360, forming a descending flag whose base coincides with the dynamic support.
● OBV is edging higher while the flag narrows; a close above 3 408 would unlock the flag-measured move toward the upper rail / horizontal target at 3 444–3 450.
💡 Fundamental Analysis
● World Gold Council reports India’s jewellery demand rebounded 8 % w/w as monsoon concerns eased, while CME data show fresh 6 K-lot COMEX short-covering after the latest FOMC testimony tempered rate-hike talk.
✨ Summary
Long 3 360–3 380; flag break > 3 408 eyes 3 444 → 3 450. Bull view void on an H1 close below 3 343.
-------------------
Share your opinion in the comments and support the idea with a like. Thanks for your support!
