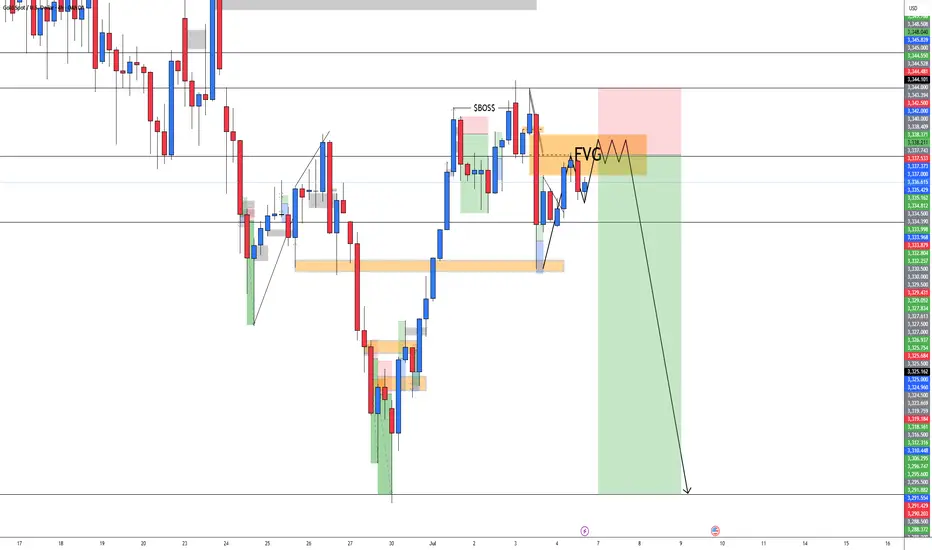
XAUUSD BEARISHAccording to the SMC and FVG concept, I am seeing bearish momentum in Gold. We have to wait for the proper rejection from FVG to sell the GOLD.
GOLDMINICFD trade ideas
GOLD (XAUUSD): Potential Scenarios Explained
Here is my updated technical outlook for Gold with potential scenarios.
Bullish Scenario
The price is currently testing a significant daily resistance cluster.
Its bullish breakout and a daily candle close above 3368 will
provide a strong confirmation.
More growth will be expected then.
Bearish Scenario
For now, the market is consolidating on the underlined resistance.
The price is stuck within a horizontal range on a 4H time frame now.
Your bearish signal will be a breakout of its support and a 4H candle
close below 3310.
It will provide a strong bearish confirmation.
The market might be weak and remain within a 4H range today.
But, everything can happen, so watch carefully.
❤️Please, support my work with like, thank you!❤️
I am part of Trade Nation's Influencer program and receive a monthly fee for using their TradingView charts in my analysis.

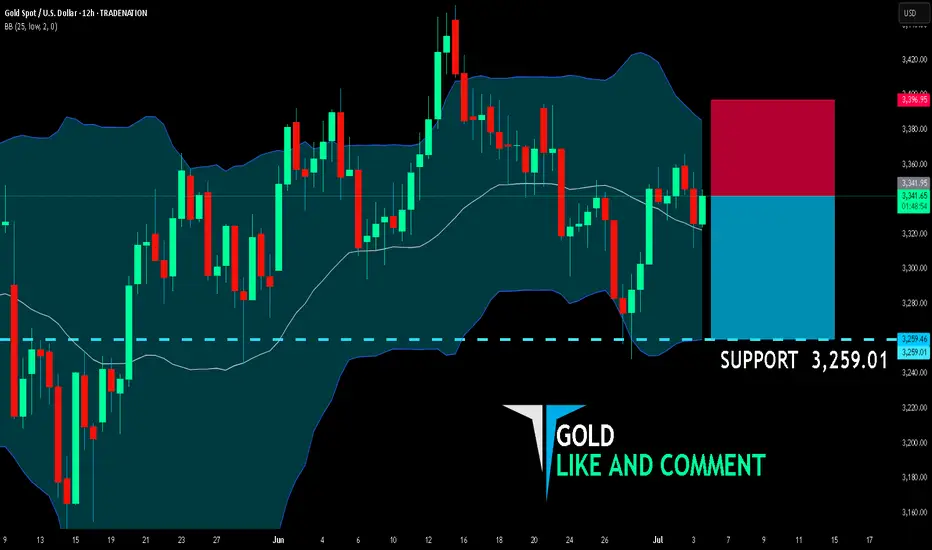
GOLD BEARS ARE STRONG HERE|SHORT
GOLD SIGNAL
Trade Direction: short
Entry Level: 3,341.95
Target Level: 3,259.01
Stop Loss: 3,396.95
RISK PROFILE
Risk level: medium
Suggested risk: 1%
Timeframe: 12h
Disclosure: I am part of Trade Nation's Influencer program and receive a monthly fee for using their TradingView charts in my analysis.
✅LIKE AND COMMENT MY IDEAS✅


Gold Gains Strength as the Dollar Wobbles – What’s Next?Hello, my dear friends – let’s take a fresh look at gold after yesterday’s moves!
At the moment, gold is trading steadily around 3,345 USD as the market awaits tonight’s highly anticipated U.S. Nonfarm Payrolls report. Yesterday’s ADP data caused a mild shake in sentiment, showing the first drop in private sector employment in over two years. This immediately fueled expectations that the Federal Reserve could move to cut interest rates sooner than expected — putting pressure on the U.S. dollar and offering support to gold as a non-yielding safe haven.
Meanwhile, the DXY (U.S. Dollar Index) has slipped to its lowest level in nearly three years, making dollar-denominated assets like gold more attractive to international investors. On top of that, lingering geopolitical tensions and ongoing strong central bank buying continue to reinforce gold’s role as a long-term store of value.
From a technical perspective on the H4 timeframe, gold is showing a very tight structure after breaking out of a prolonged downtrend channel. Price is currently consolidating between 3,330 and 3,360 USD, with a clearly defined bullish formation: higher highs and higher lows — a strong signal that the uptrend is starting to take shape again.
The key level to watch now is 3,358 USD. If price breaks above this level with convincing buying momentum, I expect gold to enter a new bullish leg toward 3,390 – 3,407 USD, aligning with the Fibonacci 1.618 extension — often a magnet for price during strong trends. On the other hand, if there’s a short-term pullback, the support zone around 3,327 – 3,318 USD will be critical, offering a potential re-entry point for buyers looking to ride the next wave up.
This is not a phase for impulsive decisions — but it’s definitely not a moment to be passive either. The breakout could come fast, and only prepared traders will be ready to act.


Gold Holds Above 3342 Ahead of Key U.S Data –Bullish Bias IntactGold Rises as Market Awaits Key U.S. Economic Data
Gold prices are pushing higher as investors position ahead of today’s major U.S. economic releases, including NFP and unemployment figures. Expectations of weaker data are supporting bullish sentiment.
Technical Outlook (XAU/USD):
Gold maintains a bullish structure as long as it trades above 3,342.
→ A push toward 3,365 is likely
→ A 1H close above 3,365 would open the path toward 3,375
However, if price closes below 3,342 on the 1H chart, bearish momentum may build, targeting 3,331 and 3,320
Key Levels:
• Resistance: 3,365 / 3,375 / 3,390
• Support: 3,341 / 3,331 / 3,320

Bullish bounce off major support?XAU/USD has bounced off the support level which is an overlap support and could rise from this level to our take profit.
Entry: 3,265.39
Why we like it:
There is an overlap support level.
Stop loss: 3,121.15
Why we like it:
There is a pullback support level that aligns with the 145% Fibonacci extension.
Take profit: 3,344.54
Why we like it:
There is a pullback resistance that lines up with the 50% Fibonacci retracement.
Enjoying your TradingView experience? Review us!
Please be advised that the information presented on TradingView is provided to Vantage (‘Vantage Global Limited’, ‘we’) by a third-party provider (‘Everest Fortune Group’). Please be reminded that you are solely responsible for the trading decisions on your account. There is a very high degree of risk involved in trading. Any information and/or content is intended entirely for research, educational and informational purposes only and does not constitute investment or consultation advice or investment strategy. The information is not tailored to the investment needs of any specific person and therefore does not involve a consideration of any of the investment objectives, financial situation or needs of any viewer that may receive it. Kindly also note that past performance is not a reliable indicator of future results. Actual results may differ materially from those anticipated in forward-looking or past performance statements. We assume no liability as to the accuracy or completeness of any of the information and/or content provided herein and the Company cannot be held responsible for any omission, mistake nor for any loss or damage including without limitation to any loss of profit which may arise from reliance on any information supplied by Everest Fortune Group.

GOLD BROKEN WEDGE|LONG|
✅GOLD was trading in an
Opening wedge pattern and
Now we are seeing a bullish
Breakout so we are bullish
Biased and we will be expecting
A further bullish move up
LONG🚀
✅Like and subscribe to never miss a new idea!✅
Disclosure: I am part of Trade Nation's Influencer program and receive a monthly fee for using their TradingView charts in my analysis.

Gold Trading Strategy July 3✏️D1 candle continues to increase towards the price gap zone. At the beginning of the European session, sellers accept to enter the market at this resistance price zone around 3365. The accumulation pattern of gold price is forming a triangle pattern.
The lower boundary is broken, it will lead to the breakout point of the lower boundary and vice versa, if the upper boundary of the triangle is broken, the price will move towards the next resistance.
📉 Key Levels
Resistance: 3388-3363
Support: 3330-3311-3297-3277
Buy trigger: breakout above 3363
Sell trigger: breakout below 3330
If this idea resonates with you or you have other ideas, please comment. I look forward to reading your thoughts!
Best regards, VHT Traders!

Gold price trend forecast on July 8Gold price trend forecast on July 8
As of July 6, 2025, the international gold price fluctuates in the range of 3250-3350.
Affected by multiple factors, market sentiment is obviously divided.
The following are the key points and forecasts for next week's trend:
(1): Divergence in interest rate cut expectations: The probability of a rate cut in September has dropped to 47%.
(2): Weaker US dollar index: If the Fed postpones the rate cut, the US dollar may rebound in the short term, suppressing gold prices.
(3): Geopolitical risks: The situation in the Middle East has eased, and gold prices may fall due to safe-haven demand.
Russia-Ukraine conflict: If the ceasefire negotiations make progress, the safe-haven premium of gold may further subside.
(4): Central bank gold purchases and market supply and demand
Global central banks continue to increase their holdings: In the first quarter of 2025, global central banks net purchased 289 tons of gold, but the People's Bank of China has suspended its purchases for two consecutive months. The market is paying attention to subsequent trends.
Gold ETF fund outflow: SPDR Gold Trust holdings fell to 942 tons (the lowest since November 2024), indicating the withdrawal of short-term speculative funds.
(5) Technical analysis
Key support level: US$3,310. If it falls below, it may fall to US$3,280.
Resistance level: US$3,360. A new round of gains can only be confirmed if it breaks through US$3,400.
4. Investment advice
Short-term trading: Pay attention to the breakthrough of the US$3,300-3,350 range and adopt a high-sell-low-buy strategy.

Riding Wave (5) Toward 3380 Before ABC Correction📌 Market Context
The current chart shows wave (5) of a larger impulsive structure is still in progress, with price rising from the bottom of wave (4). After a clean wave (1)-(2)-(3)-(4), the market is now pushing upward, targeting the 3380 zone as a likely wave (5) completion.
🟢 Entry Levels (End of Wave 2)
First Entry: 3298
Second Entry: 3279.6

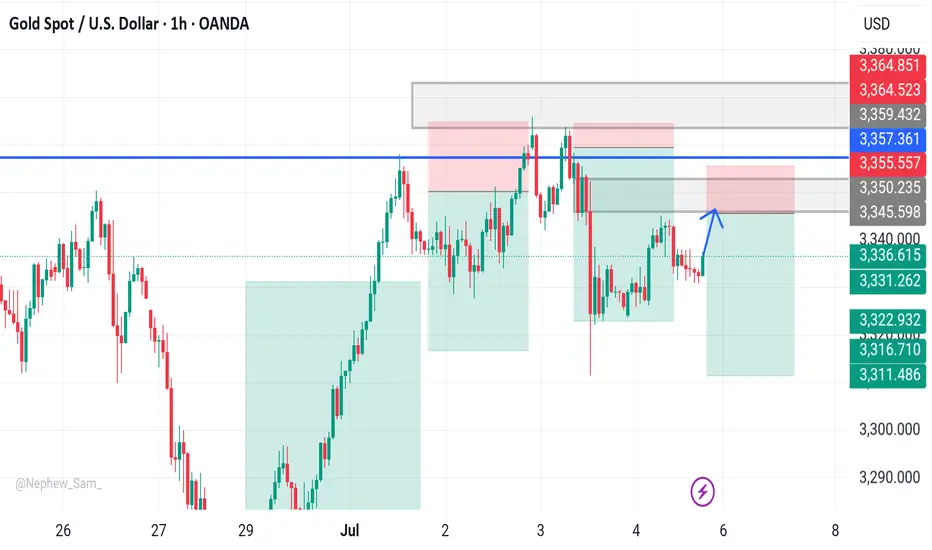
XAUUSD – July 3 Live Setup | Price at M15 POIGold has been moving in line with our bullish bias over the past few sessions.
Yesterday’s break above the 3358 M15 level gave us a clean Break of Structure (BoS) — confirming short-term bullish momentum within the larger framework.
After this strong push upward, the market is now retracing.
Price is currently entering a high-probability pullback zone: 3340–3342 (M15 POI).
This is a textbook base structure setup — where we wait for price to return to a valid zone after structure shift, and only act after confirmation on the lower timeframe.
🔍 Setup in Play:
Current Bias:
• M15 Trend: Bullish
• H4 Context: Bullish (after recent HTF shift)
• Market State: Pullback phase after BoS
Key Zone in Focus:
• 3340–3342 – M15 POI (zone of interest for continuation)
We are not entering blindly .
We are waiting for confirmation on M1 — specifically:
✅ ChoCh (Change of Character)
✅ Followed by a micro BoS
Only then do we consider a long entry — and even then, risk must be managed through proper R:R and structure anchoring.
🎯 Target:
If M1 confirmation occurs, the expected short-term target is 3365 — the next clean M15 structural high.
⚠️ Risk Conditions:
If price breaks below the POI without M1 confirmation — or aggressively violates the zone — the setup is invalid.
In that case, we simply step aside and reassess.
This is process-driven execution:
No need to predict.
No need to chase.
Just observe, confirm, and execute with structure.
📖 This is how we let the chart do the work.
The process protects us.
Structure invites us.
Stillness refines us.
📘 Shared by @ChartIsMirror
Author of The Chart Is The Mirror — a structure-first, mindset-grounded book for traders

XAUUSD: Eyes $3,800 based on this 2 year pattern.Gold turned neutral again on its 1D technical outlook (RSI = 52.131, MACD = 4.646, ADX = 13.719) as after last week's selling, it recovered yesterday its 1D MA50, restoring the bullish trend. The long term trend has been extremely bullish after all and the past 2 months have simply been a consolidation stage through a Triangle pattern that worked as accumulation for the next bullish wave. On this 2 year pattern, typical waves rose by at least +22.57%. Once the 1D MA50 turns into a support again, we anticipate that a new Channel Up will push Gold to a TP = 3,800.
See how our prior idea has worked out:
## If you like our free content follow our profile to get more daily ideas. ##
## Comments and likes are greatly appreciated. ##

Gold’s Bullish Range Holds – Is This the Dip to Buy?With tensions easing in the Middle East and risk appetite moderating, gold has settled into a bullish daily range. The metal recently broke a key high, confirming its upward momentum, but now appears to be consolidating. The central question is whether gold will break lower for a deeper correction or whether this is merely a pause before the next leg higher.
Reduced geopolitical risk has tempered the “risk-on” rally in gold, but the metal remains firmly within a bullish daily range. This indicates that the underlying bid has not disappeared—only short-term speculative flows have adjusted.
Gold recently breached a protected high—likely a higher high or significant resistance level—reinforcing the prevailing bullish momentum. A pullback into imbalance or demand zones is anticipated; however, if a catalyst emerges, price could resume its advance from current levels, with the 0.328 Fibonacci retracement acting as a strong support.
Meanwhile, the DXY is exhibiting signs of a pullback but lacks the fundamental drivers necessary to sustain a broader rally.

Xauusd Going Towards BuyDespite rising selling pressure on the dollar and mixed US PCE numbers, Gold prices fell further on Thursday, reaching new four-week lows around $3,260 per troy ounce. Collaborating with the decline, recent improvements in the Israel-Iran conflict continue to fuel investor withdrawals from the safe haven region.


WEEK PLAN|Will This Gold Rally Collapse Into a Liquidity Trap ? Gold remains trapped between high-liquidity resistance and a strong order block below. While short-term bullish structure is forming, the weekly outlook remains complex due to upcoming high-impact events from the Fed and US labour data. Expect volatility and traps in both directions.
🧠 Fundamental Context
FOMC Meeting Minutes (Wed 9 July): Market will look for rate cut clues.
Unemployment Claims (Thu 10 July): A stronger labour market = stronger USD = bearish for gold.
FOMC Member Waller Speaks (Thu 10 July): Any hawkish tone could cap gold upside.
📊 Key Zones
Zone Role Notes
3,387 – 3,439 Sell Zone High liquidity, weak highs, ideal reversal trap
3,240 – 3,260 Buy Zone Strong OB, liquidity sweep, aligned with trendline support
3,365 Weekly High May reject or break based on macro catalyst
🛠️ Trade Setups (Entry Zones as Requested)
✅ 1. BUY GOLD
Entry: 3,346 – 3,344
Stop Loss: 3,340
TP1: 3,356
TP2: 3,366
TP3: 3,376+ (Open Target)
Rationale: Scalping long off micro demand, aiming for a short-term spike above liquidity.
✅ 2. BUY GOLD SCALPING
Entry: 3,291 – 3,289
Stop Loss: 3,285
TP1: 3,299
TP2: 3,310
TP3: 3,320+ (Open Target)
Rationale: Buy on breakout momentum before hitting higher sell-side zones.
✅ 3. SELL GOLD
Entry: 3,389 – 3,391
Stop Loss: 3,396
TP1: 3,381
TP2: 3,371
TP3: 3,361 (Open Target)
Rationale: Fade the breakout — fakeout zone targeting liquidity void beneath.
✅ 4. SELL GOLD
Entry: 3,349 – 3,351
Stop Loss: 3,355
TP1: 3,339
TP2: 3,329
TP3: 3,319 (Open Target)
Rationale: Short off weak rally, playing potential rejection near intraday high.
📅 This Week’s Events
Date Event Likely Impact
9 July FOMC Minutes Fed tone → volatility spike
10 July Jobless Claims (233K) Strong number = gold downside
10 July FOMC Waller Speech Additional risk-on/risk-off flows
⚠️ Trading Strategy
Use H1–H4 confirmations (CHoCH, BOS, FVG) before entries.
Avoid entries 1h before and after red news.
Focus on 3,260–3,439 range as key decision area for the week.


XAU/USD Struggles Below 3352, Bearish Pressure Remains ActiveXAU/USD Below Pivot, Watching 3352 for Bullish Confirmation
Gold prices edged up today as investors shifted their focus to the U.S. fiscal situation and lingering uncertainty ahead of the July 9 deadline when U.S. tariffs are set to take effect. But at the same time, we have strong resistance on the way.
The price continues to move below the pivot level and the 3352 resistance, which together form a strong supply zone.
A confirmed breakout above 3352 on the 4H candle is needed to validate a bullish move toward 3365. However, the possibility of a renewed decline remains unless the price also breaks above 3365, which would confirm a continuation of the upward trend.
The bearish trend remains active as long as the price trades below the pivot at 3348 and the 3352 level. Sustained trading below this zone would likely lead to a decline toward 3320 and 3313.
Key Technical Levels
Resistance: 3352 - 3365 - 3400.
Support Levels: 3320 - 3313 - 3218.
Pivot Line: 3348


gold is still bearishgold is still bearish
in the higher timeframe gold is still bearish after a strong bull run week gold settled below the weekly neckline.
which is an indication of the bearish is still present. a few support and resistance.
during NFP a strong bearish enter from 3351 to 3312.
3351 is a goo retest area of bear.
bull stop at 3312 now as key level.
break 3312 next destination is 3289 and 3248.
break above 3352 and 3363 next destination is 3400.
