XAUUSD BATTLE PLAN — 16 JUNE 2025GoldFxMinds — Sniper Liquidity Execution
👋 Hello traders — we’re entering a highly tactical week where liquidity rotation dominates both sides of the board. This is no longer trend-following — this is liquidity chess.
🔎 Market Narrative
Gold remains structurally bullish after a clean sequence of higher lows: 3120 → 3246 → 3448.
Last week’s sweep above 3447 cleared weak hands, activated premium liquidity traps, and left price fully positioned inside extended premium expansion. Smart money continues rotating liquidity aggressively as markets prepare for this week’s heavy catalysts.
With FOMC, Powell’s press conference, Fed projections, and Middle East tensions all unfolding, institutional positioning is building quietly beneath surface price moves.
For us, this is not a moment to guess or force trades — this is the phase where patience and structure offer the only real edge.
🎯 GoldFxMinds Bias for 16 June 2025
🔼 Short-term:
Price remains inside premium expansion, with open liquidity layers above 3450 → 3480 → 3505 still uncollected. We allow price to finish hunting late buyers before considering any premium exhaustion reactions. No blind shorting inside premium unless exhaustion signals confirm.
🔽 Medium-term positioning:
Controlled pullbacks into 3368 and deeper recalibration zones offer the cleanest tactical long opportunities, aligned with higher timeframe bullish structure for potential future premium expansions.
❌ No aggressive directional conviction intraday:
The current structure demands discipline, patience, and reactive execution — not early bias.
🔼 Premium Supply Zones (Sniper Calibrated)
Price Zone Explanation
3450 – 3462 🔸 Premium inducement zone — early liquidity pocket where price may react mildly before sweeping deeper premium levels.
3480 – 3495 🔸 Liquidity collection extension — gap zone drawing in late buyers and liquidity build-up above recent highs.
3505 – 3515 🔸 Premium exhaustion — final sweep level for late liquidity grabs before potential higher timeframe recalibrations.
🔽 Demand Defense Zones (Sniper Calibrated)
Price Zone Explanation
3410 – 3400 🔸 Micro pullback — short-term liquidity refill zone valid for scalps, not for strong swing positioning.
3368 – 3352 🔸 Tactical bullish recalibration — strong HTF OB + FVG combo, valid for tactical swing positioning with structure confirmation.
3308 – 3292 🔸 Institutional re-accumulation base — deeper liquidity recalibration where larger players likely step in for new expansions.
🎯 Execution Flow & Tactical Outlook
We let liquidity fully expose itself before positioning:
Above 3450: Expect continued liquidity sweeps. Monitor sharp reactions above 3480 for exhaustion setups — only trade short-side if clear rejection signals emerge.
Into pullbacks: Minor dips toward 3410 offer quick reactive scalps only. The real positioning opportunities open inside 3368 and deeper zones, where recalibration offers cleaner entries aligned with HTF bullish structure.
Discipline is key: No chasing. No prediction. Only reaction to clean liquidity behavior.
🧠 Trader’s Mindset for This Week
We're facing one of the heaviest institutional risk weeks:
🏛 FOMC Interest Rate Decision → Major market-moving catalyst.
🏛 Powell’s Press Conference → Immediate tone-shifting potential.
📊 Fed Projections → Will influence short-term USD positioning.
📊 Retail Sales & Housing Data → Potential intraday volatility triggers.
🌍 Middle East Tensions → Underlying risk bid remains supportive for gold.
Each event is fuel for liquidity displacement. We don't react emotionally — we position where liquidity delivers.
🚀 If this battle plan helps you stay fully locked — drop a 🚀, share your views, and follow GoldFxMinds for sniper liquidity updates throughout the week.
Stay sharp — liquidity always moves first.
— GoldFxMinds
GOLDMINICFD trade ideas

XAU / USD 2 Hour ChartHello traders. I have marked my areas of interest on the chart. I can see both scalp buy and sell trade set ups. Let's see how Pre NY volume does for gold today. I am going to let the London session play out to see how things go direction wise. BIg G gets a shout out. Be well and trade the trend.

GOLD GOLD CAME right inside my demand floor sweeping all intraday support into 3393-3400 and extended to 3384.
the buy zone triggered and is going up.

XAUUSD 15M CHART PATTERNYour XAUUSD (Gold vs USD) sell trade setup is as follows:
---
📉 Sell Entry:
3370
🎯 Take Profit Levels:
1. 3360 (10 pips)
2. 3350 (20 pips)
3. 3338 (32 pips)
❌ Stop Loss:
3398 (28 pips risk)
---
⚖ Risk-Reward Overview:
TP Level Reward (Pips) Risk (Pips) R:R Ratio
TP1 (3360) 10 28 0.36
TP2 (3350) 20 28 0.71
TP3 (3338) 32 28 1.14
---
✅ Suggestions:
The best R:R is at TP3 (1.14) – above 1:1, which is the bare minimum for many traders.
Risk is higher than initial reward for TP1 & TP2 – might be worth skipping unless you're scaling out.
Would you like me to turn this into a trading plan or help you set up position sizing?

XAU ScalpingMax TP is 261 ..wait H1 Broken sell to enter sell (even direct sell also no problem because this H4 already the confirmation)..what do you think ?

XAUUSDsell gold
sl 3434
tp 3409
1% risk on this trade
like an follow
if you like to chat im always down

Current Gold Trend Analysis and Trading RecommendationsOn Wednesday, the morning strategy suggested going long on gold at 3,375-3,365, perfectly seizing the pullback low and rebounding to the 3,400 level as expected. Today, there is also the Fed interest rate decision. Before the data release, short positions can be taken if the 3,400-3,405 level remains unbroken. If the 3,405-3,410 level is broken, we will continue to be bullish. Gold is in short-term oscillation, so try not to chase the market. Wait for a good entry opportunity. The upper level has also been repeatedly contested recently, and the Fed data is likely to break the range after its release.
For gold, continue to adopt an oscillating approach. In the 4H cycle, it is operating below the middle band. The short-term range is 3,405-3,365. If it breaks above 3,405, it can continue to target 3,420 and 3,450. Conversely, if it breaks below 3,365, it can fall to 3,350. In operation, prioritize long positions with short positions as a supplement, and adjust the strategy when a breakout occurs.
XAUUSD
buy@3370-3375
tp:3390-3400-3420
sell@3395-3400
tp:3380-3370
Investment itself is not the source of risk; it is only when investment behavior escapes rational control that risks lie in wait. In the trading process, always bear in mind that restraining impulsiveness is the primary criterion for success. I share trading signals daily, and all signals have been accurate without error for a full month. Regardless of your past profits or losses, with my assistance, you have the hope to achieve a breakthrough in your investment.

GOLD BEARS WILL DOMINATE THE MARKET|SHORT
GOLD SIGNAL
Trade Direction: short
Entry Level: 3,419.53
Target Level: 3,348.85
Stop Loss: 3,466.65
RISK PROFILE
Risk level: medium
Suggested risk: 1%
Timeframe: 6h
Disclosure: I am part of Trade Nation's Influencer program and receive a monthly fee for using their TradingView charts in my analysis.
✅LIKE AND COMMENT MY IDEAS✅

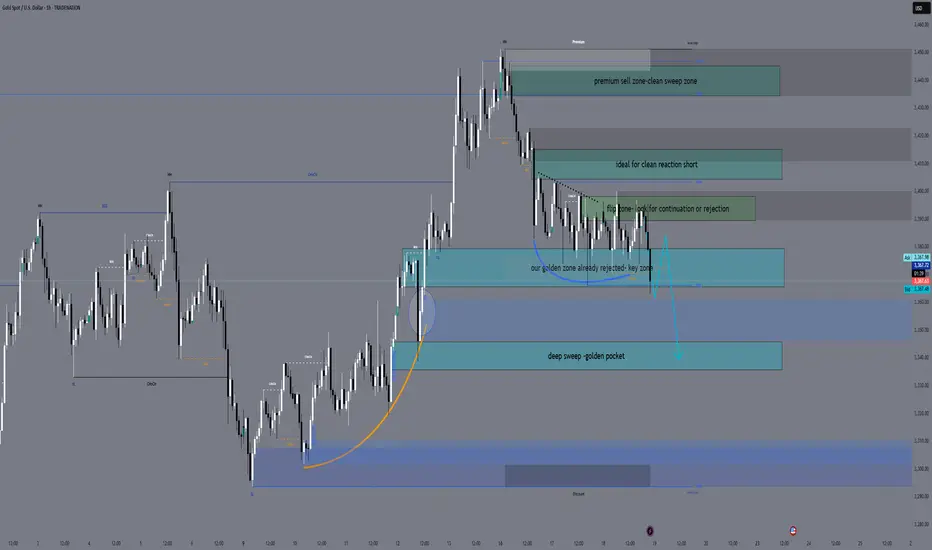
June 19 XAUUSD Setup — FOMC Aftershock or Bull Trap? Hey traders 👋
After yesterday’s FOMC fireworks and a weak reaction to initial retail sales data, gold broke structure into 3363 and is now floating below key resistance. Price is compressing under the previous H1 lower high, and liquidity continues to build on both sides — perfect conditions for engineered spikes.
Let’s break it down clearly.
🌍 Macro & Sentiment
Yesterday’s FOMC left rates unchanged, but Fed tone leaned hawkish.
Retail Sales and Unemployment Claims disappointed — slight downside pressure on the dollar.
Geopolitical front remains tense: no ceasefire in Gaza, Iran-Israel rhetoric escalates, and Russia-Ukraine conflict is ongoing.
Liquidity is king — and gold is being boxed for the next big move.
📉 Bias & Structure
Daily: Compression after FOMC, lower high remains in control.
H4: Bearish break below 3380, EMA21 hovering above price.
H1: Trendline structure broken, EMA5/21 forming bearish cross, RSI below 50.
Fibo: H1 drawn from 3452 to 3363 — key golden zone at 3405–3415.
🎯 Bias: Tactical Bearish under 3415 — looking for short-term bounces or premium traps to sell.
🧠 Sniper Zones
🔻 Sell Zones
1️⃣ 3405 – 3415
→ Key golden zone + EMA21 + FVG
→ Monitor M15/M5 rejection for continuation sells
2️⃣ 3435 – 3445
→ Premium OB trap zone
→ If price spikes irrationally, this becomes the extreme reversal area
🔺 Buy Zones
1️⃣ 3365 – 3380
→ Golden buy zone — real fib confluence
→ Already tapped today, but any clean retest may offer reactive bounce trades
2️⃣ 3335 – 3345
→ Extreme flush zone — only valid if deep dump occurs
→ Watch for exhaustion and M15 reversal confirmation
🔻 Emergency Buy Zone:
3305 – 3292
🧠 Why this zone?
✅ H4 untested Order Block + FVG (June 11 candle).
✅ 78.6% Fibonacci retracement (H1 swing from 3452 → 3363).
✅ RSI likely to print oversold.
✅ Deep discount structure — potential final inducement for reversal.
🔔 Important:
This is a backup zone, not for blind entries.
It only becomes active if 3335 breaks with conviction (full candle body close + volume).
Look for M15/M5 confirmation (divergence + price action signal) before engaging.
🔄 Flip Zone
3390 – 3398
→ Volume zone from FOMC + OB test
→ If reclaimed cleanly, may flip intraday bias short-term
📌 Battle Notes
Gold tapped 3363 today, reacting mildly.
If price retraces toward 3405–3415, I’ll watch for shorts — but no early entries.
Below 3365, watch for another bounce or setup around 3345.
Flip zone remains indecisive until confirmed with volume.
🧭 Plan Recap
→ Bearish under 3415
→ Pullback into 3405–3415 = short setup
→ Retest 3365–3380 = bounce watch
→ Flush into 3335 = reversal zone
→ 3435+ = irrational spike trap
🧠 Stay sniper. Wait for price to come to your zones — and execute only on confirmed reactions.
—
🚀 If this helped bring clarity, tap that 🚀, leave your bias in the comments, and hit FOLLOW for real structure-based trading.
🟨 Disclosure: I am part of TradeNation's Influencer program and receive a monthly fee for using their TradingView charts in my analyses and educational articles.
— GoldFxMinds 🧠✨
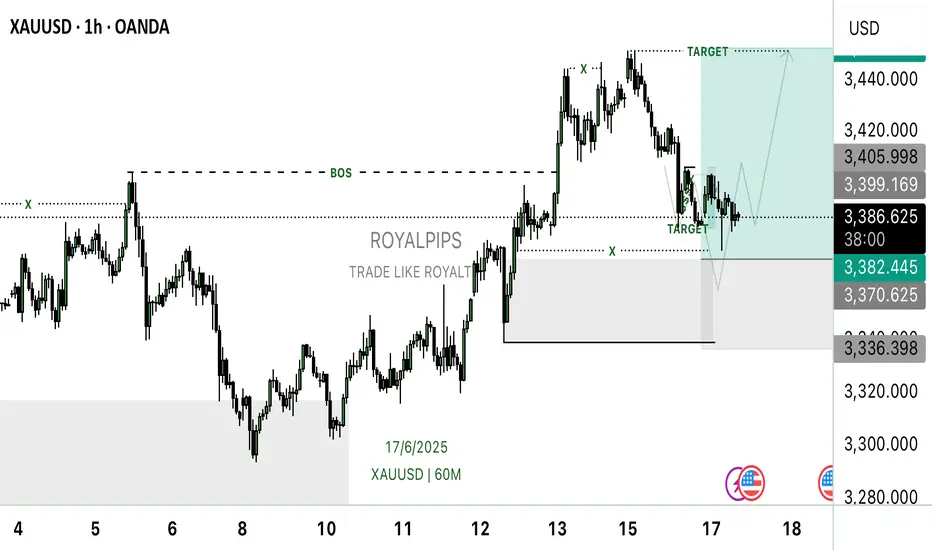
XAUUSD LONG XAUUSD has successfully broken its last high (Break of Structure), signaling a potential shift in momentum. Seeing that the pullback is almost coming to an end, it’s the best time to look for long trade.
✅ Target: Next key resistance or liquidity area above.
✅ Stop Loss: Just below the last low to minimize risk.
I dropped this idea 2 days ago.
Gold’s in a Trap — And That’s Exactly Why You Should Be CarefulGold is stuck in a tight sideways range. It’s been bouncing between $3,370–$3,380 for two days now. Everyone sees it. Every trader watching gold knows this level acted as support — and judging by the candle shadows, buyers are getting aggressive here.
So if you're purely technical — yeah, looks like a solid buy right now.
But here’s the twist…
___________________________________________________________
I’m not buying.
And I’ll tell you why — because it's too obvious.
When something screams "buy" from every chart and every textbook, that’s when you pause and ask yourself:
“Am I about to walk into a classic setup… or actually catch a real move?”
Because history shows us — these textbook setups often play out like this:
Motivation → Encouragement → Payback. (See Chart 2)
It goes like this:
Price breaks a visible high or low (Motivation)
Traders jump in and get some pips(Encouragement)
Then — brutal reversal (Payback)
Only then will everything get off the ground, and it will be fast, so that the "unnecessary" passengers who were "dropped off" should not have time to return to this train. So why are they "unwanted"? Well, here's one possible answer: because retail tends to hold losing trades too long , but gets spooked early on winners. We’re wired that way.
So what happens when everyone starts booking profits after a small bounce?
You get limit sell orders piling up , slowing momentum — sometimes even flipping the trend.
And then what do big players do?
Then come back in — buying at higher levels, averaging their positions. Not the best case scenario....
Key Takeaway:
______________________
Here’s my advice — especially if you’re in this game long-term:
1. Avoid those super obvious setups everyone else is jumping into.
2. Instead of asking, "Why should I open a trade now?"
Try asking: "Why shouldn’t I open a trade now?"
p.s.
If you liked this kind of deep-dive — follow along. We don’t just read charts. We read the market behind them.
Conclusion:
_________________________
📍 Gold is testing a key zone — but don’t let the crowd pull you in.
🧠 The first quick impulse is often a trap
📈 Stay sharp, stay ahead.

H1 pullback in bullish H4 mThe market is at a point where we must sell, it's at a maximum of Elliott Waves, wave 5 is already extremely extended, so prepare for a mega drop of several weeks while everyone continues to buy at the lows, it will continue to go down. In summary, we have a bullish market on H4, now there will be a correction on H1, that is, a bearish trend on H1 for several weeks; it is not an ABC, but 5 bearish waves
Gold Spot / U.S. Dollar

Market Structure AnalysisMarket Structure Analysis
HH (Higher High) and HL (Higher Low) labels indicate the prior uptrend structure.
The recent price action shows consolidation and potential trend reversal or correction.
🟦
Highlighted Zones
Supply Zones (resistance): Marked in light teal rectangles near the top of price action (e.g., around 3,400).
Demand Zones (support): Marked below the current price (e.g., around 3,360 and lower near 3,320).
🔄
Ch0CH (Change of Character)
A “Ch0CH” label is marked — this typically signals a potential shift in market structure (e.g., from bullish to bearish).
This is further supported by the price breaking below a previous higher low.
📉
Trade Setup
Red Zone: Indicates the stop-loss region.
Green Zone: Indicates the take-profit target.
A short (sell) position is implied here, expecting price to drop from the current level to the lower demand zone.
🔁
Projected Price Path
A dotted white line projects a potential bearish move, with a minor retracement before continuation down to ~3,328.

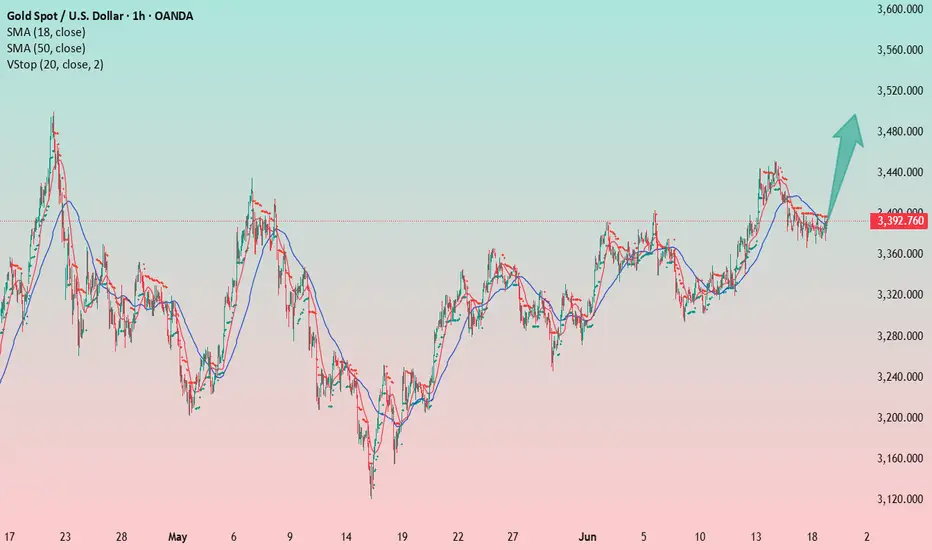
Gold Eyes New Highs Amid Ongoing UptrendGold continues its upward trend. On the daily, weekly, and monthly charts, the price remains within the trend structure.
On the hourly chart, a strong consolidation pattern has formed. I expect a breakout to the upside toward previous highs, with potential for a new all-time high and a move toward the $4,000/oz zone.
I'm going long at the current level.
Stop-loss is placed below yesterday's low.
Waiting for the rally!
XAUUSD Elliotwaves update: Is wave 4 complete?On our previous view we were expecting a wave c to the upside that will complete wave B of higher degree. It looks like wave B is completed with an ending diagonal. Now what I am anticipating is price to drop to complete wave 4 in higher degree. However, if wave 4 is complete then the move up might be a leading diagonal for wave 1 of 5. But all in all the the current bias is to the downside and therefore to take advantage of the move to the downside one should find areas where price will find resistance for a possible sell opportunity.

Fed expected to remain on hold and ‘likely’ a ‘Nothing Burger’It is widely regarded as a ‘sealed deal’ that the US Federal Reserve (Fed) will maintain the current target rate at 4.25% - 4.50% today, marking a fourth consecutive meeting on hold. This is likely to displease US President Donald Trump, who has repeatedly called for rate cuts, recently referring to the Fed Chairman Jerome Powell as ‘stupid’.
Despite Trump’s approach, I do not see a path where the central bank needs to cut rates today. While I would agree that the US economy is softening, it is not sufficient to ring alarm bells at the Fed. May’s inflation data were soft, suggesting stickiness and limited impact from tariffs, and domestic demand remains stable. Meanwhile, while the job market has demonstrated signs of weakening, the US remains at full employment. Couple this with vague trade policy and the recent escalation between Israel and Iran – with US involvement a possibility at this point – the Fed are unlikely to move on rates until later on in the year.
Markets are pricing in around two rate cuts this year (matching March’s Summary of Economic Projections ), targeting either the September or October meeting for the first 25-basis-point (bp) rate reduction. Were the Fed to throw a curveball and surprise markets by cutting rates by 25 bps today, it would trigger a sizable downside move in the US dollar (USD) and underpin a bid across the US equity market.
With that said, with a rate cut already baked in, the market’s focus will shift to the Fed’s rate statement, the press conference, and the updated SEP. Importantly, the fresh projections are the first out of the Fed since Trump’s ‘Liberation Day’ tariffs in early April.
Uncertain times
Uncertainty, although a somewhat overworked term at present, remains pertinent in today’s macroeconomic backdrop. Consequently, the Fed’s job of updating the dot plot (and the economic projections) is challenging. Like the market, Fed officials will struggle to gauge what the near-term future holds.
I would not be surprised to see Powell echo a similar sentiment to the one expressed at the March meeting. Nevertheless, it should not raise too many eyebrows to see the Fed adopt a more hawkish tilt in its updated projections, with a slight upward (downward) revision to inflation (GDP [Gross Domestic Product).
However, a marked change in direction in terms of lowering rates in the future from the Fed today is certainly something investors will be watching for, and could lead to increased volatility across major asset classes. If we see a dovish pivot, I will closely watch Spot Gold (XAU/USD), which has been hovering around all-time highs of US$3,500 for some time now.
Spot Gold trading at demand
A dovish scenario today could push the yellow metal towards the noted all-time high. As you can see from the chart below, daily flow has buyers and sellers squaring off within demand at US$3,343-US$3,392, which may provide enough of a floor to press higher today. In the event of a break south, the first port of call in terms of support would be at US$3,280, followed by another layer at US$3,208.
Written by FP Markets Chief Market Analyst Aaron Hill

Xauusd Next MoveHey All Im seeing Xauusd. Will fly on 3425 and its Break Resistance Level so put. On Buy and Fly with me lets gooo

GOLD Made Inverted H&S Pattern , Long Scalping Ready !Here is my 15 mins chart on gold and we have a reversal pattern , ( inverted head & shoulders ) and we have a clear closure above our neckline so we can buy it to get the target and then wait for the news tonight and then decide the new direction after news effect .

XAUUSD LONGXAUUSD Reach it back into the buying trend after make a breakout *Fakeout* and possible the price will react to the supply area that i marked.
I do not 100% confirm with my analysis will be right. It's all depends on the buyer and seller momentum. Due to we have a major issues in the middle east so trade wisely and stick with your own trading plan.
If you interested with my idea, do follow me now for more idea for XAUUSD.

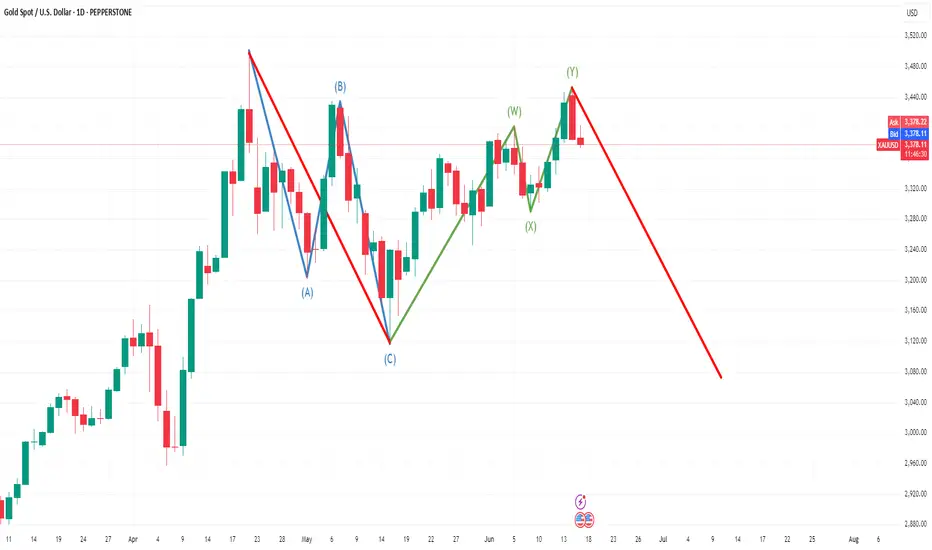
XAU/USD – Bearish Setup Developing After Complex CorrectionGold may be nearing the end of a complex double three (W)-(X)-(Y) corrective pattern, suggesting that the recent upside momentum could be exhausted and a larger degree bearish wave may be on the horizon.
🔹 Wave Structure Analysis
The initial decline completed an ABC Zigzag correction, labeled as Wave (A)-(B)-(C).
Price then rallied into a W-X-Y double three structure, with the second leg (Y) potentially complete as of the latest high.
The rejection at the recent swing high indicates potential distribution and the start of a new impulsive decline.
🔻 Bearish Outlook
If the count is valid, Gold may be starting a new bearish sequence, targeting lower support levels in the coming weeks.
A break below the short-term support (~$3,340–$3,320) could confirm the onset of a downward move.
Key bearish target zone: $3,120–$3,040, with potential extension toward $2,960 if momentum accelerates.
🛑 Invalidation Level
A daily close above Wave (Y) high (~$3,513) would invalidate the bearish thesis and indicate further upside continuation or a new impulsive structure.
📌 Conclusion:
Gold may have completed a complex corrective structure and is showing signs of weakness. If confirmed, this opens the door for a deeper corrective or impulsive move to the downside. Traders should watch for breakdown confirmation before entering shorts, with tight risk control above recent highs.
Gold Supported by Central Bank Demand Despite Global UncertaintyGold Prices Likely Supported by Central Bank Demand
Gold prices are expected to find continued support from strong central bank buying. Since the start of the Ukraine war, average annual central bank gold purchases have doubled from 500 to 1,000 tons.
The primary drivers remain gold’s role as a crisis hedge, portfolio diversifier, and store of value.
While de-dollarization is not an explicit motivation, many central banks anticipate a gradual decline in the U.S. dollar’s share of global reserves.
Technical Outlook:
Gold remains in bullish territory as long as it trades above 3365. This supports a move toward 3403, and if the price stabilizes above that level, the uptrend may extend toward 3430 and 3448.
A break below 3364 would invalidate the bullish structure and shift momentum downward, with potential targets at 3347 and 3322.
Key Levels:
• Resistance: 3403 / 3430 / 3448
• Support: 3365 / 3347 / 3322

Stick to shorting gold and holding itAlthough gold has risen sharply to around 3375 in the short term due to the dovish remarks of Fed officials, it has not made an effective breakthrough. Therefore, gold has not reversed its trend due to the short-term rebound. Gold is still in an obvious short trend. In the short term, gold is obviously under pressure in the 3365-3375 area. If gold fails to break through this resistance area, then after gold consumes a certain amount of long energy, gold shorts will counterattack again and are expected to retreat to the 3350-3340 area again.
In the case that good news cannot support the continued rebound of gold, the market's bullish confidence will be hit again, and the short confidence will be further strengthened, stimulating gold to accelerate its decline, and it is even expected to fall below the 3350-3340 area. Therefore, in short-term trading, I still advocate shorting gold, and I am currently holding a short position in gold, and I look forward to the accelerated decline of gold as expected!

Have you seized the golden opportunity again and again?Today, the strength of gold is very weak. It only rushed up at the opening, and quickly fell below the 3400 mark. Keeping above the key point of 3400, gold continues to be bullish. Now that it has fallen below 3400, the short-term has gone out of the small-level top, and the market is no longer so strong. For our short-term operations, the short-term correction of gold prices focuses on the daily cycle MA5 support, and the weekly MA5 support is long. The rebound focuses on the 3403-3408 resistance card. The rebound can be followed by the short-term! Although gold has fallen below 3400, the short-term direction has changed, but the general direction has not changed. It is still bullish. In the future, we still have the opportunity to look at the high point of 3500, but we have to wait for the bottom to stabilize. Now we can only follow the trend. We will do what the market does.
From a technical point of view, the current macd high dead cross in 4 hours has a large volume, and the smart indicator sto is oversold, which represents the 4-hour shock trend. The current bollinger band three-track shrinkage in 4 hours also represents the range compression. At present, the upper pressure of 4 hours is located at the adhesion point of the middle rail and the moving average MA10 at 3404-3409, while the support corresponds to the moving average MA30 and MA10 near the 3380-3363 line. From the current 4 hours, if the price is to fall directly, the rebound will not exceed the 3420-3422.5 line. The current macd dead cross of the gold 1-hour line is shrinking and sticking, and the smart indicator sto is running downward, indicating that the hourly line continues to fluctuate weakly. What we need to pay attention to now is the adhesion pressure of the upper moving average MA60 and MA30 corresponding to the 3412 line. Pay attention to the resistance of 3403 in the short term. Today's short-term operation of gold recommends rebound shorting as the main, and callback long as the auxiliary, and pay attention to the support of 3380-3370 in the short term.
