"GOLD XAUUSD 30M | Trendline Breakdown & Bearish Target at $3310Gold (XAUUSD) is respecting the descending trendline on the 30-minute timeframe with multiple rejections confirming the bearish structure.
The downtrend remains intact unless price decisively breaks above $3,370. A potential downside target near $3,310 remains in focus.
Ichimoku Cloud indicates selling pressure with resistance from the Kumo. Watch for price action confirmation near $3,342 support and $3,370 invalidation level.
Disclaimer: This is not financial advice. Trade at your own risk.
GOLDMINICFD trade ideas

Gold Slides Further as Market Risk Eases and Inflation LoomsGold Slides Further as Market Risk Eases and Inflation Looms
Gold continues to extend its downward momentum for the second consecutive week, sliding from 3451 to 3283—a decline of nearly 4.85% in just 10 days.
Today, all eyes are on the U.S. inflation data. While the broader market reaction remains uncertain, gold appears particularly vulnerable to further downside pressure.
The temporary ceasefire between Israel and Iran, coupled with advances in the U.S.-China trade talks, has eased geopolitical tensions, diminishing the immediate appeal of safe-haven assets like gold.
Even if prices rebound toward 3300 or even 3350 in a deeper pullback, the overall trend remains bearish.
PS: This analysis assumes normal market conditions and excludes the influence of potential manipulation.
You may find more details in the chart!
Thank you and Good Luck!
PS: Please support with a like or comment if you find this analysis useful for your trading day
Previous analysis:

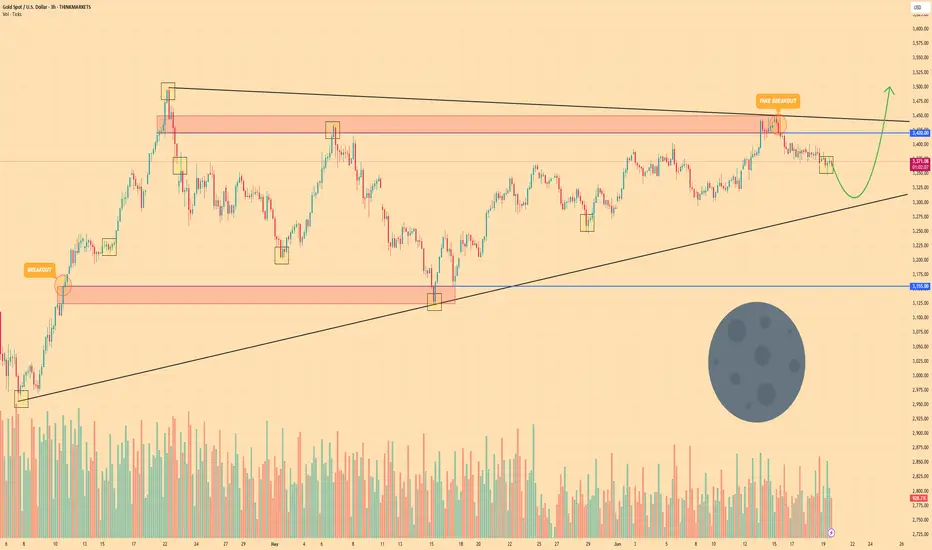
GOLD - Price may bounce up from wedge to $3500 points Hi guys, this is my overview for XAUUSD, feel free to check it and write your feedback in comments👊
A few moments ago, price entered to wedge, where it at once made an upward impulse from the support line.
Price broke $3155 with $3420 level and reached resistance line, but soon turned around and started to decline.
After this, Gold broke the $3420 level one more time and later tried to grow, but when it reached the resistance zone, it dropped.
Next, price bounced from support line of wedge and started to grow and in a short time rose to $3420 level.
Recently, it declined below, making a fake breakout of the resistance level, and now it continues to decline.
In my mind, Gold can decline a little more and then bounce up to $3500, breaking the resistance level.
If this post is useful to you, you can support me with like/boost and advice in comments❤️
Disclaimer: As part of ThinkMarkets’ Influencer Program, I am sponsored to share and publish their charts in my analysis.
XAUUSDExpecting price to open and decline a bit to then buy possibly for the rest of the week. Looking for Bulls to take over for as long as price respects the lows below after Monday headings candle formation the direction might be validated. If not right after Mondays open and low. If not then we might expect the opposite direction.

Gold: Breakout and Potential Retrace!!Hey Traders, in today's trading session we are monitoring XAUUSD for a selling opportunity around 3,390 zone, Gold was trading in an uptrend and successfully managed to break it out. Currently is in a correction phase in which it is approaching the retrace area at 3,390 support and resistance zone.
Trade safe, Joe.

Could the Gold bounce from here?The price is falling towards the pivot which acts as a pullback support and could bounce from this level to the 1st resistance which is also a pullback resistance.
Pivot: 3,337.35
1st Support: 3,294.91
1st Resistance: 3,413.32
Risk Warning:
Trading Forex and CFDs carries a high level of risk to your capital and you should only trade with money you can afford to lose. Trading Forex and CFDs may not be suitable for all investors, so please ensure that you fully understand the risks involved and seek independent advice if necessary.
Disclaimer:
The above opinions given constitute general market commentary, and do not constitute the opinion or advice of IC Markets or any form of personal or investment advice.
Any opinions, news, research, analyses, prices, other information, or links to third-party sites contained on this website are provided on an "as-is" basis, are intended only to be informative, is not an advice nor a recommendation, nor research, or a record of our trading prices, or an offer of, or solicitation for a transaction in any financial instrument and thus should not be treated as such. The information provided does not involve any specific investment objectives, financial situation and needs of any specific person who may receive it. Please be aware, that past performance is not a reliable indicator of future performance and/or results. Past Performance or Forward-looking scenarios based upon the reasonable beliefs of the third-party provider are not a guarantee of future performance. Actual results may differ materially from those anticipated in forward-looking or past performance statements. IC Markets makes no representation or warranty and assumes no liability as to the accuracy or completeness of the information provided, nor any loss arising from any investment based on a recommendation, forecast or any information supplied by any third-party.

gold ready for buy buying zone=3355-3360, gold is approaching a strong demand zone with confluence of fibonacci (0.5-0.61)levels.
possible structure shift to upside !
target= 3368-3388
final move can be 3410

XAUUSD-Gold stalls below $3350 as USD weakness continuesGold remains delicately balanced as traders in Asia and Europe proceed with caution. Despite recent USD weakness lending some support, buyers haven’t broken above $3350.
📉 USD Weakness & Market Sentiment – Fragile Recovery?
🔻 Dollar Wobbles: Talk of Fed leadership change is stirring doubt over the USD’s trajectory, adding political risk that may benefit gold.
⚖️ Mixed Sentiment: Gold consolidates in a tight range after early‑week drop. With PCE data and Fed speeches ahead, traders await the next catalyst.
📊 Technical Structure – Consolidation Underway
Gold trades below short‑term EMAs, hinting at a bearish pause or stealth accumulation. Current levels near $329X.
Key Zones:
🟢 Demand (Buy): $3264 / $3276 / $3294
🔴 Supply (Sell): $3313 / $3321 / $3330 / $3341
🎯 Intraday Trading Plan:
🛒 BUY ZONE: $3264–$3266 (SL: $3270; TPs: $3280 → … → $3320)
⚡️ BUY SCALP: $3282–$3284 (SL: $3278; TPs: $3288 → … → $3330)
📉 SELL ZONE: $3331–$3333 (SL: $3337; TPs: $3326 → … → $3300)
⚠️ SELL SCALP: $3313–$3315 (SL: $3320; TPs: $3310 → … → $3280)
🧭 Watchlist: Friday’s PCE, Fed commentary & Middle East tensions may sway price

XAUUSD : Ready for More Upside Before Another Fall ?By analyzing the gold chart on the 4-hour timeframe, we can see that price initially followed our bullish scenario, climbing 140 pips up to $3336. However, after hitting that level, gold reversed and entered the bearish scenario, dropping below $3300 and eventually finding support around $3255.
This area acted as a strong demand zone, and we’ve since seen a rebound. Currently, gold is trading around $3273, and as long as price holds above the marked demand zone (Bullish Rejection Block), we may expect another bullish move before price potentially targets the liquidity below $3245 and $3203.
Please support me with your likes and comments to motivate me to share more analysis with you and share your opinion about the possible trend of this chart with me !
Best Regards , Arman Shaban

GOLD - 1H TFHere are the 2 zones I'll be looking to add additional entries. Waiting for Wave 2 completion & a push up.
Zone 1 - Current CMP
Zone 2 - $3,338 - $3,332
Could even look for 'sell to buy' trades, depending on your risk appetite and risk management.

Middle East Tension & Markets: My Honest Stance🌍🕊️✌️ Middle East Tension & Markets: My Honest Stance 💣 🔥 🗡️
Hi everyone,
It’s Friday, June 20th — and we face a fragile moment: the uncertainty of possible US military action against Iran. 📉📰✈️
On my charts:
Bitcoin (BTC) reached key resistance and now ranges sideways as we await clarity.
Gold (XAUUSD) remains the classic safe haven — it holds an ascending structure, but profit-taking could trigger dips if markets crash.
Silver (XAGUSD) is similar, yet needs broader industrial strength to outperform gold.
Crude Oil (WTI) could spike dramatically if bombs fall — but I choose not to profit from pain.
USDJPY & USD pairs reflect global trust in the dollar and US stability — I’ll cover this more next week.
My personal stance is simple:
💙 I never short disasters. I never profit from human suffering. I am LONG on humanity and peace. 🕊️✌️🌈
👉 I expect potential market gaps between now and Monday:
✅ Bad news (war) → gold, silver, oil likely pump
✅ Good news (diplomacy) → risk assets rebound, oil stabilizes
I am positioned carefully with small risk and clear stops. My goal: protect my capital, trade my plan, but never bet on pain. If I lose because peace prevails — I win as a human.
Stay safe, trade wisely, and never forget: sometimes the best trade is no trade at all.
One Love,
The FXPROFESSOR 💙
Disclosure: I am happy to be part of the Trade Nation's Influencer program and receive a monthly fee for using their TradingView charts in my analysis. Awesome broker, where the trader really comes first! 🌟🤝📈

XAUUSD STOP HUNT PROOFa proven risk management psychology......i knew whats on the way ....price must go down .....i need friends ...lets connect and scale up to the moon

RiseGold technical outlook is bullish.Gold touches an important area of interest now.The best area to buy gold. Not financial advice. Technical point of view.
DeGRAM | GOLD broke the demand zone📊 Technical Analysis
● Price sliced beneath the long-term rising‐channel base and the triangle apex, turning 3 300-3 310 into fresh supply; the current pull-back is a textbook bearish retest of the break zone.
● Hourly structure now tracks a new descending trend-line; failure to reclaim 3 300 keeps momentum pointed to the next fib / horizontal shelf at 3 280, with the channel width projecting 3 245 support.
💡 Fundamental Analysis
● Rebound in US 2-yr yields after hawkish Fed speakers and a stronger-than-expected durable-goods print lifted the DXY, reducing short-term bullion appeal.
-------------------
Share your opinion in the comments and support the idea with a like. Thanks for your support!

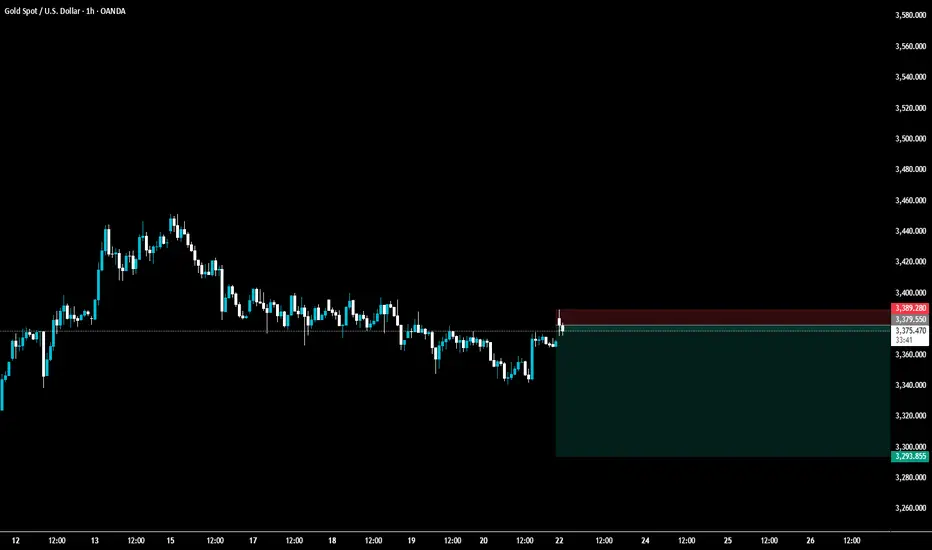
GOLD: Long Signal Explained
GOLD
- Classic bullish formation
- Our team expects pullback
SUGGESTED TRADE:
Swing Trade
Long GOLD
Entry - 3306.4
Sl - 3294.6
Tp - 3332.6
Our Risk - 1%
Start protection of your profits from lower levels
Disclosure: I am part of Trade Nation's Influencer program and receive a monthly fee for using their TradingView charts in my analysis.
❤️ Please, support our work with like & comment! ❤️

Gold Drops on Israel-Iran CeasefireGold prices declined as safe-haven demand eased following President Trump’s announcement of a ceasefire between Israel and Iran. Despite the pullback, gold remains up nearly 23% year-to-date, supported by ongoing geopolitical tensions, economic uncertainty driven by Trump’s tariffs, and robust central bank purchases.
Market Focus:
All eyes are now on U.S. Federal Reserve Chair Jerome Powell’s testimony, which may offer fresh insights into potential near-term interest rate cuts.
Technical Outlook:
Gold remains under bearish pressure as long as it trades below the 3329–3339 pivot zone.
A confirmed 4H candle close below 3329, or especially 3309, would further validate downside momentum toward the support range.
Support Levels: 3302, 3281, 3256
Resistance Levels: 3364, 3393
A clear break below 3302–3281 would open the path toward deeper bearish continuation.

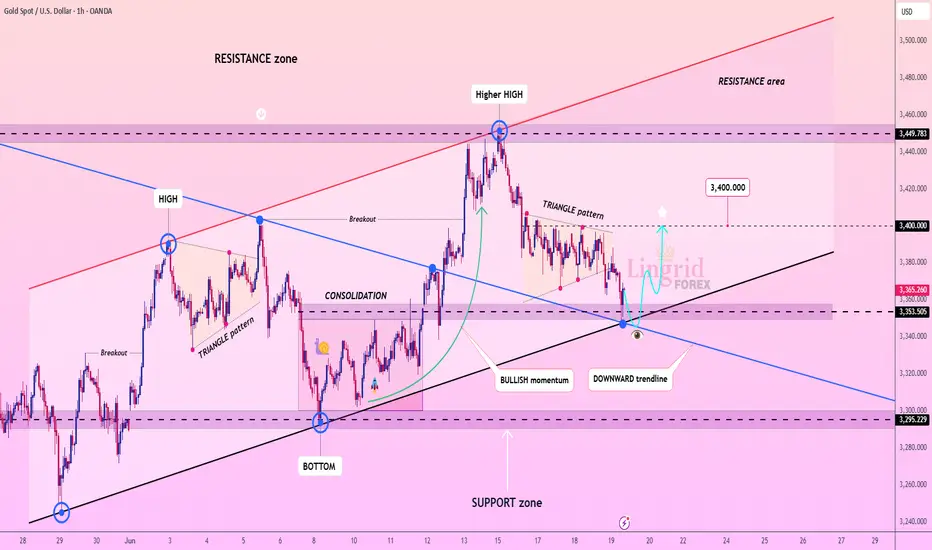
Lingrid | GOLD Post-FOMC Price Creates Trading OpportunityOANDA:XAUUSD is pulling back into the confluence zone between the black trendline and the 3,353–3,355 support, aligning with the breakout zone of a previous triangle pattern. Despite the drop, the overall structure remains bullish, especially if this retest holds. A bounce here would confirm the upward channel continuation toward the 3,400 key level.
📈 Key Levels
Buy zone: 3,350–3,355
Sell trigger: breakdown below 3,353
Target: 3,400
Buy trigger: clear bullish reversal from trendline support
💡 Risks
Break below 3,353 may shift bias to neutral or bearish
Sharp dollar strength could weigh on gold's recovery
Failure to break above the triangle again may trap early buyers
Traders, if you liked this idea or if you have your own opinion about it, write in the comments. I will be glad 👩💻
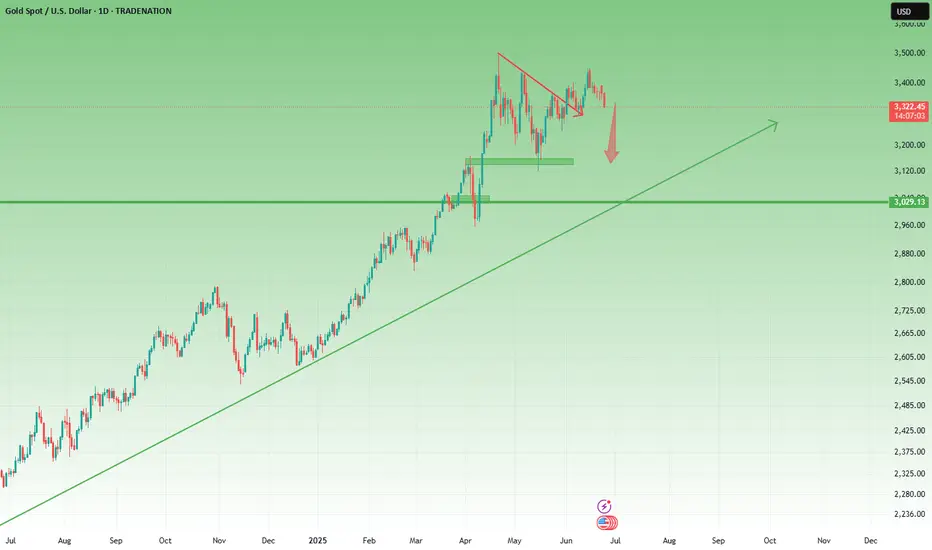
Gold - This is the official top!Gold - TVC:GOLD - might top out soon:
(click chart above to see the in depth analysis👆🏻)
Since Gold confirmed its rounding bottom in 2019 it rallied more than +200%. Especially the recent push higher has been quite aggressive, squeezing all bears. But now Gold is somehow unable to create new all time highs, which could constitute the a top formation.
Levels to watch: $3.500, $3.000
Keep your long term vision🙏🙏
Philip (BasicTrading)

XAUUSD 4H Chart – Trendline Break and Retest in Play"Gold (XAUUSD) on the 4H timeframe has broken below the ascending trendline and is currently in the process of retesting the previous support, now turned resistance. If the retest holds, further downside is expected towards the 3123 level, as marked on the chart. Ichimoku Cloud also shows a bearish outlook, supporting the potential drop. Traders should watch price action closely around the retest zone for confirmation."
This is not financial advice .

Gold Fails to Hold the Fear – Ceasefire Triggers 500+ Pip DropIn yesterday’s analysis, I pointed out that despite the weekend escalation in the middle-east, which triggered a gap up in Gold, the price action didn’t confirm the fear narrative. Gold failed to hold its gains – a clear sign of weakness.
📌 What happened next?
Throughout the day, Gold attempted multiple pushes toward 3400 – but each effort was met with strong selling pressure.
Then came the ceasefire announcement… and Gold dropped hard, now trading around 3320, locking in over 500 pips of profit from my short setup.
________________________________________
❓ More importantly, what’s next for Gold?
More important than the short-term noise is what the charts are now telling us:
📉 Weekly chart? Bearish.
🕯️ Daily chart? Also turned bearish after last week’s indecisive price action.
________________________________________
📌 Strategy remains the same:
I continue to sell rallies, and I’m now watching the 3280 support zone for a possible test in the coming hours.
Patience. Discipline. Let the market come to you. 🚀
Disclosure: I am part of TradeNation's Influencer program and receive a monthly fee for using their TradingView charts in my analyses and educational articles.
Gold Eyes $3,361 in Bearish Setup📊 Technical Analysis of Gold (XAU/USD) – 30-Min Chart
Chart Context:
Timeframe: 30-minute
Instrument: CFDs on Gold (USD/OZ)
Current Price: $3,386.282
Price Change: +14.757 (+0.44%)
Date: June 23, 2025
---
🔍 Key Observations:
1. Descending Triangle Formation
The chart shows a descending triangle, characterized by:
A flat support zone around the $3,351–$3,355 range.
A descending resistance trendline, suggesting lower highs over time.
This is typically a bearish pattern, indicating that sellers are pressuring price lower.
2. Breakout and Retest
There was a recent breakout above the descending trendline (highlighted with a blue move).
However, the price may be performing a false breakout or retest, as a downward arrow suggests a potential reversal back toward the support.
3. Volume and Market Sentiment
Although volume is not shown, the chart’s structure implies selling pressure is still dominant after each rally is rejected.
Price remains within a consolidation box, indicating indecision — but leaning bearish due to the triangle pattern.
---
🎯 Target: $3,361
The label "Target 3361" marks a likely support level if the bearish pattern plays out.
This is a measured move from the triangle height and structure, projecting downward from the breakdown point.
---
🛑 Support Zones
Strong demand zones highlighted in red between $3,325–$3,340.
If price breaks below $3,351, expect a drop to $3,325–$3,330, which are historical demand areas.

XAU/USD Bearish Pattern Analysis XAU/USD Bearish Pattern Analysis 📉
The chart presents a potential bearish continuation setup in the XAU/USD pair, highlighted by technical structures and key price levels:
📊 Technical Breakdown:
🔸 Bearish Rejection from Resistance
Price rejected strongly from the 3,440.000 resistance zone, marked with a red arrow.
This area has acted as a historical supply zone, triggering repeated reversals.
🔸 Descending Channel Formation 📉
A clear bearish flag/channel structure is visible post-rejection.
Price action broke down from the channel, signaling potential trend continuation.
🔸 Target Level 🎯
The expected target is around 3,304.374, aligning with previous support zones and structure lows.
This level coincides with a measured move from the channel breakdown.
🔸 Higher Lows Pattern Before Reversal ⭕
Prior to the current decline, the market formed a series of higher lows, highlighted with orange circles — suggesting a buildup before reversal.
🧭 Key Levels to Watch:
Resistance: 3,440.000 – 3,420.000 🔼
Current Price: 3,368.750
Short-Term Target: 3,304.374 🎯
Major Support: 3,140.000 – 3,160.000 🛡️
📌 Outlook:
The rejection from resistance coupled with the descending channel breakdown indicates bearish momentum. If the market maintains below the recent high, further downside towards 3,304 is expected. Break below this may expose deeper support zones.
📉 Bias: Bearish
⏳ Short-term Action: Watch for breakdown confirmation and momentum continuation.
