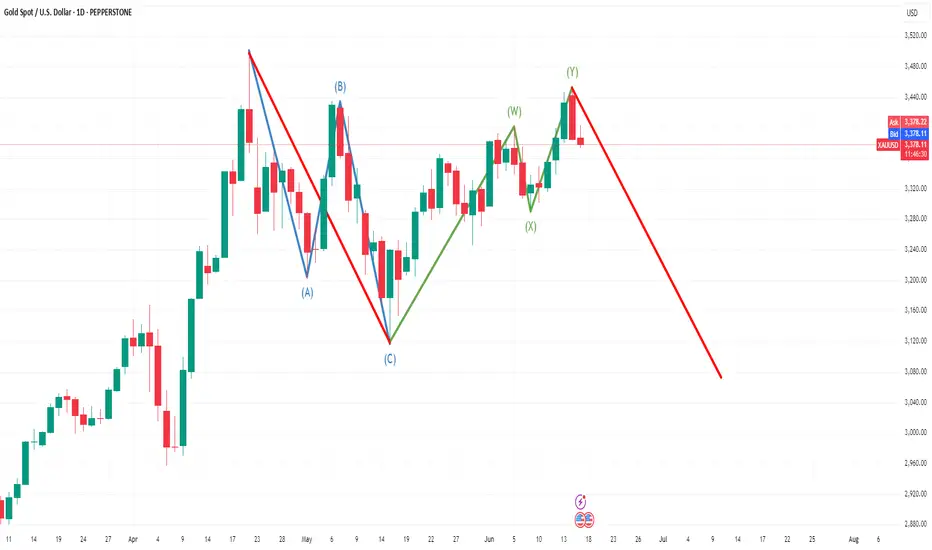
XAU/USD – Bearish Setup Developing After Complex CorrectionGold may be nearing the end of a complex double three (W)-(X)-(Y) corrective pattern, suggesting that the recent upside momentum could be exhausted and a larger degree bearish wave may be on the horizon.
🔹 Wave Structure Analysis
The initial decline completed an ABC Zigzag correction, labeled as Wave (A)-(B)-(C).
Price then rallied into a W-X-Y double three structure, with the second leg (Y) potentially complete as of the latest high.
The rejection at the recent swing high indicates potential distribution and the start of a new impulsive decline.
🔻 Bearish Outlook
If the count is valid, Gold may be starting a new bearish sequence, targeting lower support levels in the coming weeks.
A break below the short-term support (~$3,340–$3,320) could confirm the onset of a downward move.
Key bearish target zone: $3,120–$3,040, with potential extension toward $2,960 if momentum accelerates.
🛑 Invalidation Level
A daily close above Wave (Y) high (~$3,513) would invalidate the bearish thesis and indicate further upside continuation or a new impulsive structure.
📌 Conclusion:
Gold may have completed a complex corrective structure and is showing signs of weakness. If confirmed, this opens the door for a deeper corrective or impulsive move to the downside. Traders should watch for breakdown confirmation before entering shorts, with tight risk control above recent highs.
GOLDMINICFD trade ideas
XAUUSD Decline could move downsideXAUUSD Gold Price Analysis
Gold continues to face downside pressure amid ongoing sell-offs. After pulling back from recent highs, Gold is now approaching the 3400 level. However, selling pressure remains strong, especially following a weak rebound from the 3377 area, which signals limited buyer interest at current levels.
Key Points
Support Zone 3365/ 3340
Resistance zone 3400 / 3410
The US Dollar is gaining strength as a safe-haven asset, which is holding back Gold’s upward momentum. This shift in sentiment is driven by increasing caution in the markets ahead of key macroeconomic events:
Ps Support with like and comments for more better analysis share with you.
CHECK XAUUSD SIGNAL READ CAPTAINEntry: around 3350/3348✅
Take Profit 3355✅
Take Profit 2: 3364✅
Last Target: 3374✅
Stop Loss: 3339❌

GOLD: Move Up Expected! Long!
My dear friends,
Today we will analyse GOLD together☺️
The in-trend continuation seems likely as the current long-term trend appears to be strong, and price is holding above a key level of 3,348.30 So a bullish continuation seems plausible, targeting the next high. We should enter on confirmation, and place a stop-loss beyond the recent swing level.
❤️Sending you lots of Love and Hugs❤️

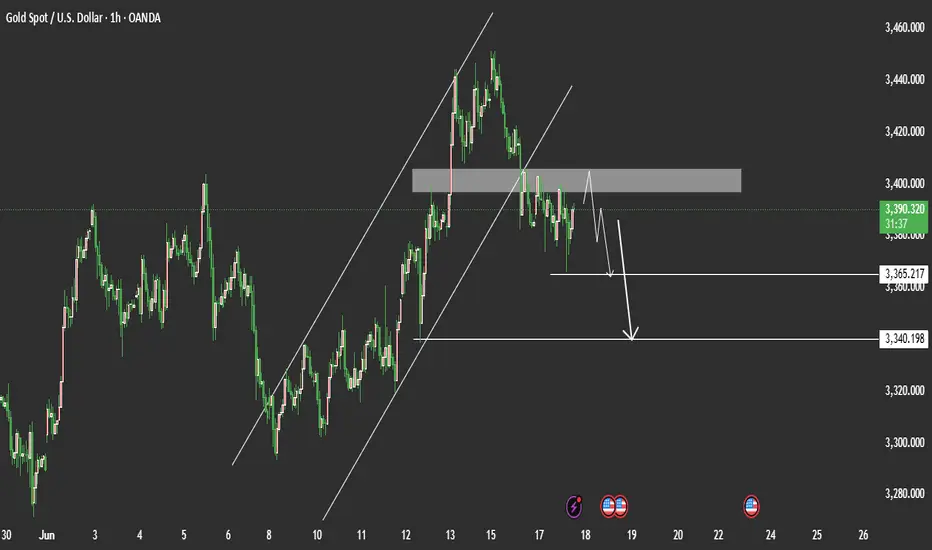
Bearish Outlook and Price Structure for XAUUSDHi there,
A bearish outlook for gold (XAUUSD) on the 1-hour timeframe, with a bias toward the 3,100 area, targeting the highlighted demand zones.
Price-Movement Structure
We observe a three-wave corrective pattern that appears complete at the 3,494.98 high. Key observations:
- **Wave (A)** : Initial correction from the major low.
- **Wave (B)** : Complex sideways consolidation.
- **Wave (C)** : Extension to new highs, creating liquidity.
The current price action suggests potential institutional distribution at the highs. I am expecting a drop to approximately 3,349.94.
However, fundamentals such as interest rates, dollar strength, and geopolitical risks remain key drivers of bullish optimism.
Happy Trading,
K.
Not trading advice

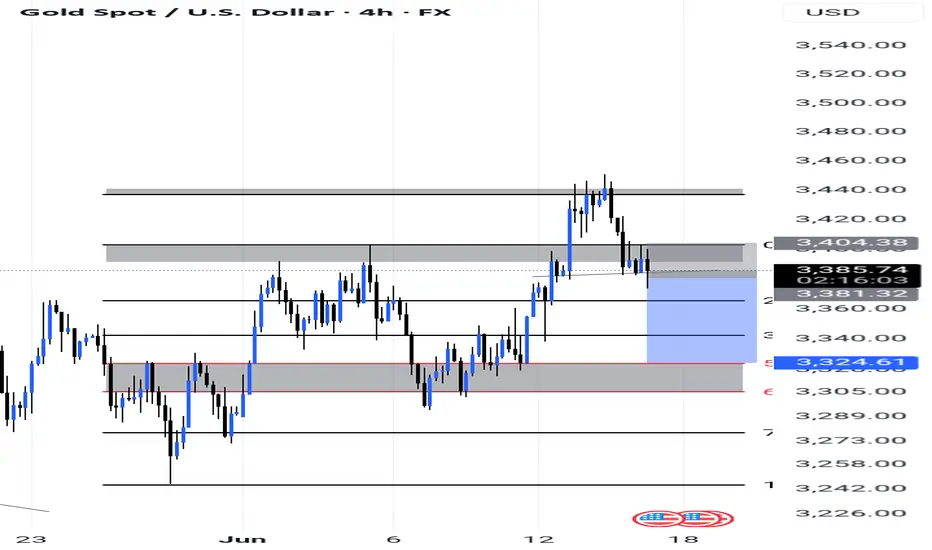
XAUUSD: Market Analysis and Strategy for June 20Gold technical analysis
Daily chart resistance 3450, support 3338
4-hour chart resistance 3372, support 3338
1-hour chart resistance 3363, support 3340
After the sharp drop at the beginning of this week, the bulls were weak, and each rebound was swallowed by a larger decline. Although there was a counterattack, the overall trend was oscillating downward. Yesterday, it rebounded from above 3362 to 3387, and then fell below 3362 to set a new low at 3347.
After today's shock, it broke through the low of 3347 again and fell to 3340. The short-term trend was weak. The Asian session high was at 3370, and the second high was at 3375. The ideal position is to rebound around 3370/75 during the day and choose to go short. Short-term shocks and declines can wait for rebounds and then go short. It is also easy to rebound quickly after the decline. If the support of 3340/38 is maintained, you can try to buy on the scalp. The second consideration is to sell in advance near 3356 to prevent weakness without a pullback and the NY market directly falling to a new low

Have you seized the golden opportunity again and again?Today, the strength of gold is very weak. It only rushed up at the opening, and quickly fell below the 3400 mark. Keeping above the key point of 3400, gold continues to be bullish. Now that it has fallen below 3400, the short-term has gone out of the small-level top, and the market is no longer so strong. For our short-term operations, the short-term correction of gold prices focuses on the daily cycle MA5 support, and the weekly MA5 support is long. The rebound focuses on the 3403-3408 resistance card. The rebound can be followed by the short-term! Although gold has fallen below 3400, the short-term direction has changed, but the general direction has not changed. It is still bullish. In the future, we still have the opportunity to look at the high point of 3500, but we have to wait for the bottom to stabilize. Now we can only follow the trend. We will do what the market does.
From a technical point of view, the current macd high dead cross in 4 hours has a large volume, and the smart indicator sto is oversold, which represents the 4-hour shock trend. The current bollinger band three-track shrinkage in 4 hours also represents the range compression. At present, the upper pressure of 4 hours is located at the adhesion point of the middle rail and the moving average MA10 at 3404-3409, while the support corresponds to the moving average MA30 and MA10 near the 3380-3363 line. From the current 4 hours, if the price is to fall directly, the rebound will not exceed the 3420-3422.5 line. The current macd dead cross of the gold 1-hour line is shrinking and sticking, and the smart indicator sto is running downward, indicating that the hourly line continues to fluctuate weakly. What we need to pay attention to now is the adhesion pressure of the upper moving average MA60 and MA30 corresponding to the 3412 line. Pay attention to the resistance of 3403 in the short term. Today's short-term operation of gold recommends rebound shorting as the main, and callback long as the auxiliary, and pay attention to the support of 3380-3370 in the short term.

Bearish Technicals prevailedTechnical analysis: Despite the strong Bearish candle sequence on the DX (few percents down), Gold remains on losses however above my Support for the session as the U.S. session approaching and geo-political tensions resurfacing. However, #3,395.80 is new Resistance zone made by the Hourly 4 candlestick configuration. Gold is pulling back again after it failed to break above it’s Resistance variance (#3,388.80 - #3,395.80 - #3,402.80) on the Hourly 4 chart, while #3,352.80 benchmark configuration is protecting the eminent downtrend. This sequence is similar to the September #24 - #28 pattern when a Double Bottom was made before the strong rebound. Also current Gold's impulse and rejection was Highly correlated with the side Swings on the Bond Yields market, happening on Hourly basis. As discussed, Gold is Trading within Descending Channel and that fractal is Buying back every dip and postponing the downtrend and pointing me that Gold should be timed for consolidation session (regarding Short-term). I am looking to complete a full oscillation towards #3,327.80 if #3,342.80 - #3,352.80 gives away, in the same time my main point of interests. I am expecting recovery however within #1 - #3 sessions if DX extend the Selling sequence and remain with a Daily chart proportions decline. My practical suggestion would be to wait for a break-out and then make a move, since at the moment - there is a clash between Bearish Technicals on Gold and Fundamental war escalation uncertainty which could make Investors park their capital from Gold into more riskier assets - and vice versa. Consequently the current consolidation and another Bearish wave should come as no Technical surprise, only if Fundamentals do not arise Buyers of the market.
My position: As my Profit quota for the week / Month is already acquired, I will not take any more orders for today's session. I lean of course more to Bearish side Intra-day, however even if I engage, will be Scalp order rather than positioning myself for #10 - #20 point move.

GOLD IS READY FOR PUMPGold after printing a high it reverse and print higher low at fib level 0.618 and 0.782 which is golden key level for reverse and mostly likely print new high
Gold to ATH After rejection H4, Gold will go to previous top.
The trend still uptrend, weekly candle still also bullish. I predict there will be continuation uptrend

XAUUSD – GOLD BREATHER OR BREAKDOWN? UNLOCKING SMART MONEY ZONES🔍 MACRO & MARKET SENTIMENT SNAPSHOT
Gold witnessed a sharp pullback after an overextended rally during the Asian session — catching many off guard...
Meanwhile, the US Dollar climbed 0.7% on safe-haven demand and rising Fed rate speculation. Yet, gold’s dip appears more like a tactical liquidity sweep than a full-blown trend reversal...
🌍 Heightened geopolitical risks — especially escalating tensions between Iran and Israel, along with Trump’s latest remarks on Tehran — continue to fuel risk-off sentiment...
🛢️ Surging oil prices suggest capital rotation might be in play, as institutional flows shift between commodities and equities...
📝 Upcoming catalysts include the Fed’s interest rate decision and the US retail sales figures — any unexpected data could rattle markets and alter rate expectations swiftly.
📉 TECHNICAL STRUCTURE (M30 VIEW)
The metal corrected sharply after an aggressive upside move triggered by Asian FOMO...
EMA alignment (13, 34, 89, 200) is tightening — signalling potential early-stage trend reversal or consolidation...
Fair Value Gaps (FVGs) beneath current price levels highlight areas where smart money may be waiting to reload positions...
🎯 TRADE SETUPS
🔵 BUY ZONE: 3345 – 3343
Stop Loss: 3339
Target Levels:
3350 → 3354 → 3358 → 3362 → 3366 → 3370 → 3380 → 3400 → ???
🔎 Wait for clear bullish confirmation via price action or rejection candles during London or New York sessions before entry.
🔴 SELL ZONE: 3442 – 3444
Stop Loss: 3448
Target Levels:
3438 → 3434 → 3430 → 3425 → 3420 → 3410 → 3400
⚠️ Only consider shorts on clean rejection from resistance, supported by strong bearish signals — avoid speculative entries in high-volatility conditions.
🧠 FINAL THOUGHTS
Gold is operating within a classic smart money framework — stop hunts, liquidity grabs, and stealth accumulation...
In uncertain macro conditions, precision and timing matter more than ever. Don’t chase the move — let price come to your level.
📌 Stay tuned for live updates during the Fed press conference and New York session.

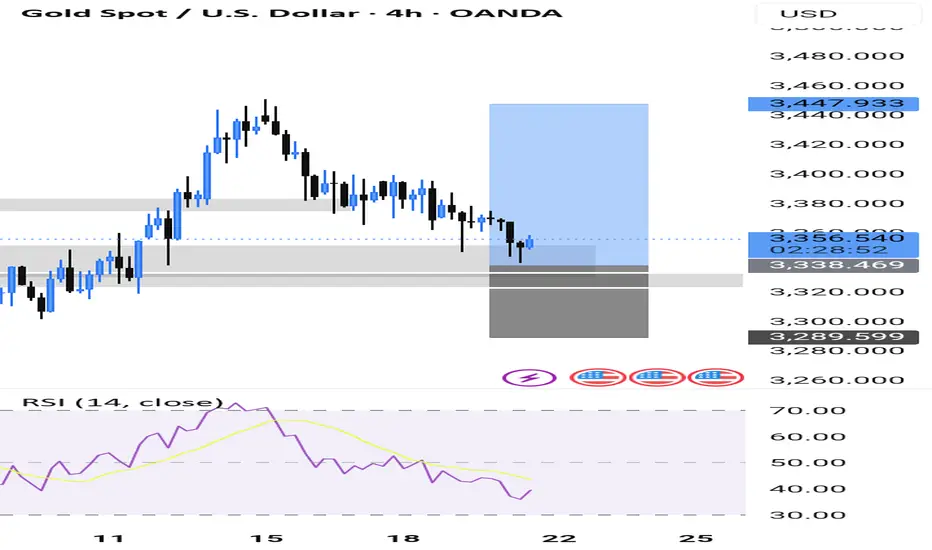
Gold (XAU/USD) 4-Hour Analysis- 20 June 2025On the 4-hour chart, gold has been trading in a fairly wide range.
The market has not clearly broken down, and many analysts see it as still structurally bullish as long as key support holds. Currently price is pulling back toward a confluence of support around $3,353–$3,355 (a zone overlapping a trendline and prior demand).
In other words, buyers have defended roughly the 3,340–3,355 area recently. Resistance lies just above in the $3,370–$3,380 region, with a major psychological pivot at $3,400. One analyst notes gold is “boxed between resistance at $3,450 and support at $3,340–$3,335”, so the immediate bias depends on these zones.
A clean break above 3,380–3,400 would signal bullish continuation (targeting 3,450+), while a drop below the 3,340–3,350 support zone would shift the bias bearish.
Overall, the market structure on H4 is mixed-to-bullish: we see higher swings in larger timeframes, and only a minor short-term down leg so far. As one analysis notes, gold remains “structurally bullish” and an upside break could chase the $3,500–$3,550 area.
Key Zones and Levels (4H)
Strong Support (Demand) Zone: ~$3,340–$3,355. This zone (around the recent swing lows) has attracted buying. Analysts mark $3,350–$3,355 as a key buy zone. Breaking below ~$3,340 would be a warning, putting 3,300 as the next floor.
Supply Zone / Resistance: ~$3,370–$3,380. This is the near-term resistance cluster (multiple analysts cite 3,370–3,380 as key). A rejection here would keep gold rangebound.
Major Pivot: $3,400. This round number is acting as an important hurdle. A decisive close above $3,400 would open the door to the $3,434–$3,450 area (prior highs). Conversely, failure at $3,400 can push price back toward the support zone.
Larger Resistances: If the uptrend resumes, look to ~$3,450 (April swing high) and beyond. Many long-range targets point to $3,500+ in a strong bull move.
Secondary Supports: Below the main support zone, watch ~$3,300 and down at $3,281 (the 50-day moving average). These act as deeper floors if weakness continues.
4-Hour Bias
In plain terms, as long as $3,340–$3,355 holds as support, the bias tilts bullish or neutral. We can say bullish bias above that zone: buyers will look to enter on pullbacks there. If price stays under $3,370, gains will likely be capped short-term. A break above $3,380/$3,400 would confirm a bullish breakout. On the flip side, a break below $3,340 shifts us to a bearish bias, with attention turning to lower support levels. On indicators, shorter-term momentum has eased (recent RSI is flattening around 60), suggesting some fatigue. But the longer-term trend is up, supported by strong safe-haven demand (central bank buying, geopolitical risk).
In summary: neutral-to-bullish on 4H, favor buyers near support but cautious near overhead supply.
Intraday (1H) Setups
Zooming into the 1-hour chart, we look for trades that align with the above bias. The clearest setups involve buying around demand zones and selling near supply areas:
Buy the Dip (~$3,344–$3,355): Wait for gold to dip into the 3,340–3,350 area. If you see a bullish price-action signal (e.g. a clear hammer or bullish engulfing candle), that’s a potential buy. Place a stop just below (~$3,335). Initial targets are around $3,370–$3,380 (near resistance). For example, one analysis suggests: “Buy XAU/USD at 3,344–3,348, TP 3,365–3,370, SL 3,335”.
Sell the Rally (~$3,375–$3,380): If price runs up to $3,375–$3,380 and shows signs of stalling (e.g. bearish candle), consider a short. Stop would be just above (~$3,385), with a target back down toward $3,355–$3,360 or the 1H demand zone. (One example from analysis: “Sell XAU/USD at 3,375–3,380, TP 3,355–3,360, SL 3,385”.) This aligns with fading the high of the range.
Breakout Strategy: If momentum is strong and gold breaks convincingly above ~$3,380–$3,400 on the 1H, one can enter long on the breakout. The next resistances are ~$3,434 and $3,450.
Stops should be very tight in that case (just under the breakout candle).
Risk Management: Keep position sizes small (1–2% risk). Use stops under/above the structural levels. Always wait for a clear 1H candle signal before pulling the trigger, to avoid false moves.
Key 1H levels: We can cite the strong short-term zones: support ~$3,344–$3,348 and resistance ~$3,375–$3,380.
If price skims these areas, watch carefully for a signal to buy or sell as described above. If 1H breaks below $3,340, be ready for a move toward the lower demand zone (around $3,335) or even $3,300–$3,280.
Takeaway
Gold is currently trading between ~$3,340 and $3,380 on the 4H chart. The simplest guidance is to trade the range: buy on dips near $3,340–$3,355 with stops just below, aiming for the $3,370–$3,380 area, and sell near $3,375–$3,380 if rallies stall. Maintain a bullish tilt as long as that $3,340+ support holds, but be ready to switch bearish if gold decisively closes under ~$3,340.
Single Takeaway: Treat ~$3,340–$3,355 as a key demand zone – a bounce here would be a high-probability long entry (targeting $3,370–$3,380), whereas a break below would turn the bias lower.

Gold Spot / U.S. Dollar (XAU/USD) 4-Hour Chart4-hour chart displays the price movement of Gold Spot against the U.S. Dollar (XAU/USD) from early June to mid-June 2025. The price, currently at $3,350.76, has experienced a recent decline of $19.76 (-0.59%) as of 01:06:10. The chart highlights a downward trend with a shaded area indicating a potential support or resistance zone between $3,310.41 and $3,374.21. Key price levels are marked, showing fluctuations between $3,300.00 and $3,374.21 over the observed period.

XAUUSD Analysis todayHello traders, this is a complete multiple timeframe analysis of this pair. We see could find significant trading opportunities as per analysis upon price action confirmation we may take this trade. Smash the like button if you find value in this analysis and drop a comment if you have any questions or let me know which pair to cover in my next analysis.

GOLD (XAUUSD) – Wave b Complete? Preparing for Wave c RallyGold tapped into the key demand zone and swept sell-side liquidity (SSL) beneath wave (iii) lows.
A five-wave decline appears complete, with wave (v) of b terminating just below the o.618 fib extension at 3344.86.
🟢 Wave c projection now in focus — looking for a 5-wave impulsive rally to develop.
Targeting the Sell Zone between the 0.5–0.764 retracement (3395.87–3425.07).
🧠 Structure Notes:
✅ Imbalance Zone (IMB) formed during the breakdown has now been tapped
🔻 SSL swept + bullish reaction = potential change of state
🟢 Wave (i) and (ii) projection underway – price needs to maintain structure above 3357.43 for bullish continuation
Targets: 3408.81 (0.618 Fib)
Invalidation below: 3340.31
Momentum and RSI divergence support reversal

Report – June 20, 2025EU–US Trade Dynamics: Strategic Delay, Political Risk, and Economic Recalibration
The European Union is now pivoting toward a “UK-style” deal with the United States, marking a key shift in strategy as the July 9 reciprocal tariff deadline imposed by President Trump looms. At stake is a potential escalation of U.S. tariffs from 10% to 50% on EU goods, including wine, whiskey, cars, and steel — products vital to EU member states’ exports.
Senior German and Commission officials now favor deferring a full trade deal in favor of a staged agreement, keeping some tariffs in place while avoiding immediate retaliation. This aligns with internal division within the EU: France favors reciprocal retaliation, while Italy and Hungary prefer maintaining dialogue to avoid a trade war.
From a macro perspective, the EU appears willing to accept sectoral trade-offs and quota adjustments, including concessions in sensitive areas like autos and agricultural exports. The €198 billion EU goods surplus with the U.S. remains a political flashpoint, with Brussels offering increased LNG and defense purchases to placate the U.S.
Market Implications:
Avoid positioning in European exporters heavily exposed to U.S. retaliatory risk (autos, wine, luxury).
Monitor USD/EUR, as any tariff escalation would hurt the euro short-term.
Watch defense and LNG stocks for inflows tied to strategic purchases.
-----------------------------
SNB Rate Cut to 0%: FX Stabilization Over Stimulus
The Swiss National Bank (SNB) cut its policy rate to 0.00%, citing deflationary pressures and a surging franc, which is up 10% YTD versus the U.S. dollar. Swiss CPI came in at -0.1% YoY in May, a rare and politically sensitive contraction.
The SNB stopped short of reintroducing negative rates but left the door open if the deflationary impulse persists. Traders had priced in a deeper cut, prompting a franc rally on the decision and a 10Y yield rebound to -0.09%.
Chair Martin Schlegel emphasized caution, citing saver impact and pension fund distortions as constraints on policy innovation. The SNB’s stance is now materially diverging from the Fed’s hawkish hold and the BoE’s slow easing path.
Market Implications:
CHF strength likely capped unless further easing surprises.
Short Swiss sovereigns (2–5Y) could be tactical shorts if inflation turns up.
Supports EUR/CHF tactical longs as the ECB eyes dovish alignment.
----------------------------
Biofuels Surge: Strategic Rotation From Crude Amid Iran–Israel Escalation
Biofuel feedstocks, especially soybean oil (+11%) and palm oil (+6%) are spiking amid the Israel–Iran conflict, rising Brent prices, and U.S. political support for agricultural energy substitutes. Trump’s EPA proposal calls for a 67% increase in biomass diesel mandates, benefiting U.S. farmers and biofuel refiners.
This proposal, combined with reduced compliance credit access for foreign feedstocks, advantages domestic production over imports (notably Canadian rapeseed and Chinese used oil). It also aligns with a swing-state election strategy, as soybean growers in Iowa remain key to Trump’s base.
Market Implications:
Long soy/palm oil and related ETFs (e.g., SOYB).
Long U.S. agricultural input and biofuel refiners (ADM, BG, REGI).
Monitor Brent–biofuel spread for continued divergence on geopolitical headlines.
----------------------
Tanker Markets Signal Energy Supply Risk Premium
Rates to charter oil tankers through the Strait of Hormuz, which handles ~20% of the world’s seaborne oil have more than doubled since Israel’s attack on Iran. VLCC (Very Large Crude Carrier) rates from the Gulf to China rose from $19,998 to $47,609/day, far outpacing the broader 12% rise in global tanker indices.
Shipping firms are hesitant to transit the strait, with many demanding “risk premiums” or re-routing. Compounding the issue, Iran’s sanctioned “dark fleet” may now be avoided altogether, forcing buyers to seek compliant vessels, tightening supply.
A reported collision between Frontline’s Front Eagle and a dark fleet tanker underscored the operational risks in this vital corridor. Traders are increasingly pricing in oil flow bottlenecks, which, if realized, could push Brent well above $85–90/bbl.
Implications:
Long tanker stocks (e.g., Frontline, Euronav) on rising charter rates.
Risk-off hedges in Brent futures, oil volatility, and Gulf-exposed equities.
Long pipeline or refined product ETFs in event of sustained disruption.
---------------------------------
U.S. Steel “Golden Share”: Strategic M&A Gets Political
The Trump administration’s decision to insert a “golden share” into Nippon Steel’s $14.9B acquisition of U.S. Steel sets a critical precedent. The U.S. now retains veto rights over major operational decisions without owning equity, a move unseen since Cold War-era defense deals.
While framed as a one-off, lawyers and multinationals are sounding the alarm. The “golden share” gives the government leverage over plant closures, sourcing policy, and capital expenditures, highly unusual for an open market economy.
Investors are worried this introduces deal uncertainty, foreign policy risk, and precedent creep into future M&A, particularly in critical sectors (defense, semiconductors, energy).
Implications:
Watch CFIUS-sensitive sectors: materials, semis, strategic tech.
Increased political risk premium for inbound foreign investment.
Traders may discount foreign bids or value U.S. corporates at a control-adjusted premium.
----------------------------------
FSB Flags Commercial Real Estate Systemic Risks
The Financial Stability Board (FSB) released a report warning of hidden fragility in the $12 trillion global commercial real estate market, citing:
12.6% delinquency rates in U.S. office CMBS
Debt-to-assets ratios >45%
High leverage in REITs and property funds across U.S., Canada, Germany, and Singapore
FSB warned of liquidity mismatches in property funds, growing non-performing loans at banks, and “complex interlinkages” between banks and shadow real estate lenders.
The Board’s message is clear: CRE remains a slow-burning systemic threat, and a shock such as a rate spike, recession, or refinancing wall, could catalyze contagion.
Implications:
Bearish CRE-focused REITs (office, retail), neutral industrial.
Long protection via CMBS CDS indexes or synthetic shorts.
Monitor banking exposure (esp. regional U.S., EU banks with high real estate leverage).
-----------------------------------
Microsoft–OpenAI: Strategic AI Rift Emerging
Microsoft may walk away from renegotiations with OpenAI over its transition to a for-profit structure. Discussions have stalled over equity allocation (debated range: 20–49%), revenue rights, and infrastructure priorities.
Microsoft currently enjoys:
20% rev share up to $92B
Exclusive rights to Azure deployment
Priority IP access before AGI
However, Microsoft’s growing skepticism and pivot toward xAI’s Grok model indicates a broader strategic hedge against OpenAI dominance. Microsoft believes AI models will become commoditized, and value will shift to apps and agents.
OpenAI, meanwhile, risks violating investor terms if it fails to convert. A delay could cause SoftBank to claw back up to $10B in committed capital.
Implications:
Monitor MSFT valuation for AI execution risk.
Long AI infra (NVDA, AMD) vs. short high-burn LLM firms if OpenAI deal stalls.
OpenAI IPO prospects now depend on rapid renegotiation or new lead investors.

XAUUSD – Is a Trend Reversal Brewing Amid US Debt Fears?While gold continues to hover within a tight trading channel for the sixth consecutive week, a major macroeconomic alarm has just been sounded — Goldman Sachs has flagged rising concerns over the trajectory of US debt. For Indian market participants, this could mark a turning point worth close attention...
🌐 MACRO PERSPECTIVE: US DEBT REACHING UNSUSTAINABLE LEVELS
America’s fiscal landscape is approaching a critical threshold. The national debt is projected to exceed previous wartime levels, and interest payments alone may cross $1 trillion by 2025 — eclipsing even core sectors like defense and healthcare.
Goldman Sachs has raised concerns that if no corrective fiscal steps are taken soon, the US could be forced into abrupt austerity measures — possibly shrinking GDP without significantly reducing the debt burden.
Key drivers: unchecked government expenditure, surging borrowing costs, and ongoing political polarization.
📌 For Indian gold traders, such economic vulnerability tends to weigh on the US dollar, fueling renewed interest in gold as both a safe haven and a strategic inflation hedge — assets long favored by Indian investors.
📉 TECHNICAL INSIGHT (M30/H1 UPDATE)
Price action on gold continues to respect a defined descending channel. The zone near 3,338.422 serves as a short-term pivot, while resistance looms at the upper channel line near 3,368.048.
The EMA ribbon alignment is pointing downward, reinforcing bearish momentum in the short term.
Should price fail to breach 3,368, we anticipate a retracement toward the Fair Value Gap (FVG) around 3,325.783, potentially extending deeper to the 3,309.256 zone.
✅ ACTIVE TRADING LEVELS
🟢 Buy Zone: 3310 – 3308
Stop: 3303
Targets: 3314 → 3318 → 3322 → 3326 → 3330 → 3340 → 3350 → 3360 → ...
🟢 Buy Scalp: 3325 – 3323
Stop: 3318
Targets: 3330 → 3334 → 3338 → 3342 → 3346 → 3350 → 3360 → 3370 → ...
🔴 Sell Zone: 3418 – 3420
Stop: 3424
Targets: 3414 → 3410 → 3405 → 3400 → 3396 → 3390 → 3385 → 3380
🔴 Sell Scalp: 3396 – 3398
Stop: 3403
Targets: 3392 → 3388 → 3384 → 3380 → 3375 → 3370
💬 INDIAN TRADERS – KEY TAKEAWAYS
As the week draws to a close, post-holiday volatility from the US market may introduce unexpected price moves. Be prepared for sudden spikes that could signal either a clean breakout or a smart money trap.
✅ Maintain discipline with your stop-loss and take-profit levels. Don’t chase the market — let it confirm your strategy. Gold remains technically bearish, but any fundamental catalyst — especially from US fiscal instability — could reverse the trend sharply.
Stay ready. Stay smart. Let the charts lead the way.


ZIG ZAG MOTION 15MINS, FRAMECHARTSThe GOLD pair has been on a move for 3 days now, with a ranging pattern within a channel around the price timeline between 3300+ and 3400 reacting to a firm line of resistance on an overall uptrend, as usual, I expect the price to break either of these levels before we look for trading opportunities.
NOTE: Please note that this is not financial advice, but rather an educated and speculative view of the expected outcome. Therefore, trade responsibly.

Trade Ideas For GOLD: Long and Short TRADE IDEA FOR SHORTS: Price may try to sell at Previous Day's High.
It may reject PDH following the order flow. US involvement will boost the
metals. Trump may announce or strike on the weekend.
TRADE IDEA FOR LONGS: The unmitigated demand level has broken structure.
Buyers here created new highs. So there may be a willingness to buy again from this level, considering the looming US involvement in Iran Israel war. I would be targeting the unmitigated sellers' block at 3.410.21

XAUUSD , 1D , Short Pattern is breaking Down , it is looking very good
Risk According to your Capital .

Short postionThe chart suggests a bearish setup, expecting price to drop from the current resistance.
Multiple support and resistance levels are drawn to identify reaction zones.
The price recently broke below a zone and might be retesting it (potential confirmation for a sell).
Daily Analysis- XAUUSD (Wednesday, 18th June 2024)Asian + London Session
Bias: No Bias
USD News(Red Folder):
-Unemployment Claims
-Federal Funds Rate
-FOMC Statement
-FOMC Economic Projections
Notes:
- Uncertainty on geopolitical tension
- No exact bias, waiting for FOMC
statement for indication
- Potential BUY/SELL if there's
confirmation on lower timeframe
- Pivot point: 3440,3350
Disclaimer:
This analysis is from a personal point of view, always conduct on your own research before making any trading decisions as the analysis do not guarantee complete accuracy.
