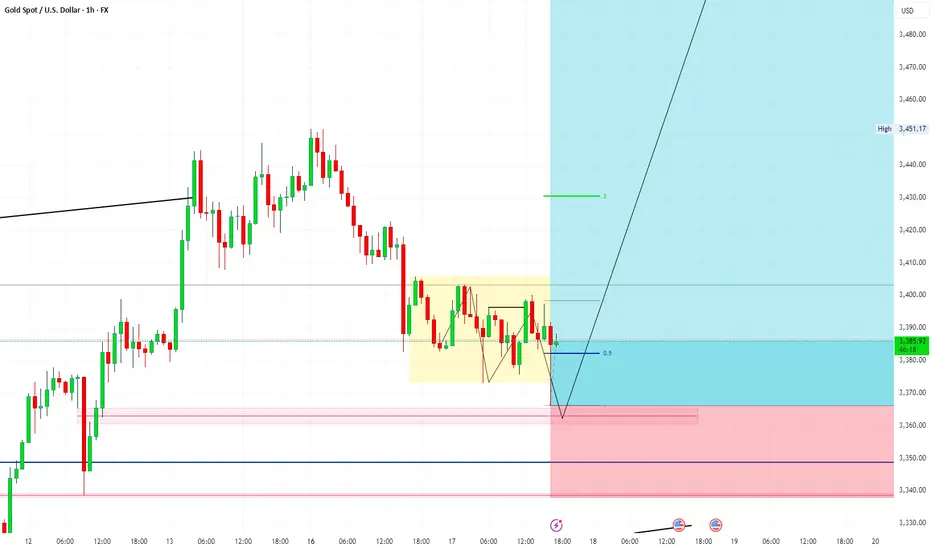
Will ASIA favor BULLS or BEARS?Two “if-this-then-that” scenarios
If price pushes above the recent swing high (~3 430–3 435)
→ Look for a move toward the 50% retracement zone at 3 415–3 416 (our next upside target).
If price drops below the recent swing low (~3 356–3 357)
→ It’ll likely slide down to the 21-day EMA at 3 342, which has acted like a magnet/bounce area.
Why the 21-day EMA matters
It’s sloping up beneath price (green trendline), so dips into it often spark fresh buying.
A buy-limit order around 3 342 gives you a low-risk entry with the trend still intact.
Overall bias
As long as gold stays above that rising trendline/21 EMA, the bulls remain in control.
Break the swing high → more upside.
Break the swing low → deeper pullback into support.
GOLDMINICFD trade ideas

Gold Big Sellthe markets are crushing soon , there will be a huge buy positions in Crypto and people will lose there interest in Gold
XAUUSD LongArea approached a level previous mitigated range, It took sellside liquidity aggressively which presents a strong move
XAUUSDAnother trade for today is once again from Gold—no surprises there! 😊
My strategy has just signaled a buy opportunity on the precious metal, and I wanted to share this setup with you as well.
🔍 Trade Details
✔️ Timeframe: 15-Minute
✔️ Risk-to-Reward Ratio: 1:2
✔️ Trade Direction: Buy
✔️ Entry Price: 3374.92
✔️ Take Profit: 3384.32
✔️ Stop Loss: 3370.21
🔔 Disclaimer: This is not financial advice. I’m simply sharing a trade I’ve taken based on my personal trading system, strictly for educational and illustrative purposes.
📌 Interested in a systematic, data-driven trading approach?
💡 Follow the page and turn on notifications to stay updated on future trade setups and advanced market insights.

Patience Before the Break: Gold Chart Signals Rally Toward 3,450 Technical Breakdown of the Chart
Key Concepts Used:
BOS (Break of Structure): Indicates a confirmed bullish break in market structure (around June 13).
MSS (Market Structure Shift): Marks a transition from bullish to bearish structure, which aligns with the swing high on June 14.
BSL (Buy-side Liquidity): Liquidity targets marked above recent highs (~3,420 and ~3,450).
Turtle Soup Setup: A classic fakeout reversal pattern, suggesting a stop-hunt below recent lows before a bullish move.
$$$: Liquidity Pool: Shows accumulation below before a breakout upward.
Bullish Case as Implied by the Chart
The chart suggests:
A liquidity sweep occurred at the recent low ("turtle soup").
Price is now rebounding from a demand zone, supported by bullish order flow.
If structure holds, price may:
Break above the minor high at ~3,410–3,420 (first BSL).
Continue upward toward ~3,450+ (second BSL), potentially reclaiming full bullish momentum.
Key Levels to Watch:
Zone Price Range Type
Demand 3,380–3,388 Support Zone
Target 1 ~3,420 Buy-side Liquidity
Target 2 ~3,450 Final BSL Target
If price breaks below the 3,380 zone with momentum, the bullish thesis weakens.
Summary:
Short-Term Trend: Bullish if support holds.
Liquidity Grab Complete: Signs of a reversal from turtle soup setup.
Upside Targets: 3,420 and 3,450.
Invalidation: Break and close below ~3,380

GOLD (XAUUSD) SELL SETUP – Triple Top Rejection Confirmed? Gold is currently testing a strong supply zone near the $3,450 resistance area for the third time. Each test has been followed by sharp rejections, forming a potential triple top pattern, which is a classic bearish reversal signal.
🔵 Key Levels to Watch:
Resistance: $3,450 – Strong supply zone (highlighted blue zone)
Mid Support: $3,032 – Previous structure support & demand
Major Demand: $2,647 – Long-term demand zone (orange)
🔻 Bearish Signals:
Price failed to break above the $3,450 supply zone
Strong bearish wick and rejection candle
Lower highs on RSI/MACD (not shown but worth noting)
📌 Potential Trade Idea:
Entry: Near $3,400–$3,450 zone
Target 1: $3,032 (mid-term support)
Target 2: $2,647 (long-term demand)
SL: Above $3,470 (clear invalidation)
🗓️ As we move toward July, a break below $3,300 could trigger momentum selling down to $3,000 and even $2,647.
💬 What’s your bias on gold this week? Are we heading for a major correction or another bounce?
#Gold #XAUUSD #Forex #TechnicalAnalysis #TripleTop #BearishSetup #SmartMoney #PriceAction #TradingView #LuxAlgo #SwingTrade #Commodities

XAUUSD Drop to daily support?XAUUSD After testing the daily resistance market has managed to reject with a momentum to daily 20ema early today. As we can see series of lower low and lower highs, price may continue to drop to daily 20ema again as, from weekly perspective we can see that price is pushing down to potentially to weekly key level of resistance.

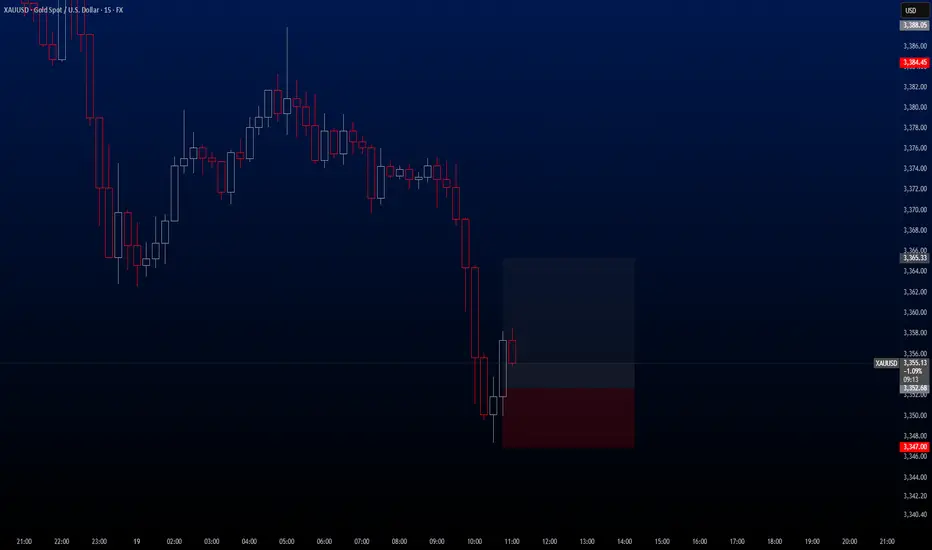
XAUUSD Hello traders,
There is a great opportunity for a buy trade on the XAUUSD pair, and I wanted to share it with you as well.
🔍 Trade Details
✔️ Timeframe: 15-Minute
✔️ Risk-to-Reward Ratio: 1:2
✔️ Trade Direction: Buy
✔️ Entry Price: 3352.68
✔️ Take Profit: 3365.33 / TP 2 / 3369.93
✔️ Stop Loss: 3347.00
🔔 Disclaimer: This is not financial advice. I’m simply sharing a trade I’ve taken based on my personal trading system, strictly for educational and illustrative purposes.
📌 Interested in a systematic, data-driven trading approach?
💡 Follow the page and turn on notifications to stay updated on future trade setups and advanced market insights.
Gold Breaks the Range: Trend Reversal or Just a Fakeout?XAUUSD – Gold Breaks the Range: Trend Reversal or Just a Fakeout?
After several days of sideways action, gold has finally broken out of its consolidation channel — but not upward. The price action signals uncertainty, while underlying global risks suggest a larger move may be brewing. With US markets closed for a bank holiday, low liquidity could lead to sharp, unexpected spikes — traders, stay alert.
🌍 Macro & Fundamental Outlook
📌 As widely expected, the Federal Reserve held rates steady, but Fed Chair Powell maintained a hawkish tone, warning that inflation risks remain due to ongoing geopolitical instability and rising commodity costs.
🔥 The gold market now hinges on two major geopolitical scenarios in the Middle East:
If the US intervenes diplomatically to ease tensions between Iran and Israel, gold may continue to correct further — possibly into the 3,325 – 3,300 range or lower.
However, if reports are accurate that Trump is coordinating with Israel for potential strikes on Iran, gold could spike aggressively as safe-haven demand surges toward 3,417 – 3,440.
📊 Technical Breakdown (M30 – H1)
Price has broken below the range-bound structure, suggesting a potential momentum shift to the downside.
The EMA cluster (13–34–89–200) is sloping downward, confirming bearish short-term pressure.
The 3,345 level has acted as support, but if it gives way, 3,325 becomes a critical liquidity zone where buyers may step in.
✅ Trading Plan
🟢 BUY ZONE 1: 3,325 – 3,328
Entry: Only after a clear bullish reversal (pin bar / bullish engulfing candle)
SL: Below 3,320
TP: 3,345 → 3,360 → 3,373 → 3,384
🟢 BUY ZONE 2: 3,345 – 3,348
Entry: On price retest and bullish confirmation
SL: Below 3,340
TP: 3,360 → 3,373 → 3,384 → 3,403
🔴 SELL ZONE: 3,417 – 3,440
Entry: If price rallies into resistance with no supporting fundamentals
SL: Above 3,445
TP: 3,403 → 3,384 → 3,360 → 3,345
💬 Final Thoughts
Gold is at a pivotal point. While today’s break could indicate a new leg down, we’ve seen countless false breakouts during low liquidity sessions. Only trade on confirmation — not emotion. Watch for geopolitical headlines and let price action guide your risk-adjusted decisions.
Stay patient. Stay sharp. Let the market prove itself before you do.

Review and Speculation for the 10 Elite PairsYou can follow us for more Analysis(Images and Videos) with Precise definition of the Financial Market.ENJOY!!!

Gold – Will Geopolitical Tensions Trigger a Breakout ?Hello traders, what’s your view on gold today?
So far, gold remains relatively quiet, with limited reaction to the initial FOMC statement. The market is clearly holding its breath ahead of the upcoming press conference by Federal Reserve Chair Jerome Powell.
As of now, the Fed is widely expected to keep interest rates steady at 4.50% – but the real question is: where does gold go next?
In my opinion, gold still holds long-term upside potential, especially with the ongoing military conflict between Israel and Iran, which could potentially pull the U.S. directly into involvement. For gold, this is an ideal environment to shine as a safe-haven asset. The greater the geopolitical risk, the more investors seek capital protection – and gold remains the go-to choice.
Technically, the first resistance level is seen at $3,400, followed by $3,440. On the downside, immediate support lies at $3,350, then $3,330.
Let’s see if gold holds its ground or prepares for the next big move.

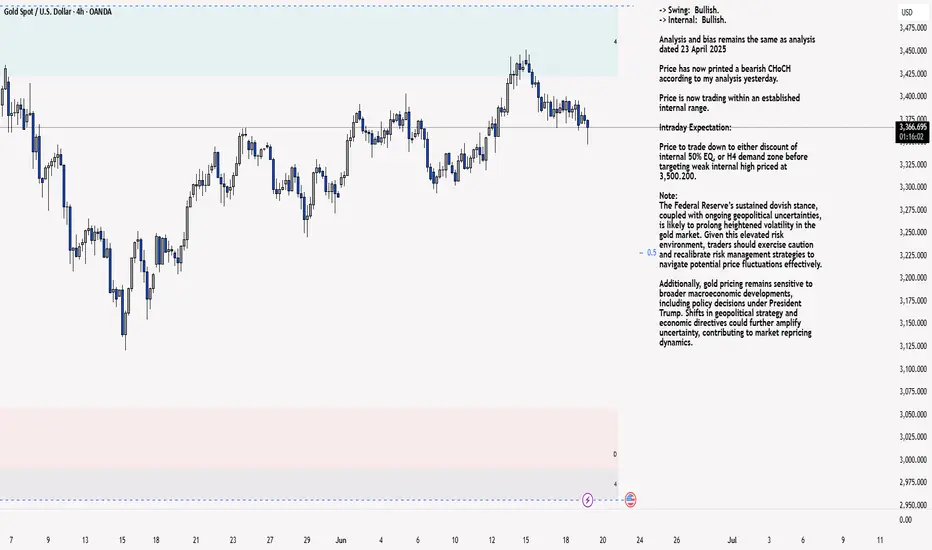
XAU/USD 19 June 2025 Intraday AnalysisH4 Analysis:
-> Swing: Bullish.
-> Internal: Bullish.
Analysis and bias remains the same as analysis dated 23 April 2025
Price has now printed a bearish CHoCH according to my analysis yesterday.
Price is now trading within an established internal range.
Intraday Expectation:
Price to trade down to either discount of internal 50% EQ, or H4 demand zone before targeting weak internal high priced at 3,500.200.
Note:
The Federal Reserve’s sustained dovish stance, coupled with ongoing geopolitical uncertainties, is likely to prolong heightened volatility in the gold market. Given this elevated risk environment, traders should exercise caution and recalibrate risk management strategies to navigate potential price fluctuations effectively.
Additionally, gold pricing remains sensitive to broader macroeconomic developments, including policy decisions under President Trump. Shifts in geopolitical strategy and economic directives could further amplify uncertainty, contributing to market repricing dynamics.
H4 Chart:
M15 Analysis:
-> Swing: Bullish.
-> Internal: Bullish.
Following previous high, and printing of bearish CHoCH, price has pulled back to an M15 supply zone, where we are currently seeing a reaction. Therefore, I shall now confirm internal high.
Price is now trading within an established internal range.
The remainder of my analysis shall remain the same as analysis dated 13 June 2025, apart from target price.
As per my analysis dated 22 May 2025 whereby I mentioned price can be seen to be reacting at discount of 50% EQ on H4 timeframe, therefore, it is a viable alternative that price could potentially print a bullish iBOS on M15 timeframe despite internal structure being bearish.
Price has printed a bullish iBOS followed by a bearish CHoCH, which indicates, but does not confirm, bearish pullback phase initiation. I will however continue to monitor, with respect to depth of pullback.
Intraday Expectation:
Price to continue bearish, react at either M15 supply zone, or discount of 50% internal EQ before targeting weak internal high priced at 3,451.375.
Note:
Gold remains highly volatile amid the Federal Reserve's continued dovish stance, persistent and escalating geopolitical uncertainties. Traders should implement robust risk management strategies and remain vigilant, as price swings may become more pronounced in this elevated volatility environment.
Additionally, President Trump’s recent tariff announcements are expected to further amplify market turbulence, potentially triggering sharp price fluctuations and whipsaws.
M15 Chart:
XAU / USD 2 Hour ChartHello traders. Taking a look at the current 2 hour chart, I have marked the area of interest that I am watching to see if we push up or reject and move down some more. I am looking for quick, scalp trades today and over the next few days. This week should be a good week. Trade the trend and let's see how things play out. Pre NY volume starts coming in about 15 minutes from this post. Big G gets a shout out. Thank you so much for checking out my chart.

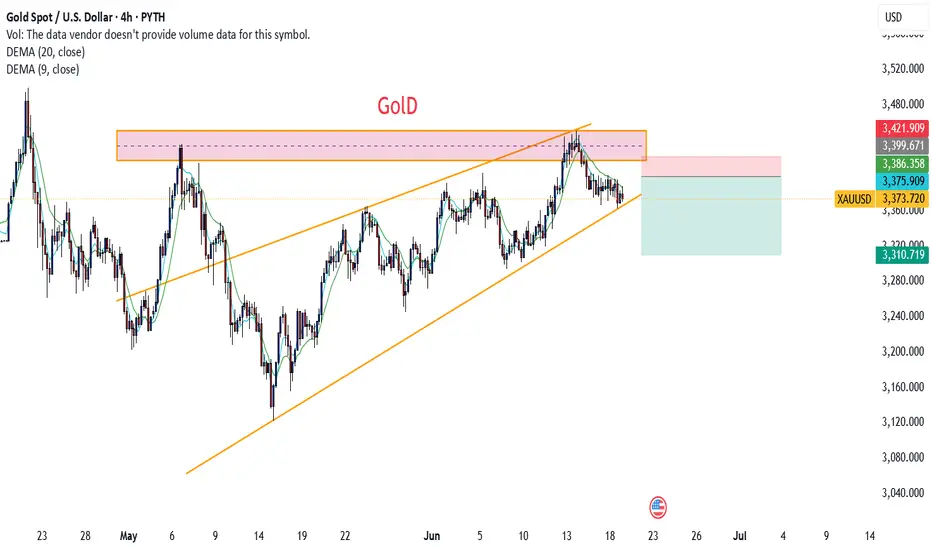
DeGRAM | GOLD kept the rising channel📊 Technical Analysis
● Price rejected the channel roof near 3 435 again, carving a small evening-star and slipping back under the May trend-median 3 370 — a repeat of April/May fades.
● Bearish RSI divergence plus a break of the micro up-sloper (last three sessions) tips for a rotation toward the lower rail/3 295 support; loss of that opens the April pivot at 3 225.
💡 Fundamental Analysis
● Sticky US retail-sales and hawkish Fed comments keep 2-yr yields near 4.8 %, firming the DXY, while CFTC data show specs cutting longs for a second week — limiting bid depth.
✨ Summary
Sell rallies 3 410-3 430; sustained trade below 3 366 targets 3 295, stretch 3 225. Short view void on an H4 close above 3 450.
-------------------
Share your opinion in the comments and support the idea with a like. Thanks for your support!

Is 2025 the right time to make plans?Market news:
On Thursday (June 19) in the early Asian session, spot gold fluctuated in a narrow range and is currently trading around $3,380/ounce. As an important safe-haven asset in the global financial market, the price fluctuations of international gold are often affected by macroeconomic policies, geopolitical situations and market sentiment. Recently, the gold market has shown a complex and eye-catching trend under the dual influence of the Federal Reserve's interest rate decision and geopolitical tensions in the Middle East.The Federal Reserve decided to keep the benchmark overnight interest rate unchanged at 4.25%-4.50% at its meeting on June 18. This decision was in line with market expectations, but its subsequent statement brought new uncertainty to the London gold price market. This cautious stance weakened the market's expectations for the Federal Reserve's rapid easing, causing gold prices to fall 0.57% on Wednesday to close at $3,369/ounce.The current gold market is in a complex environment with multiple factors intertwined. The Federal Reserve's cautious monetary policy stance and inflation expectations caused by tariffs have brought short-term pressure on gold prices, but geopolitical tensions and signs of economic slowdown have provided potential upward momentum for gold prices. Pay attention to the dynamic changes in the global economy and geopolitics to seize investment opportunities in the gold market.
Technical Review:
Gold fell to the MA10-day moving average of 3662 in the early morning and counterattacked 3380 in the Asian session. The Asian session will continue to look at the rebound strength. The gold price will continue to fluctuate and adjust. The large range is 3408/3343, and the small range is 3390/3360. The daily chart fell back to the 10-day moving average at 3362, and the MA5/7-day moving average was suppressed at 3385/90. The RSI indicator continued to flatten the middle axis. The short-term four-hour chart price is running in the middle and lower tracks of the Bollinger Band!
This week, gold rose sharply to 3450 at the opening, and gradually fell slowly to 3365, with a strength of 100 US dollars. Although the main strength in the first two trading days was a decline, the buying trend remained unchanged. In an uncertain environment, there is still a chance of a big rise in the future. So this week's idea continues to maintain short-term selling and long-term buying.
Today's analysis:
After the Fed's interest rate decision, the Fed kept the interest rate unchanged as expected, which was in line with market expectations. Gold continued to fluctuate and fall in the short term, and there was no obvious upward momentum for buying. Even if it was a risk aversion, it might be careful of the trend of rising and falling. Since gold was under pressure at 3400, it continued to sell at high prices when it rebounded under pressure at 3400 during the day.The gold 1-hour moving average continued to sell downward dead cross patterns, and the gold buying rebound was weak. It was under pressure at 3400 for many times in the past two days and began to fall. The short-term 3400 line of gold has become a strong resistance. If gold buying cannot break through 3400 strongly, then gold buying will be difficult to improve. It is likely that it will still be the main venue for gold selling. Gold rebounded at 3400 during the day and continued to sell at high prices.
Operation ideas:
Short-term gold 3365-3368 buy, stop loss 3356, target 3390-3440;
Short-term gold 3395-3398 sell, stop loss 3407, target 3370-3350;
Key points:
First support level: 3368, second support level: 3354, third support level: 3333
First resistance level: 3396, second resistance level: 3408, third resistance level: 3420

XAU/USD: Buy on DipsDriving Logic
- Fed policy decision in line with expectations; escalation of Iran-Israel conflict boosts safe-haven demand; gold ETF inflows hit $230M daily, a 1-year high.
Key Levels
- Strong resistance at $3,400; support at $3,360-$3,370 (confluence of 50-day MA and Fibonacci retracement).
Trading Strategy
- Long on bullish candlestick reversal at $3,370-$3,360; stop-loss at $3,350; targets at $3,390-$3,400. Monitor PPI data and Middle East developments.
XAUUSD
buy@3360-3370
tp:3385-3395
I am committed to sharing trading signals every day. Among them, real-time signals will be flexibly pushed according to market dynamics. All the signals sent out last week accurately matched the market trends, helping numerous traders achieve substantial profits. Regardless of your previous investment performance, I believe that with the support of my professional strategies and timely signals, I will surely be able to assist you in breaking through investment bottlenecks and achieving new breakthroughs in the trading field.

GOLD Rising Support Ahead! Buy!
Hello,Traders!
GOLD is trading in an uptrend
So despite the price is going
Down now we will be expecting
A strong rebound and a move up
After the price hits the
Rising support below
Buy!
Comment and subscribe to help us grow!
Check out other forecasts below too!
Disclosure: I am part of Trade Nation's Influencer program and receive a monthly fee for using their TradingView charts in my analysis.

XAU/USD Bullish Setup Confirmed After Wave C CompletionXAU/USD has completed a classic five-wave impulsive structure to the upside, followed by a clear ABC corrective phase. The price action shows that wave (5) has topped, and the market has since retraced through a three-wave ABC correction inside a well-defined descending channel.
Currently, wave C appears to have found support right at the lower trendline of the broader ascending structure, signaling a potential completion of the correction and the beginning of a new bullish impulse.
The reaction from this level is strong, suggesting that buyers are stepping in to drive the next leg higher
Wave Count: 5-wave impulse up, followed by ABC correction
Structure: Wave C completed at key channel support
Momentum: Bullish recovery expected if price holds above recent swing low
T1: 3332.268
T2: 3354.078
SL: 3289.400

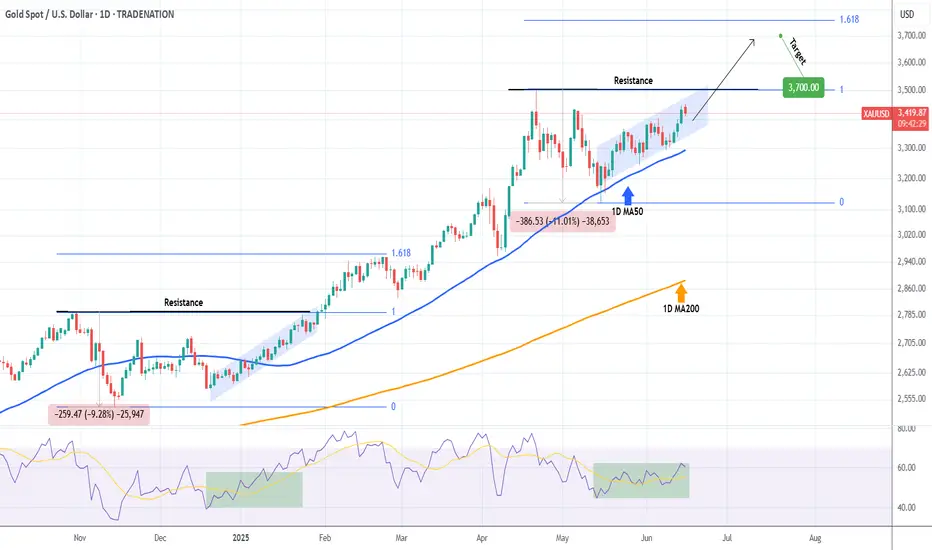
XAUUSD Strong break-out ahead to $3700.Gold (XAUUSD) is trading within a Channel Up, while being supported by the 1D MA50 (blue trend-line). This is similar to the December 19 2024 - January 30 2025 Channel Up, which when it broke above the previous Higher High Resistance, it rose straight to the 1.618 Fibonacci extension.
As a result, as long as the 1D MA50 supports, we are looking for a medium-term bullish break-out, possible by the end of July, targeting at least 3700.
-------------------------------------------------------------------------------
** Please LIKE 👍, FOLLOW ✅, SHARE 🙌 and COMMENT ✍ if you enjoy this idea! Also share your ideas and charts in the comments section below! This is best way to keep it relevant, support us, keep the content here free and allow the idea to reach as many people as possible. **
-------------------------------------------------------------------------------
Disclosure: I am part of Trade Nation's Influencer program and receive a monthly fee for using their TradingView charts in my analysis.
💸💸💸💸💸💸
👇 👇 👇 👇 👇 👇
How to trade the Fed's interest rate decision!In nearly an hour, the Fed will announce the Fed's interest rate decision and a summary of economic expectations;
In nearly an hour and a half, Powell will hold a monetary policy press conference.
If the Fed's policy statement or the latest forecast shows a dovish tendency, it may resume the downward trend of the US dollar, thereby supporting the upward trend of gold; and the recent mild inflation and weak employment data in the United States may prompt the Fed to soften its previous assessment, thereby strengthening expectations of interest rate cuts and providing support for gold prices.
From the current technical structure, gold maintains a volatile and anxious market during the day, and there is no clear direction in the short term, but gold is currently always below 3400, and the overall market is still in a weak trend; but gold has repeatedly touched the 3375-3365 area and can quickly recover, proving that there is still strong buying support below; in fact, it stands to reason that if gold is really weak, it should have continued to fall and touched the 3360-3350 area, but gold did not touch the area as expected, but used sideways trading to exchange time and space, and there was no sign of any downward breakthrough, so gold is likely to choose an upward direction.
In addition, the Middle East geopolitical crisis, global economic uncertainty, intensified trade frictions and rising inflation expectations will all provide structural support for gold. So if gold does not fall below the 3365-3355 area today, we will be bullish on gold first; but if gold cannot break through the 3410-3420 area in one fell swoop during the rise, then we need to be careful of the trend of gold rising and then falling.
As for how to trade the news next: the Federal Reserve interest rate decision. The above are my trading ideas and opinions, you can read them carefully and use them as a reference! If you still want to trade news after careful consideration, please be sure to set SL during the transaction to protect your account to the greatest extent!

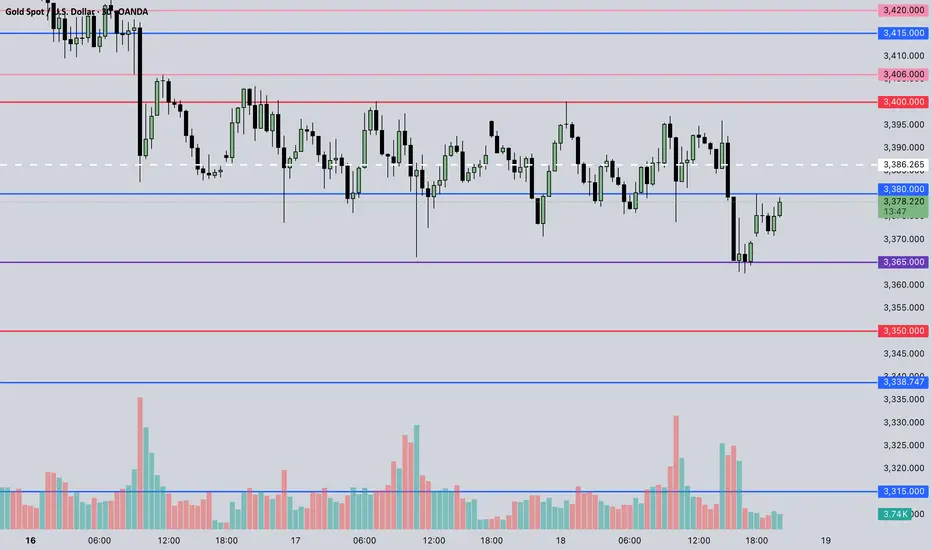
June 19, 2025 - XAUUSD GOLD Analysis and Potential OpportunitySummary:
Gold continues to trade within the 3365–3400 range without a decisive breakout.
Today’s strategy: Sell near resistance, buy near support while the range holds.
If price holds above 3386, bullish momentum may gradually strengthen.
🔍 Key Levels to Watch:
• 3420 – Resistance
• 3406 – Range top
• 3400 – Psychological level
• 3396 – Resistance
• 3386 – Bull-bear divider
• 3380 – Resistance
• 3371 – Support
• 3365 – Intraday key support
• 3350 – Midpoint support
📉 Intraday Strategy:
1. SELL if price breaks below 3365 → watch 3360, then 3355, 3350, 3346
2. BUY if price holds above 3386 → watch 3391, then 3396, 3400, 3403
👉 If you found this useful, please drop a like! Your support lets me know whether there’s demand for a post on how I enter and place stops — still planning to release it soon!
Disclaimer: Personal view, not financial advice. Trade with discipline and manage your risk.
XAUUSD:Fed & Middle East as Breakout CatalystsGold is currently fluctuating between $3,375 and $3,405. A breakdown below $3,375 could trigger a direct move toward $3,360, while a decisive breakout above $3,405 with sustained momentum would target $3,430.
The ability to breach this range hinges on today's Fed data release and evolving Middle East tensions. For now, adopt a range-trading strategy (sell high/buy low) within the band, and await key data to follow market momentum.
XAUUSD
sell@3395-3405
tp:3380-3370
buy@3370-3380
tp:3395-3405
I am committed to sharing trading signals every day. Among them, real-time signals will be flexibly pushed according to market dynamics. All the signals sent out last week accurately matched the market trends, helping numerous traders achieve substantial profits. Regardless of your previous investment performance, I believe that with the support of my professional strategies and timely signals, I will surely be able to assist you in breaking through investment bottlenecks and achieving new breakthroughs in the trading field.

Top 5 Most Effective Forex Trading StrategiesTop 5 Most Effective Forex Trading Strategies Used by Professional Traders
Forex trading requires not just knowledge, but discipline and a clear strategy. So what are the most effective forex trading strategies that professional traders consistently use to achieve sustainable profits?
Let’s explore the 5 most trusted strategies that have stood the test of time – helping you level up your skills and reduce risk in this trillion-dollar market.
1. Breakout Strategy – Catching the Wave When the Market Explodes
A breakout occurs when price moves beyond a key support or resistance level after a period of consolidation. This usually signals the start of a new trend.
Best for: Traders who love strong momentum.
Pro tip: Confirm breakout with volume or candlestick patterns (e.g., engulfing).
Caution: Avoid entering right after the breakout – wait for a retest.
2. Trend Following Strategy – Trade with the Market, Not Against It
“Trend is your friend” – one of the most famous sayings in trading. This strategy helps traders ride the main trend, buying in uptrends and selling in downtrends.
Recommended tools: MA 20, MA 50, RSI, MACD.
Insider tip: Combine with pullback entries (enter when price retraces to dynamic support/resistance).
3. Price Action Strategy – Reading the Market Without Indicators
Price Action focuses on interpreting pure price behavior, without relying on indicators. Many pro traders prefer this approach to understand market psychology in real time.
Advantages: Clean, flexible, sharpens decision-making.
Popular candlestick patterns: Pin Bar, Inside Bar, Fakey, Engulfing.
4. News Trading Strategy – For Quick Thinkers and Fast Hands
When major news events like CPI, NFP, FOMC, or rate decisions hit the market, volatility surges. This creates both high-profit opportunities and high risks.
Common tactic: Straddle – place Buy Stop & Sell Stop before news release.
Risk warning: Watch out for slippage and widened spreads.
5. Fibonacci & Confluence Strategy – High-Probability Entries
This strategy combines tools like Fibonacci retracement, trendlines, support/resistance zones, and moving averages to find high-probability entry points.
Strength: Optimizes Risk: Reward ratio.
Tip: Focus on Fib levels 0.382 – 0.618 (commonly used retracement zones).
Conclusion: The Best Strategy is the One That Matches Your Style
There’s no perfect strategy – but understanding and applying the one that best fits your trading style will help you avoid emotional decisions and build long-term consistency.
Remember: Risk management – Emotional control – Systematic discipline = Long-term trading survival.
