How to trade the Fed's interest rate decision!In nearly an hour, the Fed will announce the Fed's interest rate decision and a summary of economic expectations;
In nearly an hour and a half, Powell will hold a monetary policy press conference.
If the Fed's policy statement or the latest forecast shows a dovish tendency, it may resume the downward trend of the US dollar, thereby supporting the upward trend of gold; and the recent mild inflation and weak employment data in the United States may prompt the Fed to soften its previous assessment, thereby strengthening expectations of interest rate cuts and providing support for gold prices.
From the current technical structure, gold maintains a volatile and anxious market during the day, and there is no clear direction in the short term, but gold is currently always below 3400, and the overall market is still in a weak trend; but gold has repeatedly touched the 3375-3365 area and can quickly recover, proving that there is still strong buying support below; in fact, it stands to reason that if gold is really weak, it should have continued to fall and touched the 3360-3350 area, but gold did not touch the area as expected, but used sideways trading to exchange time and space, and there was no sign of any downward breakthrough, so gold is likely to choose an upward direction.
In addition, the Middle East geopolitical crisis, global economic uncertainty, intensified trade frictions and rising inflation expectations will all provide structural support for gold. So if gold does not fall below the 3365-3355 area today, we will be bullish on gold first; but if gold cannot break through the 3410-3420 area in one fell swoop during the rise, then we need to be careful of the trend of gold rising and then falling.
As for how to trade the news next: the Federal Reserve interest rate decision. The above are my trading ideas and opinions, you can read them carefully and use them as a reference! If you still want to trade news after careful consideration, please be sure to set SL during the transaction to protect your account to the greatest extent!
GOLDMINICFD trade ideas


June 19, 2025 - XAUUSD GOLD Analysis and Potential OpportunitySummary:
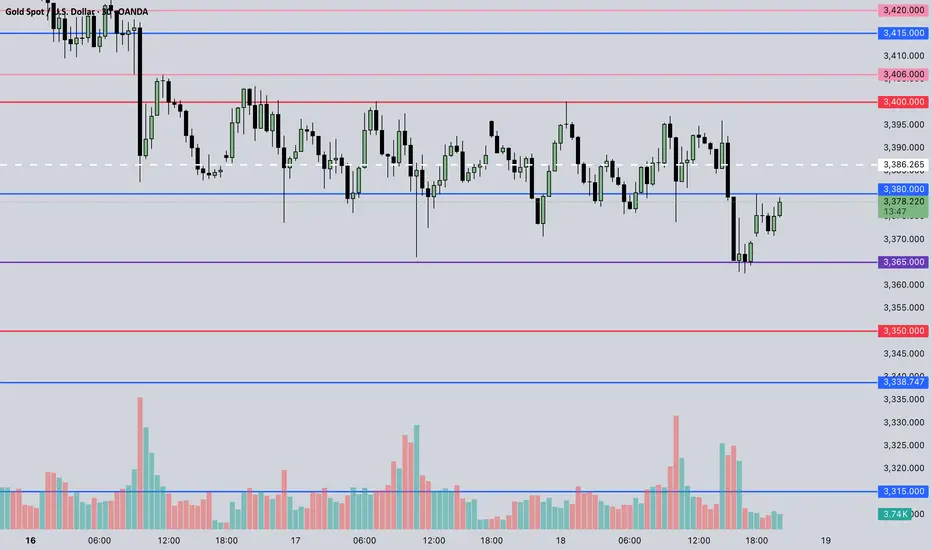
Gold continues to trade within the 3365–3400 range without a decisive breakout.
Today’s strategy: Sell near resistance, buy near support while the range holds.
If price holds above 3386, bullish momentum may gradually strengthen.
🔍 Key Levels to Watch:
• 3420 – Resistance
• 3406 – Range top
• 3400 – Psychological level
• 3396 – Resistance
• 3386 – Bull-bear divider
• 3380 – Resistance
• 3371 – Support
• 3365 – Intraday key support
• 3350 – Midpoint support
📉 Intraday Strategy:
1. SELL if price breaks below 3365 → watch 3360, then 3355, 3350, 3346
2. BUY if price holds above 3386 → watch 3391, then 3396, 3400, 3403
👉 If you found this useful, please drop a like! Your support lets me know whether there’s demand for a post on how I enter and place stops — still planning to release it soon!
Disclaimer: Personal view, not financial advice. Trade with discipline and manage your risk.
XAU/USD Bullish Setup Confirmed After Wave C CompletionXAU/USD has completed a classic five-wave impulsive structure to the upside, followed by a clear ABC corrective phase. The price action shows that wave (5) has topped, and the market has since retraced through a three-wave ABC correction inside a well-defined descending channel.
Currently, wave C appears to have found support right at the lower trendline of the broader ascending structure, signaling a potential completion of the correction and the beginning of a new bullish impulse.
The reaction from this level is strong, suggesting that buyers are stepping in to drive the next leg higher
Wave Count: 5-wave impulse up, followed by ABC correction
Structure: Wave C completed at key channel support
Momentum: Bullish recovery expected if price holds above recent swing low
T1: 3332.268
T2: 3354.078
SL: 3289.400

XAUUSD:Fed & Middle East as Breakout CatalystsGold is currently fluctuating between $3,375 and $3,405. A breakdown below $3,375 could trigger a direct move toward $3,360, while a decisive breakout above $3,405 with sustained momentum would target $3,430.
The ability to breach this range hinges on today's Fed data release and evolving Middle East tensions. For now, adopt a range-trading strategy (sell high/buy low) within the band, and await key data to follow market momentum.
XAUUSD
sell@3395-3405
tp:3380-3370
buy@3370-3380
tp:3395-3405
I am committed to sharing trading signals every day. Among them, real-time signals will be flexibly pushed according to market dynamics. All the signals sent out last week accurately matched the market trends, helping numerous traders achieve substantial profits. Regardless of your previous investment performance, I believe that with the support of my professional strategies and timely signals, I will surely be able to assist you in breaking through investment bottlenecks and achieving new breakthroughs in the trading field.

XAUUSD İmpulsive wave continuationWe have started our next impulsive wave. Elliot Wave is not some magic tells us future but eliminating all the possibilities while market pricing fundementals and clear patterns. so when we have left with only very limitided posibilities we know how to position ourselves.
here is one of thoose handful of options left in the hand. short term targets : 3469-3531

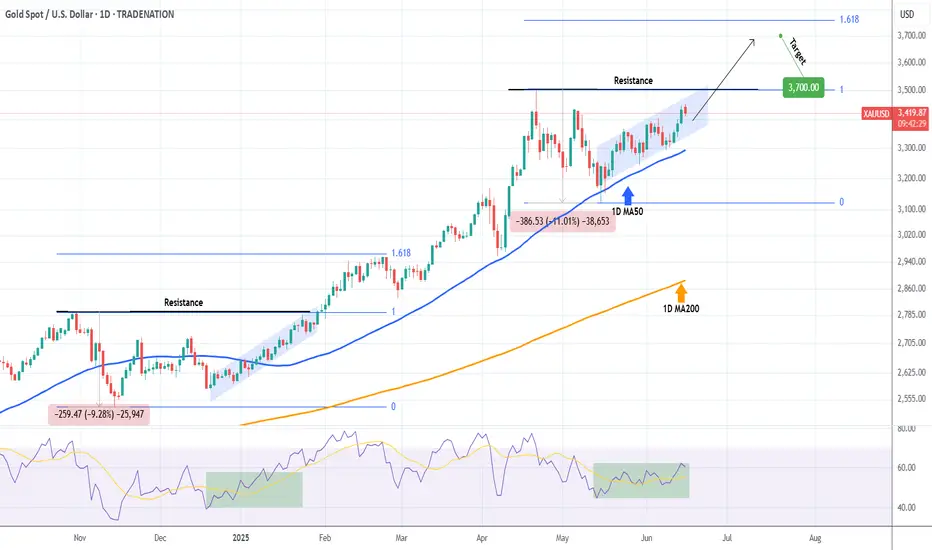
XAUUSD Strong break-out ahead to $3700.Gold (XAUUSD) is trading within a Channel Up, while being supported by the 1D MA50 (blue trend-line). This is similar to the December 19 2024 - January 30 2025 Channel Up, which when it broke above the previous Higher High Resistance, it rose straight to the 1.618 Fibonacci extension.
As a result, as long as the 1D MA50 supports, we are looking for a medium-term bullish break-out, possible by the end of July, targeting at least 3700.
-------------------------------------------------------------------------------
** Please LIKE 👍, FOLLOW ✅, SHARE 🙌 and COMMENT ✍ if you enjoy this idea! Also share your ideas and charts in the comments section below! This is best way to keep it relevant, support us, keep the content here free and allow the idea to reach as many people as possible. **
-------------------------------------------------------------------------------
Disclosure: I am part of Trade Nation's Influencer program and receive a monthly fee for using their TradingView charts in my analysis.
💸💸💸💸💸💸
👇 👇 👇 👇 👇 👇

Top 5 Most Effective Forex Trading StrategiesTop 5 Most Effective Forex Trading Strategies Used by Professional Traders
Forex trading requires not just knowledge, but discipline and a clear strategy. So what are the most effective forex trading strategies that professional traders consistently use to achieve sustainable profits?
Let’s explore the 5 most trusted strategies that have stood the test of time – helping you level up your skills and reduce risk in this trillion-dollar market.
1. Breakout Strategy – Catching the Wave When the Market Explodes
A breakout occurs when price moves beyond a key support or resistance level after a period of consolidation. This usually signals the start of a new trend.
Best for: Traders who love strong momentum.
Pro tip: Confirm breakout with volume or candlestick patterns (e.g., engulfing).
Caution: Avoid entering right after the breakout – wait for a retest.
2. Trend Following Strategy – Trade with the Market, Not Against It
“Trend is your friend” – one of the most famous sayings in trading. This strategy helps traders ride the main trend, buying in uptrends and selling in downtrends.
Recommended tools: MA 20, MA 50, RSI, MACD.
Insider tip: Combine with pullback entries (enter when price retraces to dynamic support/resistance).
3. Price Action Strategy – Reading the Market Without Indicators
Price Action focuses on interpreting pure price behavior, without relying on indicators. Many pro traders prefer this approach to understand market psychology in real time.
Advantages: Clean, flexible, sharpens decision-making.
Popular candlestick patterns: Pin Bar, Inside Bar, Fakey, Engulfing.
4. News Trading Strategy – For Quick Thinkers and Fast Hands
When major news events like CPI, NFP, FOMC, or rate decisions hit the market, volatility surges. This creates both high-profit opportunities and high risks.
Common tactic: Straddle – place Buy Stop & Sell Stop before news release.
Risk warning: Watch out for slippage and widened spreads.
5. Fibonacci & Confluence Strategy – High-Probability Entries
This strategy combines tools like Fibonacci retracement, trendlines, support/resistance zones, and moving averages to find high-probability entry points.
Strength: Optimizes Risk: Reward ratio.
Tip: Focus on Fib levels 0.382 – 0.618 (commonly used retracement zones).
Conclusion: The Best Strategy is the One That Matches Your Style
There’s no perfect strategy – but understanding and applying the one that best fits your trading style will help you avoid emotional decisions and build long-term consistency.
Remember: Risk management – Emotional control – Systematic discipline = Long-term trading survival.

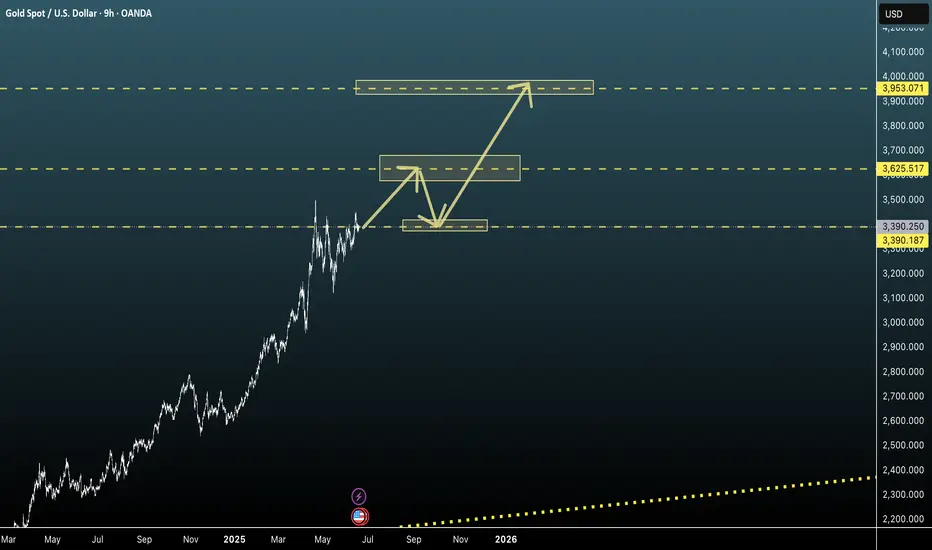
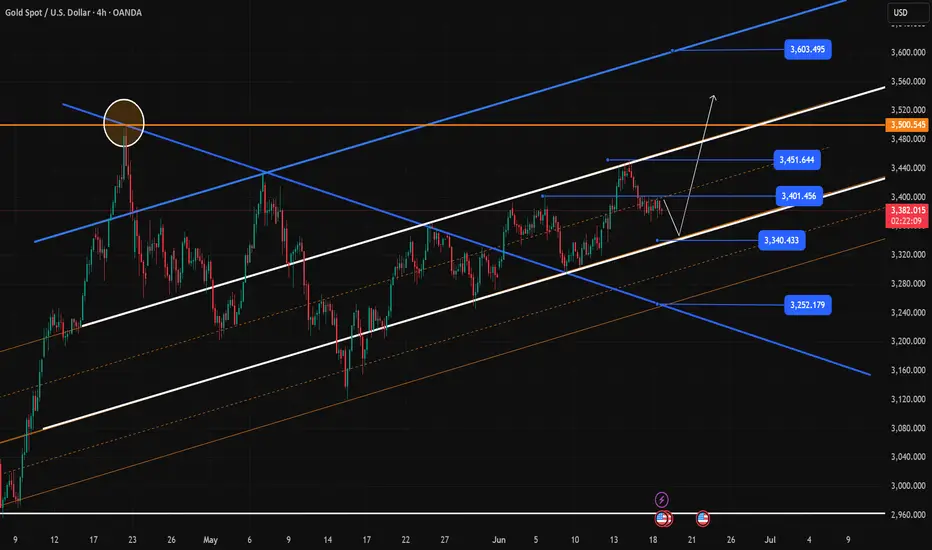
Gold Final Leg? Mapping the Last Wave of the Current Bull CycleI expect gold to be entering the final bullish wave of its current long-term cycle, with an ultimate target in the $3,900–$4,050 range.
However, the first major resistance lies between $3,600 and $3,700, where I expect a potential pullback.
From there, a healthy correction toward $3,300–$3,400 is likely.
If strong buying momentum steps in at that support zone, we may see gold continue its rally toward the final target.
📌 Key Risk Level:
Pay close attention to the $3,300–$3,400 support.
If gold fails to hold above it, and closes decisively below, this could signal that $3,600 was already the final top of this bull cycle.
Stay cautious, and good luck to all fellow traders! 🟡📈
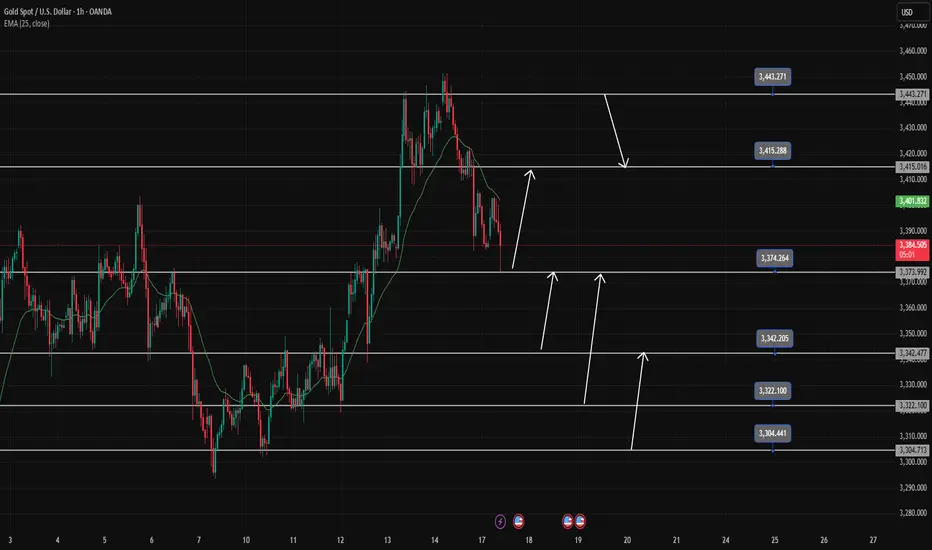
Gold trading strategy June 17D1 candle shows profit taking by sellers pushing the price back below 3400. In the current context, the pullback is only short-term and has not confirmed the reversal, but long-term Buy signals can still be noticed at important support zones.
Today, there are many price zones that can BUY Gold, so wait for confirmation before placing an order. Gold is heading towards the first support around 3375-3373 (this zone has just reacted 100 pips). This is also the Breakout zone. If it breaks this zone, Gold will reach 3343-3341 before it can BUY.
Note that to sell break 3373 and the SELL resistance point must wait for 3415 and the daily resistance 3443-3445
If there is a sweep to 3343 and bounces and closes above the 3373 breakout zone, it confirms that the uptrend will continue strongly in the near future.
The next BUY support zone to pay attention to is 3322-3320 and the 3305-3303 zone. The BUY target is always pushed further back to 3415 or to the peak around 3443.
SUPPORT: 3373;3342;3322;3304
RESISTANCE: 3415;3443
After breaking KEY DAY yesterday, it is very likely ATH in weekGold prices are being directly affected by the Israel-Iran tensions, the risk of trade conflicts due to the new US tariff policy, and concerns about slowing global economic growth. However, gold prices suddenly fell in the context of improving risk appetite of investors as they get used to the "new normal".
Daniel Pavilonis, senior commodities broker at RJO Futures, commented that if this rally starts to lose momentum, it could be a double top pattern for gold. Giving advice to investors, according to Mr. Pavilonis, they should start considering reducing their gold position at this time if they missed the opportunity to take profits at $3,509. When gold is peaking, investors see other markets moving higher, such as silver, platinum and palladium.
Best regards, StarrOne !!!

Analysis of the latest gold market trend on June 18:
📌 News analysis
Expectations of the Fed's rate cut continue to affect the market
The market's expectations for the Fed's rate cut in 2025 have increased, the US dollar index remains weak, and gold has gained support.
Key points of attention: This week's Fed interest rate decision and Powell's speech, if dovish signals are released (such as hinting at a rate cut in September), gold may rebound; if hawkish (postponing the rate cut), gold prices may be further under pressure.
The situation in the Middle East has escalated, and risk aversion has increased
After Israel attacked Iran's state TV station, Iran threatened "the largest retaliation in history", and the fire on the tanker in the Strait of Hormuz has exacerbated geopolitical risks.
Potential impact: If the conflict expands (such as Iran blocking the Strait or directly counterattacking), gold may rise rapidly; if the situation eases (negotiation signals), safe-haven buying may weaken.
US economic data and market sentiment
If recent US economic data (such as retail sales and unemployment rate) are weak, it may strengthen expectations of rate cuts and benefit gold; if the data is strong, it may suppress gold prices.
📊 Technical Analysis
🔹 Daily level: Bearish, but key support needs to be paid attention to
Trend review: Gold price fell after a high rise at the beginning of the week, falling below the 3400 mark and closing with a large negative line, indicating that bears are dominant.
Key signals:
The 5-day moving average turned downward, suppressing the rebound of gold prices in the short term.
The Bollinger Bands closed, indicating that the market has entered a shock consolidation phase. If it falls below 3350, it may accelerate downward to 3300.
Support level: 3360-3350 (if it stabilizes, it may rebound); resistance level: 3400-3410 (if it breaks through, it may test 3450).
🔹 4-hour level: Bearish, but there may be a rebound correction in the short term
Short-term moving average suppression (5-day and 20-day moving averages are glued at 3404-3409) constitutes strong resistance.
MACD crosses, but Stoch is oversold, and may correct and rebound in the short term, but if it fails to break through 3400, it may continue to fall.
Key support: 3360-3350 (if it falls below, it may drop to 3330-3300).
🔹 1-hour level: Weak shock, pay attention to the rebound strength
MACD crosses and shrinks, Stoch moves downward, and it is still weak in the short term.
Upper pressure: 3412 (MA60+MA30), if it fails to break through, it may continue to fall.
🎯 Today's operation strategy
📉 Short-term trading ideas: short-selling on rebounds is the main method, and long-selling on pullbacks is the auxiliary method
✅ Short-selling opportunities (selling at highs):
Entry area: 3395-3405 (if the rebound is blocked)
Target: 3360-3350
Stop loss: above 3410
✅ Long opportunities (buy low):
Entry area: 3360-3350 (if it stabilizes and rebounds)
Target: 3380-3400
Stop loss: below 3345
⚠️ Key risk warnings:
Market volatility may intensify before the Fed's decision. It is recommended to operate with a light position and strictly stop loss.
If the situation in the Middle East deteriorates, it may trigger a rapid rise in gold. Pay attention to real-time news.
📌 Summary: Gold is short-term dominant, but the key support (3360-3350) still has the possibility of a rebound. In terms of trading, it is recommended to take high-short as the main idea and low-long as the auxiliary idea, focusing on the Federal Reserve’s decisions and geopolitical trends.

Today's gold price is bound to usher in a big trend.Today's gold price is bound to usher in a big trend.
The latest report shows:
In the next 12 months, global central banks will continue to increase their gold reserves.
Nearly 43% of central banks plan to increase their gold reserves next year.
This is a good reflection of the current global financial and geopolitical environment.
In today's world full of uncertainty and chaos, gold remains a strategic asset.
Central banks around the world are paying close attention to issues such as interest rates, inflation and instability, which has prompted them to choose to increase gold reserves to avoid risks.
Fundamentals:
(1): It is expected that the Federal Reserve's interest rate meeting will maintain interest rates unchanged (4.25%-4.50%), but attention should be paid to Powell's statement on the expectation of interest rate cuts.
If a dovish signal is released (for example, hinting at a rate cut this year), the gold price may break through 3450;
If stubborn inflation is emphasized, the gold price may fall back to 3350.
(2): Trump pushes for interest rate cuts: political interference may increase market concerns about policy uncertainty, which may be good for gold.
(3): Geopolitical risk (Middle East situation):
The market is currently slow to react to the Iran-Israel conflict, but if the situation suddenly escalates (such as military action), gold prices will rise rapidly.
Technical analysis
As shown in Figure 4h:
The trend has not yet broken, but be wary of the risk of a pullback.
Key positions:
Support level: 3365, 3350
Resistance level: 3405, 3430-3450
Today's operation strategy:
Gold price falls below $3,400, short selling strategy:
Entry level: 3393-3395
Stop loss level: 3405
Target level: 3370→3365 (falling below 3350).
Long opportunities:
Conservative strategy:
Entry level: 3360-3365
Stop loss level: 3350
Target level: 3385→3400.
Aggressive strategy:
Entry point: 3370-3380
Stop loss: 3360
Target: 3390-3400 or above
Focus: US market (cautious layout before the Fed's decision)
If the gold price stabilizes at 3405: light position to chase long, target 3430-3450, stop loss 3395.
If it falls below 3360: rebound to 3370 to short, target 3350, stop loss 3378.
Key risk warning
Increased volatility of the Fed's decision:
It is recommended to clear positions 1 hour before the announcement of the interest rate decision to avoid the market situation of "buying expectations and selling facts".
If Powell mentions "controllable inflation" or "economic slowdown", the gold price may rise sharply; if he emphasizes "maintaining high interest rates", the gold price may fall sharply.
Geopolitical emergencies: If the situation in the Middle East deteriorates, the gold price may rise by $20-30, and the strategy needs to be adjusted in real time.
Gold within known rangeTechnical analysis: Descending Channel on Hourly 4 chart was discontinued as there was an attempt on the same chart to develop Ascending Channel and extend the Intra-day’s relief rally above #3,402.80 benchmark. My action plan remains intact as I will continue operating with Scalp Sell and Buying orders as long as #3,362.80 - #3,402.80 zone holds (so far it hasn't been crossed again to the upside or downside) and reversal towards #3,417.80 Resistance in extension if #3,402.80 benchmark gets invalidated. Consider the Lower High’s Upper zone test on the Daily chart’s scale, while Hourly 4 chart turned Bearish on my key indicators sessions ago. As expected, yesterday's session Daily candle closed below the #3,395.80 Resistance, widely above both of the Daily chart’s MA’s, turning flat for the session (isolated within Neutral rectangle however). That is a strong indication that the market is attempting to Price the Bottom here (temporary or not), which just so happens to be a Lower High's Lower zone within Daily chart’s Ascending Channel. It is no surprise that today's Hourly 4 chart’s candle is attempting to engage Bearish sequence so far and since its on Bearish Technicals (invalidated Ascending Channel), I consider it the most optimal re-Buy entry for a Short-term recovery back towards #3,288.80 - #3,392.80 Resistance belt or above (representing last week’s High’s).
My position: Even though I mentioned remaining on sidelines, I used #3,388.80 - #3,392.80 as an excellent re-Buy zone and closed my set of Scalping orders within #3,393.80 - #3,398.80 and remained off for the session. It is indeed clash of Bearish Technicals and War news (Fundamentally Bullish) as I will keep my Trading activity to minimum, protecting my capital for now.

Seize the opportunity to short gold after the reboundBecause gold fell back to the expected support area of 3375-3365 first, I just took the opportunity to go long on gold near 3372 and set TP: 3390. Obviously, our long position ended the transaction by hitting TP, and we made a profit of 180pips.
At present, gold continues to rebound to around 3396, and is facing the short-term resistance area of 3395-3405, and the upside may be limited. And I think before the Fed's interest rate decision and Powell's monetary policy conference, gold is likely to maintain a range of fluctuations, and the willingness of both long and short parties to break through may not be strong in the short term. And from the current structure, gold tends to fluctuate downward as a whole.
So for short-term trading, we might as well try to short gold in the resistance area. I think it is still very likely to retreat to at least the 3385-3380 area.
