Gold Price Analysis June 24Quite a surprise with a price gap down at the beginning of the day. A sweep to 3333 and a recovery to increase again in the Tokyo trading session.
This recovery to increase completely breaks the market's bullish wave structure.
3363 and 3335 are being watched in the Asian and European trading sessions today. This zone can be traded short-term in the sideways range. The SELL zone pays attention to the opening gap at 3368.
The upper range has some adjustments compared to yesterday in the direction of decreasing prices, so the SELL range 3386 and 3410 is being watched for trading. Support is still held as yesterday at the 3322 and 3296 zones.
GOLDMINICFD trade ideas

GOLD: A Week After Israel Bombs Iranmy view on where gold is going and how i caught the buy on friday after much accumulation

GOLD SETUPGold setup as it switches price delivery from a bullish program to a bearish program with a good trade entry on the touch of the order block.

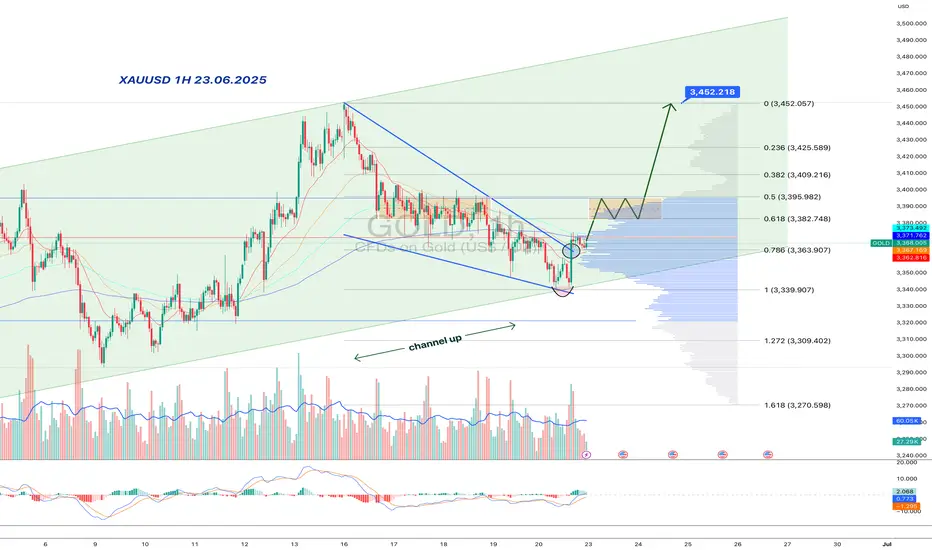
Gold:bullish wedge inside a rising channel-double trap for bearsInside the major upward channel, gold formed a falling wedge — and, of course, faked a breakdown. But the move reversed quickly: price reclaimed the wedge, surged on volume, and held above the key 3363–3368 area. This isn't just a bounce — it's a structural reclaim in line with the broader trend.
Price is now in the upper part of the rising channel and has broken a local downtrend line, reinforcing the bullish signal. Consolidation around 3380–3395 might be the last pause before acceleration. Above that lies a volume gap — no resistance until 3452.
MACD is flipping bullish, RSI turning upward, and volume confirms smart money presence. Classic: trap below, breakout above. As long as 3363 holds — longs remain in control.
XAUUSD – Selling Pressure Intensifies, the 3,300 USD 1. Overall Technical Context
The XAUUSD daily chart shows that gold is under bearish pressure after failing to break the key confluence resistance at 3,385–3,399 USD, which includes:
- Fibonacci retracement levels 0.5 – 0.618
- A strong supply zone that has been repeatedly rejected
- A minor swing high formed near 3,451 USD
2. Recent Price Behavior
Price has broken below the short-term support at 3,331 USD and is now retesting the Key Lever zone around 3,300 USD, which is a confluence of:
- Previous June swing low
- Fibonacci 0.618 retracement of the latest upward move from 3,221 to 3,451
- A key previous support zone, potentially forming the right shoulder of a head and shoulders structure
If this zone breaks decisively, XAUUSD may continue falling toward the 3,270 – 3,250 USD area, where strong liquidity was previously found.
Key Technical Zones
Resistance:
3,385 – 3,399: Fibo 0.5–0.618 zone and recent swing high
3,435 – 3,451: Major swing high and starting point of the latest correction
Support:
3,300 – 3,320 (Key Lever): Major support currently being tested
3,271 – 3,250: Next support if the current zone fails
Suggested Trading Scenarios
Scenario 1 – Buy on Confirmation at Key Lever
Entry: 3,300 – 3,297 (Key Lever zone)
Stop-loss: Below 3,292
Take-profit: 3,310 – 3,315 – 3,320
Condition: Wait for a clear reversal candlestick pattern or signs of selling absorption on H4/H1
Scenario 2 – Sell if Price Breaks Below Key Lever
Entry: Below 3,290 (after clear break of Key Lever)
Stop-loss: Above 3,298
Take-profit: 3,280 – 3,270
P.S. XAUUSD is currently sitting at a decisive support area around 3,300 USD. The medium-term trend will depend on whether this zone holds. Traders are advised to closely watch price action on the H1–H4 timeframes before executing entries.
Follow for more daily trading strategies and don’t forget to save this analysis if you find it helpful for your trading plan.
Analyst: @Henrybillion

XAUUSD Daily Analysis
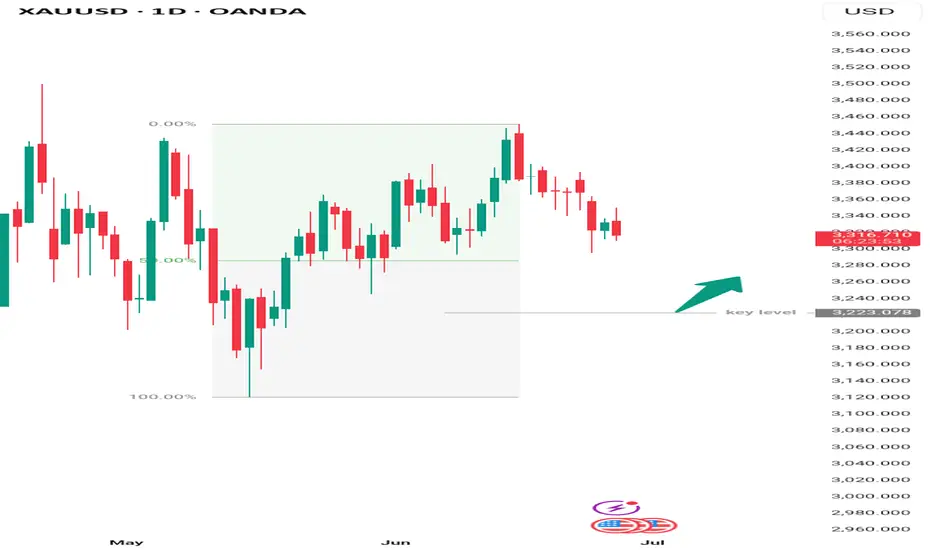
Gold is currently trading at a premium level after rejecting recent highs. The market is showing signs of weakness with a series of lower highs, suggesting a potential retracement. A key level to watch for a possible reaction or turnaround is around $3,225, which aligns with previous structural support and falls near the discount zone of the recent range. If price reaches this area, it could offer a favorable risk-reward opportunity for buyers depending on the reaction.
XAUUSD poised for a rebound?Gold (XAUUSD) is currently trading around the 3,327 level after breaking below a short-term ascending trendline that started in mid-May. While this break might suggest a potential bearish reversal, from a technical standpoint, it could simply be a corrective move within a larger bullish structure.
The current price pattern appears to be forming a classic ABC correction.
If the support zone around 3,320–3,325 holds, there’s a strong possibility that price will rebound toward the 3,400–3,480 region in the coming sessions.
This area is not only a technical support but also a previous demand zone where buyers stepped in aggressively. Close attention should be paid to any bullish price action signals here. A reversal candlestick or a volume spike could serve as confirmation for a rebound setup.
A potential trade idea is to consider a long position around 3,320–3,325, with a stop loss below 3,308.
First target is set at 3,400, and an extended target at 3,480 if bullish momentum continues. Conversely, if the price closes below 3,308 with strong volume, the bearish scenario will gain ground, potentially dragging price down to the 3,280–3,231 support area.
The setup remains open, and clear confirmation is needed. Patience is key—wait for solid signals before committing to a position.

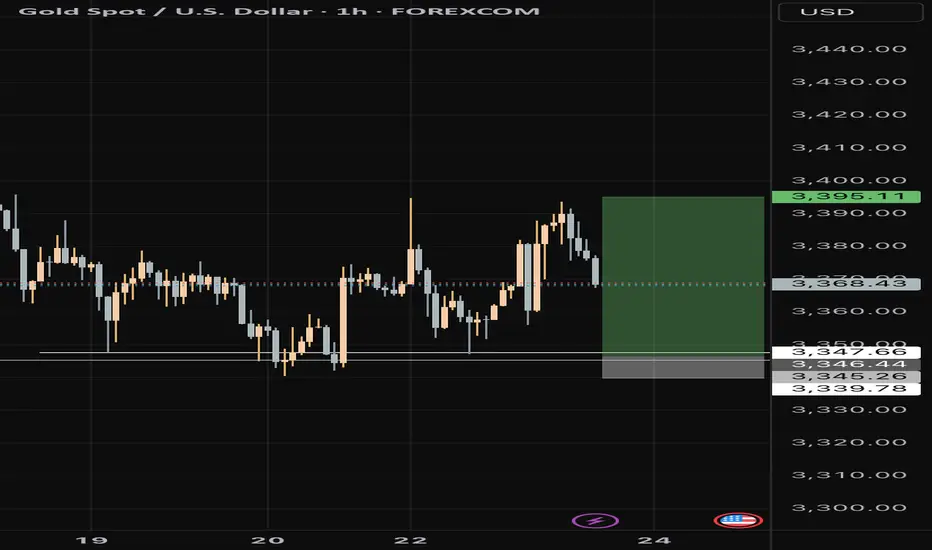
Xau/usdTrade Setup (Short)
Entry (Sell Below): 3,350
Breakdown confirmation of near support
Stop Loss: 3,405
Just above recent swing high
Target 1: 3,260
Support zone and last demand area
Target 2: 3,200
Round number and deeper pullback zone
Risk-Reward: ~1:2.5+

Live Trading Analysis: Gold (XAUUSD), GBP/USD, & USD/JPY. DailyJoin CresserRiba for an in-depth daily technical analysis of the most traded currency pairs and commodities: Gold (XAUUSD), GBP/USD, and USD/JPY. In this video, CresserRiba breaks down key price levels, identifies potential trade setups, and discusses critical market drivers influencing these instruments.
Whether you're a seasoned trader or just starting out, this analysis provides valuable insights into current market trends, support and resistance zones, and potential entry/exit points. Learn how to interpret chart patterns, understand the impact of economic news, and develop a well-informed trading strategy for XAUUSD, GBPUSD, and USDJPY.

Gold Turns Bullish After Clearing Daily Sell-Side LiquidityThe purge of this liquidity indicates that institutional players may have engineered a move to grab orders before initiating a new upward leg. Following this move, price action shows signs of strong bullish intent, such as bullish engulfing candles, increased volume on up moves, or a break above short-term resistance.
This liquidity sweep not only invalidates bearish pressure but also creates a clean bullish imbalance, offering a potential entry zone for buyers. Traders should now watch for:
A break and retest of the key structure above the liquidity sweep.
Bullish order blocks forming on lower timeframes (e.g., H1 or H4).
Confluences like Fibonacci retracement levels, trendline support, or moving average bounces.
As long as price holds above the level of the purge and continues forming higher lows, gold is likely to trend upward in the near term. Potential targets include recent highs or fair value gaps left behind during the bearish move.
This setup favors buying pullbacks rather than chasing price, with invalidation below the recent sweep level.

Gold shorts point to 3245
Gold market analysis: Short-term dominant pattern established, rebound high-altitude main tone
Market review and driving factors
Spot gold fell sharply, with a single-day drop of more than 2%, hitting a low of $3295/ounce (a new low since June 9), and finally closed at around $3322. The decline was mainly driven by two factors:
Geopolitical risks cool down: Iran and Israel reach a ceasefire agreement, and market risk aversion demand weakens;
Fed hawkish expectations strengthen: Powell reiterates cautious interest rate cut stance, and the strengthening of the US dollar suppresses gold prices.
Technical analysis: Short-term dominant, rebound under pressure
1. Daily level: Big Yin breaks, strong short momentum
K-line pattern: The daily line closes with a real big Yin line, confirming the short-term short trend, and the price falls below the shock low of the previous two weeks.
Key support: $3295 (yesterday's low) is the last line of defense for bulls. If it is lost, it may further explore the 3280-3270 area.
Resistance level:
3340-3347 USD (top and bottom conversion position + hourly moving average suppression);
3370 USD (yesterday's high point, strong resistance).
2. 4-hour level: oscillating down, limited rebound
Disk pattern: Yesterday showed an oscillating downward rhythm of "Asia session down → rebound → European session continued to fall → US session bottomed out and rebounded", which is in line with the technical correction expectations.
Moving average system: MA5/MA10 dead cross downward, 3340-3347 area constitutes short-term rebound suppression.
MACD indicator: Dead cross with large volume, but the fast and slow lines are close to the oversold area, so be alert to short-term rebound correction.
Trading strategy: rebound high and empty
Short order strategy (main idea):
Entry range: 3342-3347 USD;
Stop loss: 3355 USD (short order invalid if it breaks through);
Target: 3310→3295 (if it breaks through, look at 3280).
Logic: 3347 is the resistance level after the previous low is broken. Combined with the moving average pressure, the rebound to this point can be regarded as an ideal short-selling point.
Long order strategy (short-term rebound):
Prerequisite: If the Asian and European sessions first fall back to 3300-3295 without breaking, you can try long with a light position;
Stop loss: 3288 US dollars;
Target: 3320-3330 (quick in and out).
Key risk reminder
Upward risk: If Powell's speech unexpectedly turns dovish, or the geopolitical situation changes again, the gold price may break through 3355 and rebound to 3370.
Downward risk: If 3295 is lost, it will accelerate the decline to the 3280-3270 support area, and even test the 3250 mark.
Conclusion and operation suggestions
Overall tone: Under the pressure of the big negative line on the daily line, rebound shorting is still the main strategy, focusing on the pressure near 3347.
Asia-Europe session: If it rebounds above 3340 first, short orders can be arranged in batches; if it directly breaks below 3295, short orders can be followed.
US session: Pay attention to Powell's speech and US economic data, and be alert to the intensification of market volatility.

A clear Sell setup on GoldGold broke a major trend line. Confirmed the change of direction in trend. Confirmed our area of interest . And waited for it all to play out by itself.

XAUUSDTHE united state interest rate stands at 4.25%-4.5%
the US10Y open the day at 4.293% and closes 4.26% a significant drop from may high of 4.62%
the dollar index is heading to 96$ after open 97.611$ to close 97.313$.
Final GDP q/q
Actual: -0.5%
Forecast: -0.2%
Previous: -0.2%
The US economy contracted by 0.5% in the first quarter, worse than the expected 0.2% decline, indicating a sharper slowdown than anticipated.
2. Unemployment Claims
Initial Claims: 236,000
Forecast: 244,000
Previous: 245,000
Initial jobless claims fell by 10,000 to 236,000, lower than forecast and near historically low levels, suggesting that layoffs remain relatively subdued despite economic challenges.
3. Core Durable Goods Orders m/m
Actual: +0.5%
Forecast: +0.1%
Previous: +0.2%
Core durable goods orders, which exclude transportation, rose 0.5% month-over-month, beating expectations and signaling some resilience in business investment.
4. Durable Goods Orders m/m
Actual: +16.4%
Forecast: +8.6%
Previous: -6.3%
Total durable goods orders surged 16.4%, a strong rebound following a prior decline, indicating a pickup in demand for long-lasting manufactured goods.
5. Final GDP Price Index q/q
Actual: 3.7%
This measure of inflation in the GDP deflator remains elevated, reflecting persistent price pressures in the economy.
Summary of Market Implications:
The larger-than-expected GDP contraction signals economic weakness, which could increase expectations for accommodative Fed policy.
The drop in initial jobless claims supports the view that layoffs are limited, but rising continuing claims suggest some labor market softness ahead.
Strong durable goods orders point to underlying business investment strength, providing a mixed but cautiously optimistic outlook.
Elevated inflation as shown by the GDP price index keeps inflation concerns alive.
Overall, the data presents a complex picture of a slowing economy with pockets of resilience and ongoing inflationary pressures
the interest rate remains 4.24%-4.5% ,the bond market remain weak on fiscal policy challenges and pending rate outlook.
the 10 year bond yield is trading around 4.291% -4.26% and edge lower from fundamental outlook.
gold on ascending trendline connecting April till June and found support at 3312-3314.
buyers during newyork session will build momentum on technical to bridge 3350 supply .
break below 3311-3314 will heading to my demand floor .

Gold trend analysis and operation ideasPowell reiterated his hawkish stance at the hearing on June 26, emphasizing the lack of progress in inflation but hinting that the trade agreement may lead to a rate cut, making it clear that "the vast majority of FOMC members support a rate cut this year" and retaining the possibility of a 50 basis point rate cut, pushing up expectations for a rate cut in September to 74%. Policy expectations repeatedly supported the rebound of the US dollar index to the 106 mark to suppress gold prices, but low real interest rates still provide long-term support. Although Trump announced a comprehensive ceasefire between Iran and Israel on June 23, the terms of the agreement are asymmetric and the conflict continues - Israel launched air strikes on Iran's dAO ammunition depot, the US Department of Defense assessed that the strike would only delay the nuclear process for several months, and Iran suspended IAEA cooperation. Goldman Sachs warned that the escalation of the conflict may cause oil prices to soar to $85 per barrel, coupled with Israel's death threats against senior Iranian officials, the geopolitical risk premium continues to support gold prices.
The 4-hour technical pattern is repaired, the short-term moving average diverges upward, and the K-line stands firm on the moving average support and fluctuates upward. In the short term, pay attention to the breakthrough of the 3350 pressure level and the confirmation of the European and American market retracement. The daily price stabilizes at the 3300 support level, and the downward momentum is weakened. The overall pattern of fluctuations is maintained. Be vigilant about the short-term adjustment risk after continuous highs. In terms of operation, it is recommended to arrange short orders in batches in the 3347-3352 area, and strictly stop loss and take profit.
Operation strategy:
It is recommended to short gold when it rebounds to 3347-3352, with a stop loss at 3360 and a target of 3330-3320

XAUUSD:Today's trading strategy
On Tuesday, the news that Trump announced a ceasefire between Iran and Israel dampened the risk aversion sentiment. Subsequently, the news that expectations of interest rate cuts had slowed down led to a further decline in gold prices. During the trading session, it once fell below the 3,300 mark. After the impact of the news weakened, it eventually rebounded to around 3,323, approaching the position where we first entered the market yesterday. Currently, there is no logic in the market. From a technical perspective, The resistance level above is at 3340-45, and the support level below is at 3305-10. We can conduct transactions around this range
Trading strategy:
SELL@3340-45
TP:3310-04
BUY@3305-10
TP:3335-40
More detailed strategies and trading will be notified here ↗↗↗
Keep updated, come to "get" ↗↗↗

XAUUSD:Sharing of the Latest Trading StrategyAll the trading signals today have resulted in profits!!! Check it!!!👉👉👉
Following Trump’s announcement of a comprehensive ceasefire agreement between Israel and Iran, market risk aversion has significantly subsided, with gold prices plunging over $50 at one point. Internal Fed divergence on rate cuts has intensified: if Powell signals limited rate cuts this year, it may strengthen the dollar and suppress gold; conversely, a dovish stance could ease downward pressure on gold prices.
Short-term drivers: The retreat of geopolitical risks and rising risk appetite are the main causes of gold’s decline, while a weakening dollar and potential Fed dovishness still provide support.
Medium-to-long term: Global economic uncertainties, geopolitical risks, and expectations of Fed easing policies continue to form structural support for gold.
Technical Analysis:Bull-bear forces are relatively balanced.Key resistance: Near 3345,Support zone: Focus on 3285–3290.
Trading Strategy:
Adopt a buy-on-dip approach on pullbacks.
buy@3285-3290
TP:3320-3330
Share accurate trading signals daily—transform your life starting now!
👇 👇 👇 Obtain signals👉👉👉

XAUUSD:Short sell at 3340-45
Today's trading needs to narrow down the range. There are signs that the center of gravity below is gradually moving upward. During the Asian session, the highest point reached around 3343. Friends who have already bought short positions here can wait for 3320-25 to take profits and exit. Those who haven't bought can wait for 3340-45 to short, with the target also being 3320-25
Trading strategy:
SELL@3340-45
TP:3320-25
It can be considered to go long when it reaches around 3320-25
More detailed strategies and trading will be notified here ↗↗↗
Keep updated, come to "get" ↗↗↗

Elliott Wave Analysis – XAUUSD Plan for June 26, 2025
🌀 Wave Structure
On the H1 chart, our previous plan anticipated price movement within green wave 3. However, the current price action lacks the sharp, impulsive characteristics typically seen in wave 3. Instead, the overlapping structure of minor waves suggests that we may not be in wave 3. This leads us to consider two primary scenarios:
🔹 Scenario 1 – abc Correction (black):
Price may be forming wave c (black). However, due to the overlapping nature of recent price moves, it is likely that wave c is developing as an ending diagonal (wedge).
➡️ Confirmation signal: A sharp, steep decline that breaks below the 3297 level would signal that wave c has completed.
🎯 Target zone for wave c: 3352 – 3356
🔹 Scenario 2 – Leading Diagonal in Wave 1:
The overlapping price structure could also be forming a leading diagonal (3-3-3-3-3) as wave 1. In this case, price is currently in wave 3 or 4 of this formation.
➡️ Once wave 1 completes, we expect a retracement to the 0.618 Fibonacci level of the entire wave 1 – forming wave 2.
🎯 Target zone for the end of wave 1: 3352 – 3356
📉 Momentum Analysis
Momentum plays a crucial role in determining which wave structure is unfolding.
D1 Timeframe: Momentum is turning upward from the oversold zone – indicating that the downtrend may be ending. This supports the scenario of a leading diagonal wave 1 and suggests we may see a sustained bullish move over the next 5 days.
H4 Timeframe: Momentum is preparing to reverse downward from the overbought zone. This is a key signal to monitor today, especially during tonight’s news events.
If price continues to move sideways within a wedge, it would support the leading diagonal scenario.
If price breaks down sharply, it would favor the abc correction scenario.
🧭 Trade Plan
🔻 Sell Zone: 3352 – 3355
⛔️ Stop Loss: 3362
🎯 Take Profit 1: 3333
🎯 Take Profit 2: 3323
📌 The market’s behavior during the U.S. session tonight will be critical in confirming the wave structure. Stay alert and ready to adjust the trade plan accordingly.

Gold shortWaiting for Ny highs and london highs to hit those liquidy sweeps and then see the reaction.
But i think a nice reversal towards ny lows is around the corner.

Bullish strategy around 3270 in US trading
Gold prices (XAU/USD) once again came under selling pressure during the Asian session on Friday, falling back below $3,300 following a lackluster performance the day before. Gold prices are approaching a two-week low hit on Tuesday as investors await the release of the US personal consumption expenditures (PCE) price index. This key inflation indicator is expected to provide a new interpretation of the Fed's policy outlook and could significantly affect the direction of the US dollar (USD), ultimately determining the short-term direction of this non-yielding gold.
Selling pressure last weekend caused gold prices to fall below 3300, and today the selling pressure continued to fall
⭐️Set gold price:
🔥Sell gold area: 3326-3328 SL 3333
TP1: $3315
TP2: $3302
TP3: $3290🔥
Buy gold area: $3248-$3250 SL $3243
TP1: $3260
TP2: $3270
TP3: $3280⭐️

CHECK XAUUSD SIGNAL READ CAPTAINxauusd sell now ✅
entry point (2336) (3338)
TAKE PROFIT 1: (3326)
TAKE PROFIT 2: (3312)
LAST TARGET(3300)
STOP LOSS (3346)

XAUUSD is still on Rising channel on D1H4 Timeframe Analysis
Gold is currently holding the falling wedge pattern on H1 & Rising wedge on D1 Today we have volume opening Gap on OANDA which is still pending.
Market is holding the Range of 3330-3380
What's possible scanarios we have?
if gold sustained with this falling channel and H4 remains above 3320-3330 then Before the US market, I think gold can still return to around 3350 then 3370.
On the otherhand if The H4 candle closes below 3320 buyying will be limited and market will again the rangbound 3290-3330
#XAUUSD
