XAUUSD: Is Bullish Trend Ended? Or It is just beginning big moveAs we previously stated that price can reverse between 3340 to 3350 region, which was a pivotal point for bulls. Price smoothly moved currently trading at 3376 and possibly bullish move continuing towards 3400,3450 and ultimately reaching 3600.
Following the price’s all-time high at $3500, it experienced a sharp decline and failed to maintain that level. A substantial 2400 pips would have resulted in significant losses for many accounts. Initially, it was perceived as a minor correction, with the expectation of further price appreciation. However, this assumption proved incorrect. After reaching an even higher peak, the price invariably undergoes a more substantial correction.
At 3260, substantial bullish volume surged into the market, necessitated by the presence of a fair value gap. Subsequently, the price experienced a decline, reflecting the prevailing bearish trend, which favoured the bears. However, at 3200, a pivotal level representing a discounted price point, bull volume surged. This powerful bullish impulse propelled the price to 3432, ultimately confirming the bullish trend. AB=CD there recurring pattern emerged weekly. When the price reached the 3432 level as a fair value gap, the CD pattern commenced.
AB=CD we have identified a recurring pattern. It appears to be an equal move in any direction, and it has manifested precisely as anticipated. We were aware that the price would reject at 3120, and it did so accordingly. Currently, the market is in our favour. Upon market opening, it exhibited a positive gap, propelling the price to 3450. However, it subsequently declined, reaching 3384.
Presently, we find ourselves in the accumulation phase, poised for distribution. This distribution is anticipated to be substantial, potentially leading to another record high, potentially reaching 3650.
Moving forward, the price could continue towards our target from its current position. Alternatively, there exists a possibility that it may drain the sell-side liquidity and reverse from 3360-3370.
Our take-profit levels are set at 3450, 3490, 3520, and finally, 3600. When entering the market, it is advisable to employ a short time frame. It is important to note that this analysis is merely our opinion, and market conditions may deviate from expectations.
We extend our best wishes for success and safe trading. If you wish to demonstrate your support, you may consider liking, commenting, or sharing this analysis with others.
Sincerely,
Team Setupsfx_
GOLDMINICFD trade ideas

CHECK XAUUSD SIGNAL READ CAPTAINEntry: around 3350/3348✅
Take Profit 3355✅
Take Profit 2: 3364✅
Last Target: 3374✅
Stop Loss: 3339❌

This chart suggests a bullish bias in the medium term. This is a 1-hour candlestick chart for Gold Spot (XAU/USD) . The chart includes various Smart Money Concepts (SMC) annotations used by traders to anticipate price movements. Here's a breakdown of the key elements and what they suggest:
---
### **Key Annotations & Zones:**
1. **CHoCH (Change of Character)**
* Located near the center of the chart around the 3,335–3,340 zone.
* Indicates a potential trend reversal from bearish to bullish.
2. **FVG (Fair Value Gap)**
* Same region as the CHoCH zone (3,335–3,345).
* A price imbalance where price might revisit before continuing upward.
3. **SSL (Sell-side Liquidity)**
* Highlighted below the current price (around 3,310).
* Denotes liquidity below a previous low where stop-losses from long positions may reside.
* Price could dip here to grab liquidity before heading higher.
4. **BSL (Buy-side Liquidity)**
* Marked near the top (around 3,395–3,400).
* A target area where stop-losses from short positions or breakout buy orders may reside.
---
### **Price Forecast Path (Dashed Arrows):**
* The forecast suggests a **short-term dip** into the **SSL zone**.
* Followed by a **strong bullish move**, possibly triggered after a liquidity sweep.
* The price is expected to return to the **FVG zone**, consolidate, and then push up toward the **BSL zone** at \~3,400.
---
### **Overall Interpretation:**
This chart suggests a bullish bias in the medium term. The trader anticipates:
* A brief decline to gather sell-side liquidity.
* A rally fueled by a CHoCH and FVG retest.
* An ultimate aim to target buy-side liquidity above the recent highs.

XAUUSD GOING LONG📊 CHoCH Spotted (LTF) – Market just broke structure bullish!
📈 Buyers are now in control.
🔻 Waiting for price to pull back into Demand Zone (last bearish candle before the push up).
🎯 Target: Supply Zone above
🛑 SL: Just below Demand Zone
🟢 Looking to buy the dip and ride the bullish wave!

Gold sell target Guys, I have given a sale target, don't miss it and keep the up trade on hold until the last

XAUUSD 1H Analysis – Golden Point in SightPrice is currently making its way toward the Golden Point zone at 3365.120, aligning with the 0.786 Fibonacci retracement from the recent bearish leg. This area also coincides with a descending trendline, adding confluence for a potential reversal setup.
📍 Key Levels:
🔹 Resistance: 3365.120 (Golden Point / 0.786 Fib)
🔹 Support: 3302.571 (Target zone)
🔹 Swing High: 3393.776
🔹 Swing Low: 3295.200
🎯 Trade Idea:
Watching for a potential rejection from the 3365 zone to catch a short down to the 3302.571 area. Bearish confirmation required around the Golden Point before entry.
📌 This setup follows the HurricaneFx Signature Strategy.

CONTINUED GROWTH OR A BREAK DOWN?GOLD 4H TIMEFRAME
Currently on a major support level, if it breaks down at 3284, we can target these previous support levels at 3264 and 3250. Always wait for a retest before entering to confirm that it is not a fake out.
On the other hand, if this bounce and consolidate above 3350 levels, then we have a probability of a continued growth to 3400 and 3440. If the ceasefire got violated and FED hints of a rate cut, 3500 is not just a possibility, it can go higher and make new highs.
When entering trades look for opportunity on lower timeframes like M1, M5 and M15. When analyzing the general direction and bias, it's best to check high timeframes H1, H4 and D1.

Diamond Targets Loaded 🔱 XAUUSD Trade Setup 🔱
Timeframe: 30m
📈 Price is currently respecting the ascending channel with bullish momentum. We have a clear breakout target area identified.
🎯 Target Zones (Diamonds):
💎 Diamond 1 → 3340
💎 Diamond 2 → 3345
💎 Diamond 3 → 3350
🔻 Support Zone: 3330
💣 Treasure Miss (SL): 3328

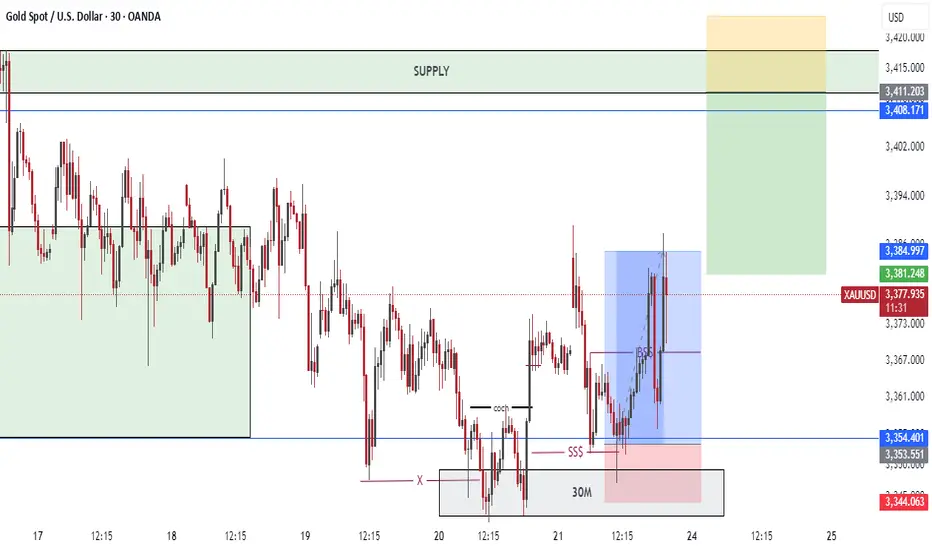
Gold Breakout from Falling Wedge — Targeting 3383🟡 Key Observations & Technical Elements
1. Price Structure
The price has been range-bound within a rectangular blue box.
The range appears to be roughly between 3,340 and 3,400.
There was a previous downtrend indicated by the descending trendline inside the box.
2. Breakout Pattern
Price has broken above the descending trendline within the box (bullish signal).
The breakout seems confirmed by a higher low and higher high structure.
3. Support Zones
A strong support area is highlighted in red below 3,340, showing multiple bounces (demand zone).
Yellow box at the bottom shows a false breakout / liquidity grab before price reversed upward sharply.
4. Target
A target level of 3,383 is clearly marked, suggesting a bullish breakout expectation.
This is consistent with the width of the previous range being projected upward.
5. Indicators
Orange circles highlight key reversal or retest points: one at a resistance-turned-support, and another at a breakout retest.
6. Event Icons
Calendar/event icons (with U.S. flags) below the chart hint at upcoming U.S. economic data releases, likely to bring volatility.
---
📊 Technical Bias: Bullish
Breakout from descending trendline inside range.
Retest successful near 3,350 zone.
Higher lows forming within the range.
Target set at 3,383, slightly below previous highs.
---
📌 Possible Trade Strategy
Entry: After confirmation of breakout and retest (currently done).
Target: 3,383 (as per the setup).
Stop Loss: Below the recent low around 3,345–3,350 zone.
---
⚠️ Risks
The upcoming U.S. data events could invalidate this setup depending on surprises in the releases.
False breakouts are possible in tight consolidation zones like this.

Gold May Slightly Pull Back Around 3,350 USD📊 Market Overview
• Gold is currently trading around 3,340–3,345 USD/oz, supported by a weaker USD and lower U.S. yields, with 60 bps Fed rate cut expected by year-end, starting in September
• The Israel–Iran ceasefire has eased safe-haven demand, triggering a mild pullback, while support remains near 3,300 USD
📉 Technical Analysis
• Key resistance:
3,370 USD (short-term peak)
3,380–3,400 USD (prior highs)
• Nearest support:
3,300 (technical bounce zone)
Next at 3,275 (momentum weak)
• EMA:
Price trading below the 9-period EMA on H4, indicating a mild bearish/choppy short-term trend
• Candles/volume/momentum:
RSI & Stochastics near neutral suggest consolidation or minor retracement .
📌 Outlook
Gold may pull back to 3,300–3,320 if the USD rebounds or geopolitical tensions ease further. However, a Fed rate cut in September or renewed Middle East instability could drive prices back up to 3,370–3,400.
💡 Suggested Trade Plan
• SELL XAU/USD: at 3,365–3,370
o 🎯 TP: 3,345–3,340
o ❌ SL: 3,380
• BUY XAU/USD: at 3,300–3,310
o 🎯 TP: 3,320–3,330
o ❌ SL: 3,290

XAU BUY?XAUUSD Analysis (June 23, 2025)
Overall Bias: Cautiously Bullish. The immediate technical picture on the lower timeframes is bearish, but this is contradicted by an overwhelmingly bullish high-timeframe trend, explosive geopolitical catalysts, and potent astrological alignments pointing to a potential major move higher. The current dip appears to be a pullback before a potential expansion.
Macro-Context (US News & World News):
Fundamental Driver: The dominant factor is the severe escalation in the Middle East, with the US striking Iranian nuclear facilities. This is a classic "risk-off" event that triggers a flight to safety. Gold, as the ultimate safe-haven asset, benefits immensely from this level of geopolitical instability. This factor alone provides a powerful bullish undercurrent.
US Dollar (DXY) Analysis: The DXY is a conflicting factor. It has been weak for most of 2025 but has recently found support and is consolidating. A stronger-than-expected NFP report on June 6 and a Fed reluctant to cut rates are providing the dollar with some strength. Typically, a stronger dollar pressures Gold lower.
Conclusion: We have a direct conflict. A strengthening DXY is bearish for Gold, but a major war involving Iran is profoundly bullish. In this scenario, the fear and uncertainty from the geopolitical crisis are the more powerful, immediate driver. The macro bias is therefore bullish on Gold.
Risk Calculation:
Asset: XAUUSD
Bias: Bullish Reversal
Entry: Look for entry near $3,340 after a 5-minute bullish confirmation candle at the 0.5 Fib support level.
Stop Loss: Place SL below the key Fib level and the low of the confirmation candle, e.g., $3,325.
Risk: $15.
Take Profit (3:1 R:R): $3,340 + ($15 x 3) = $3,385.

Hanzo Drex | 30-Min Break Out Setup – 200 Pips in Sight🔥 Gold – 15 Min Scalping Analysis
⚡️ Objective: Precision Break out Execution
Time Frame: 15 -Minute Warfare
Entry Mode: Only after verified Break out
👌Bullish Break : 3333.5
Price must break liquidity with high volume to confirm the move.
☄️ Hanzo Protocol: Dual- Entry Intel
Zone Activated: Deep Analysis
➕ 4 wicks connected at 3333
➕ 7 wicks connected at 3329.5
➕ Body Close at 3328
➕ Body Close at 3334
➕ Liquidity at 3344

Xauusd Going Towards BuyDespite rising selling pressure on the dollar and mixed US PCE numbers, Gold prices fell further on Thursday, reaching new four-week lows around $3,260 per troy ounce. Collaborating with the decline, recent improvements in the Israel-Iran conflict continue to fuel investor withdrawals from the safe haven region.


Gold 1H IdeaGold still not starting bullish trend. More down continues . Hope it will reach next week. Good luck.

Any ideas about XAU?Who has here best of Elliot count - both versions bull and bear...? Blease comment below... thanks.
I am looking Elliott specialists who share work here or in web?

XAUUSD Trade ideaPrice has given us tp in buy now we are waitin patiently for our sell setup.
Watch market structure on LTF .
Please follow to support .
gold breakout and retest 1st retest failed after breakout and tried second retest. and it passed but hunted my stoploss.and then continued downward as planned

XAUUSD eyes potential bearish batOn the 4-hour chart, XAUUSD stabilized and rebounded in the short term. Currently, we can pay attention to the upper resistance near 3382.5. After it reaches that level, we can pay attention to the potential bearish bat pattern. At the same time, this position is in the previous supply area.

Gold Short Term OutlookYesterday, we noted that gold needed to close and hold above the $3,330 resistance to open the path toward $3,346 and potentially $3,375.
Since then, price rejected the intraday support and is now trending above the $3,330 level.
Currently, the 50MA is acting as dynamic resistance. A clean break above it could trigger a move toward $3,346 and possibly higher resistance zones.
However, if bullish momentum fades, price may drop back toward the key support area, where buyers could look to step in again.
🔑 Key Levels:
Resistance:
$3,330 • $3,346 • $3,361 • $3,375
Support:
$3,306 • $3,287 • $3,271 • $3,242

XAUUSD Long IdeaSeeing a buying momentum on XAUUSD at the extreme demand zone until the external range liquidity due to upside momentum on the higher time frames. the daily time frame mived into the OTZ further confirmation, on the 1 hour and 45 min it traded into a demand zone and created a Bos further confirmation on this trade

XAUUSD SHORT SELL IDEASeeing that with everything going on, fundamentals indicate that the price of gold should slump in the short term. Our analysis shows that many points point towards a short trade.

XAUUSDPlease be advised that ongoing geopolitical tensions and conflict in the Middle East have the potential to significantly influence global financial markets, particularly commodity prices such as gold.
Historically, gold has served as a safe-haven asset during times of political and economic uncertainty. In light of current developments, increased investor demand for gold may drive prices higher, potentially pushing towards or even surpassing previous all-time highs.
While this projection is based on current market sentiment and historical trends, it is not a guarantee of future performance. Prices are subject to change due to a wide range of factors, including but not limited to geopolitical developments, interest rates, currency fluctuations, and global economic data.
Investors are advised to exercise caution and conduct their own due diligence or consult a licensed financial advisor before making any trading or investment decisions related to gold.
