McDonald’s Attempts a BreakoutMcDonald’s has trended lower since late October, but now may be attempting a breakout.
This chart shows the declining trendline in place since October 23 and the 50-day simple moving average (SMA). MCD pushed above both -- for the first time since the recent slide began.
Next, the recent low on January 4 was higher than the December low. This has created a potential inverse head-and-shoulders pattern.
Fundamentally, the hamburger chain has been adapting the new normal with major digital upgrades. It tried to rally after results beat estimates on November 9, but couldn’t overcome the bearish momentum at the time. (That’s also when coronavirus cases were starting to climb again.) However, MACD has turned positive since then.
TradeStation is a pioneer in the trading industry, providing access to stocks, options, futures and cryptocurrencies. See our Overview for more.
MCDL trade ideas

Traditional|MCD|Long and shortLong and short MCD
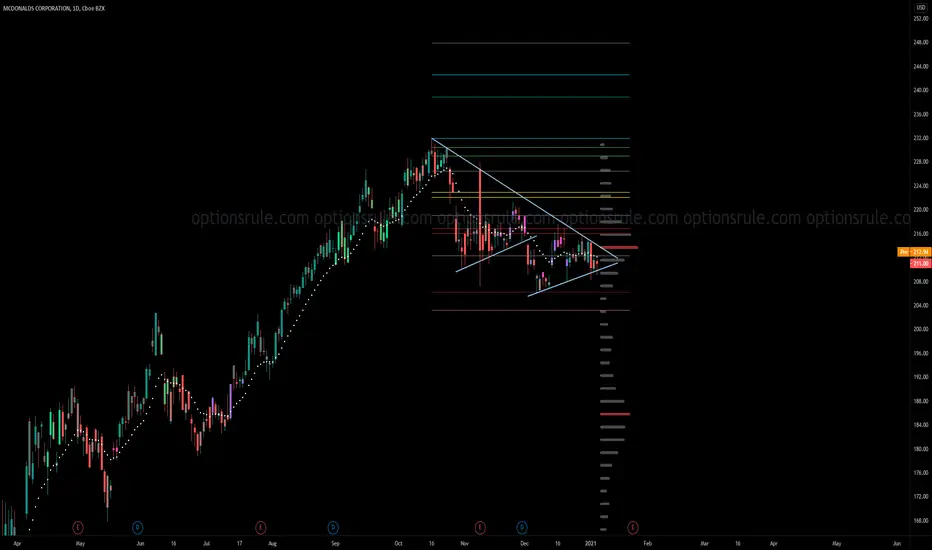
Activation of the transaction only when the blue zone is fixed/broken.
Working out the local support and resistance levels of the triangle.
The breakdown of the upper blue zone - long.
Breakdown of the lower blue zone - short.
Working out the stop when the price returns to the level after activation + fixing in the red zone.
Blue zones - activation zones.
Green zone - take zone.
Red zone - stop zone (S-SL short stop, L-SL long stop).
Orange arrows indicate the direction of the take.
Red arrows indicate the direction of the stop.


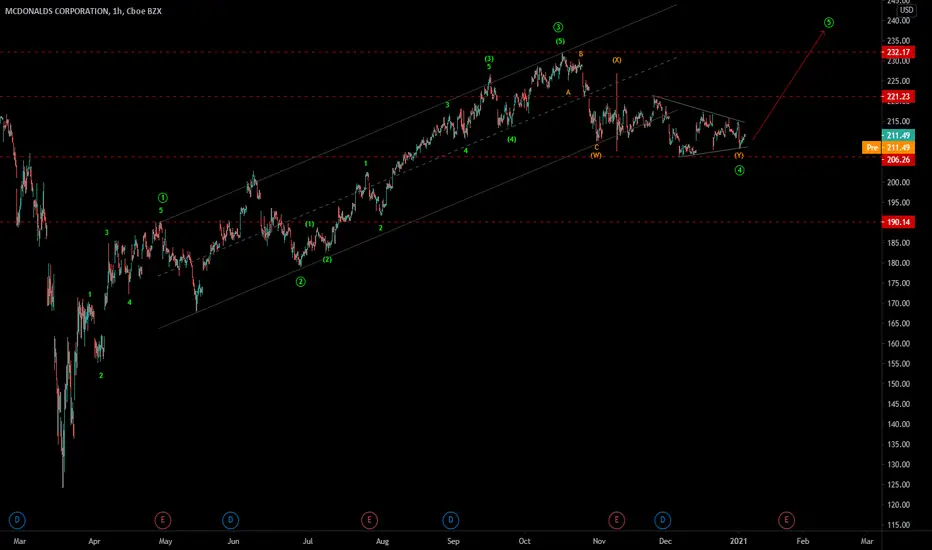
MCD - EW analysis - 5th wave - need confirmation before trade MCD - It is in Y wave triangle of 4th wave correction and expected to go higher in 5th wave. But need confirmatory triangle break out and impulse up as reference before taking any entry for buy set up.
Give thumbs up if you really like the trade idea.

McD Short Term Idea (Jan 4th 2021 through Apr 2021)McDonald's (January 4th 2021 through April 2021)
Assuming a bullish path:
Low: $201
High: $230-244 (or more)
Assuming a bearish path:
Low: $186
High: $220
Long term idea attached here:
Thanks for tuning in :) Disclaimer, anyone in the trade needs to do their own due diligence and decide what is right for YOU. My charts can be wrong at any time and it's very important that you have your own strategies and plans in place. I run this channel for my own educational purposes of learning to trade, and I will never be 100% right, so please do not let me confirm any bias for you! (Dangerous to do so, stay safe and remember the basics & rules of risk assessment.) Expect the unexpected and happy trading!

McD Long Term Idea (Jan 2021 through Jan 2023)McDonald's (January 4th 2021 through January 2023)
Assuming a bullish path:
Low: $190-$201
High: $252 (at the very least)
Assuming a bearish path:
Low: $124
High: $220
Trying to do some more long term forecasts just for practice! This could definitely be very wrong so don't take my word for anything!
Related idea is a shorter term forecast below:
Thanks for tuning in :) Disclaimer, anyone in the trade needs to do their own due diligence and decide what is right for YOU. My charts can be wrong at any time and it's very important that you have your own strategies and plans in place. I run this channel for my own educational purposes of learning to trade, and I will never be 100% right, so please do not let me confirm any bias for you! (Dangerous to do so, stay safe and remember the basics & rules of risk assessment.) Expect the unexpected and happy trading!

Weekly Outlook(patterns to watch)$QQQ $EA $MCD $CMCSA $GLD $LAZRHere, I go over a few patterns I am looking at for the coming week, It looks like we have a few good set ups to start us off for the new year!


MCDtriangle breakout out of the channel. Failure to break above last week high might bring it lower to complete C wave

MCDIts at weekly support with some testing. So this ones interesting to me as well on daily and 240 min pull backs into those targets up there

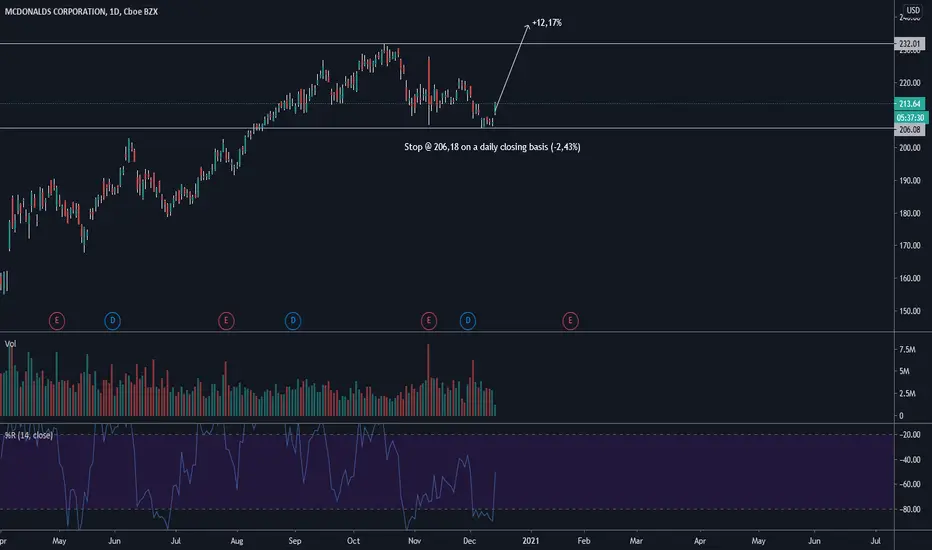
MCDO CORP LONG with POTENTIAL +5% RETURN and MORE Nice potential for MCDO CORP with the price showing support at $214.
I am expecting A LONG POSITION with a first target at $227 = +5% and holding the position for more RETURNS.


Buy Signal: 215.05Stop: 205.00
Model range play back toward highs.
Ingenuity Trading Model is an algorithm used in- Stock, Forex, Futures, and Crypto markets. The model is a Geometric Markov Model: Our model focuses on the transitions between 3 geometric states- Range, Continuation, and Reversal
In probability theory, a Markov model is a stochastic model used to predict randomly changing systems. Markov Models are used in all aspects of life from Google search to daily weather forecast. The randomly changing systems we focus on are the equity, futures, and forex markets. The geometric element of the model is the fractal sine wave structure you can find on any chart you look at across any market and across all time dimensions.
For questions or more information feel free to contact me in the comment section or via private chat. To view the entire portfolio and track our performance visit our site.

MCDBreaking above 215.00 . Will be the
first possign here for the targets
of 228 -231-237,
conservative stop loss 212. Stop


McDonalds : enough for the decline?McDonalds shows some resilience on Tesla-triggered sell-off. It might have been pressured already hard enough.
If #MCD is taken Long at 208.50 or lower (mind the morning opening) target could be 235 and even 248. Not overnight but gradually. Stop could be placed at 202 as if it drops there the whole picture might be different.

MCD - I'm lovin it!Quick update on Mc Donalds! NYSE:MCD
Because of the price movement this morning, i decided to open a long position in mc donalds.
The wave 4 correction is very likely over and we will start our journey to prices of 250$ or more.
Primary scenario:
In the next days and weeks we will see a solid uptrend, wave 5 should bring us to atleast 250$
From there we will start a short correction, in the long run mc donalds can reach prices up to 300$
Alternative scenario:
My alternative scenario will get triggered if we break the previous low.
The bears will bring mc donalds directly to prices of 190$ or lower.
Long 1#
Entry: 212.22$
Profit target: 250 and more !
Stop-Loss: None - Buy and hold

MCD completing perfect cup - shortWith MA 50 and 200 crossing, MCD is completing its reverse cup form. Price target 184

LONG MCDExpecting bounce from extremely oversold weekly and daily levels. If stop breached, be prepared to catch new daily reversal on lower levels with a tight stop.
Mc Donalds - My theory why to go longThis is my diary about MC Donalds Stock. I see a great opportunity to buy MC donalds as it gets closer to $197-$200.
I'm using a 1:2 risk on this trade.
This is not advice, Trading involves huge risk, do so at your own will

*Yawn* Will it consolidate until Feb 2021? - Cycle AnalysisI love MCD. I even love their fries some times.
MCD has done great during the pandemic. But this stock is tired.
NYSE:MCD has seen a decline, while analyst have set a reduced price target of $225.
This is achievable for MCD. But when?
Based on cycle analysis, it would seem MCD's real momentum will only come through by Feb, hitting the price target or higher by March 2021.
The hope, of course, is MCD finds momentum from the shorter cycle (pink surprise arrow tracking this) and jumps back into the yellow channel. This may happen as a build up to earnings. But, most likely, I expect MCD to trade in the white arrows at this stage.
Yellow Channel - This is the stock's trend channel dating back all the way to 2015. MCD should (and will soon) jump back into this channel for long-term growth.
Good luck!
