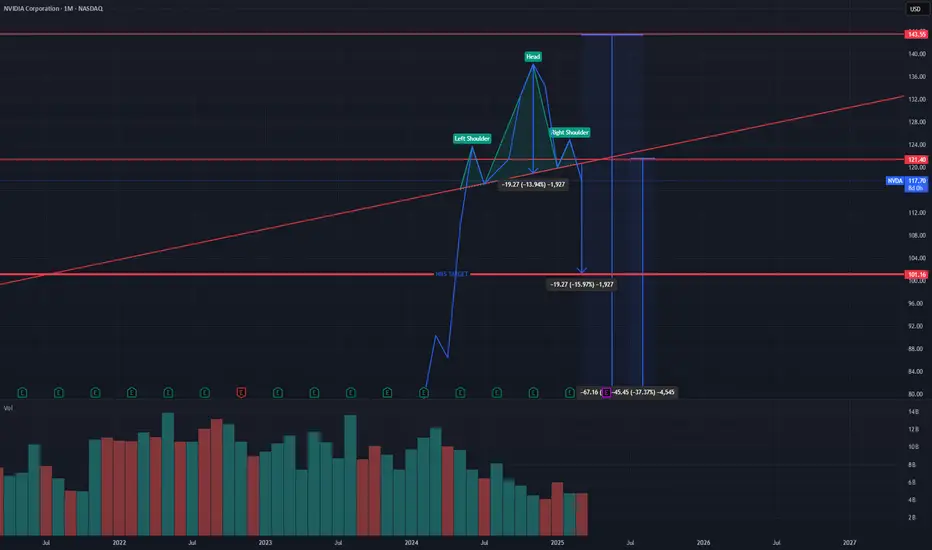
$NVDA H&S on Monthly...Linking previous short of NVDA. The right shoulder is technically not finished forming. However that trendline was tested not long ago.... will it hold? Who knows.
First target would be ~$100. If this plays out there will likely be a larger mark down phase consisting of retail panic selling. This will push toward $80 with a possible shakeout near the low/mid $70s before a long term accumulation process begins by big money.
Just because I am short on the stock does not mean I don't believe in the company or stock longer term. Have money on the sidelines to buy incase this plays out.
NVDA trade ideas
AAPL, NVDA, MSFT & XPS: High-Probability Trade Setups This WeekWeekly Trade Radar & Market Outlook
This week, my focus is on AAPL, NVDA, MSFT, and XPS. There could be a potential retest of the 200 SMA with AAPL and MSFT, offering opportunities for well-structured trades. NVDA looks weak and has already tested the 200 SMA, making it a candidate for further downside potential or a short-term bounce. Additionally, Chinese developments in AI chip production remain a factor that could influence price action, particularly with NVDA. Staying aware of these key levels and macro developments is crucial for trade execution.
📚 Trading Plan: Ichimoku & 200 SMA Monthly Options Strategy**
📌 Strategy Objective
This strategy aims to capitalize on **high-probability trend-following setups** by using the **Ichimoku Cloud and 200 SMA** for confirmation while trading **monthly options contracts** to minimize time decay risks.
📀 Trading Rules
✅ 1. Entry Timing Rules (Your 3 Golden Rules)**
🚫 **No trading on Mondays** (Avoid weekend gaps & false breakouts).
🚫 **No trading on Fridays** (Avoid weekend time decay & volatility).
⏳ **No trades before the first 15-minute candle closes** (Avoid market noise).
📊 Setup & Trade Criteria
🔹 2. Trend Confirmation Using Ichimoku & 200 SMA
Bullish (Call Trade) Criteria:
✅ **Price is above the 200 SMA** (bullish bias).
✅ **Price is above the Ichimoku Cloud** (strong uptrend).
✅ **Tenkan-sen is above Kijun-sen** (momentum confirmation).
✅ **Chikou Span is above price from 26 candles ago** (historical trend alignment).
✅ **Future Cloud is green** (trend continuation signal).
Bearish (Put Trade) Criteria:
✅ **Price is below the 200 SMA** (bearish bias).
✅ **Price is below the Ichimoku Cloud** (strong downtrend).
✅ **Tenkan-sen is below Kijun-sen** (momentum confirmation).
✅ **Chikou Span is below price from 26 candles ago** (historical trend alignment).
✅ **Future Cloud is red** (trend continuation signal).
🔹 3. Entry Triggers (After First 15-Min Candle Closes)**
**Bullish (Call Trade) Entry:**
- Price pulls back to **Kijun-sen** and holds support, then starts to bounce.
- OR price **breaks above the Ichimoku Cloud** and holds.
- ✅ Enter **Call contract (monthly expiration)**.
**Bearish (Put Trade) Entry:**
- Price pulls back to **Kijun-sen**, rejects resistance, and starts falling.
- OR price **breaks below the Ichimoku Cloud** and holds.
- ✅ Enter **Put contract (monthly expiration)**.
🔹 4. Selecting the Right Option Contract
✅ Monthly expiration contract (third Friday of the month).
✅ 30-60 days to expiry (avoid rapid theta decay).
✅ Strike Price:
- **ATM (At-The-Money) or slightly ITM (In-The-Money)**.
- Delta between **0.55 – 0.70** for balance between premium & movement.
✅ Liquidity Criteria:
- **Open Interest > 1,000** for easy fills.
- **Tight bid-ask spread** (<$0.10 on liquid stocks).
🎯 Risk Management & Trade Management**
🔹 5. Stop Loss & Take Profit Rules**
Stop Loss (SL):
🔴 For Calls: Below the Kijun-sen or most recent swing low.
🔴 For Puts: Above the Kijun-sen or most recent swing high.
Take Profit (TP):
✅ First Target: At the opposite edge of the Ichimoku Cloud.
✅ Second Target: Key support/resistance level based on price action.
✅ If profit reaches 70-80% max potential, close early** to avoid theta decay.
---
🔹 6. Trade Adjustments**
🔄 Rolling:If trade is profitable near expiry but hasn’t hit full target, roll to next monthly contract.
🔄 Cutting Losses: Exit early if price **closes inside the Ichimoku Cloud** (loss of trend strength).
📊 Trade Example: Bullish Call Play**
- Stock:** AAPL
- Current Price:** $190
- Bias: Price is above 200 SMA and Ichimoku Cloud
- Entry Trigger:** Price pulls back to Kijun-sen and bounces
- Option Contract:
- Expiry: **Next monthly contract (e.g., July 19 expiration)**
- Strike: **$190 ATM Call**
- Delta: **0.60**
- Bid/Ask Spread: **$2.00 / $2.05**
- Entry Price: $2.05
- Stop Loss: Below Kijun-sen (~$187)
- Take Profit:
- First TP at $195 (Cloud resistance)
- Final TP at $200 key resistance
🔹 7. Why This Strategy Works?**
✅ **Avoids weak setups by following strict entry rules**.
✅ **Uses monthly contracts to avoid rapid time decay**.
✅ **Combines trend-following confirmation from Ichimoku & 200 SMA**.
✅ **Ensures liquidity & better risk management with ATM/ITM options**.
📀 Final Notes
🔹 Only trade **Tuesday to Thursday** to avoid low-probability days.
🔹 Wait for **first 15-minute candle to close** before entering.
🔹 Stick to **monthly contracts** for better theta control.
🔹 **Follow trend confirmation rules strictly**—no guessing.
Turning a Small Trading Account into a Side Hustle for Financial Freedom
Imagine having a skill that allows you to generate income from anywhere, with nothing more than your phone, iPad, or laptop. No need for an expensive setup, no need for hours glued to a screen, and no need to risk everything on a single trade. This is the power of trading options with a small account—starting with as little as $500 and scaling up over time to create financial security, eliminate debt, and build leverage for larger investments.
Weekly Trade Radar & Market Outlook
This week, my focus is on AAPL, NVDA, MSFT, and XPS. There could be a potential retest of the 200 SMA with AAPL and MSFT, offering opportunities for well-structured trades. NVDA looks weak and has already tested the 200 SMA, making it a candidate for further downside potential or a short-term bounce. Additionally, Chinese developments in AI chip production remain a factor that could influence price action, particularly with NVDA. Staying aware of these key levels and macro developments is crucial for trade execution.
Trading Method: Ichimoku Cloud & 200 SMA Strategy
For trade setups, I rely on a combination of the Ichimoku Cloud and the 200 SMA to confirm entries and exits. This system provides a structured approach to trading by identifying trend direction, support and resistance levels, and potential breakouts.
Identify the Trend – The 200 SMA serves as the key trend indicator. If price is above, we look for long opportunities; if below, short setups take priority.
Ichimoku Confirmation – Price action should align with the cloud structure:
Bullish trades: Price above the cloud with strong momentum.
Bearish trades: Price below the cloud with confirmation of weakness.
Entry Timing – Trades are entered after the first 15-minute candle closes to avoid early market volatility. No trades on Mondays or Fridays to maintain consistency and avoid false breakouts.
Monthly Options Contracts – Focusing on monthly expirations allows for strategic entries with enough time for price movements to develop.
Risk Management – Stop losses are set just below key Ichimoku or 200 SMA levels, ensuring a disciplined risk-reward ratio.
How This Can Work as a Side Hustle
Many people look for side hustles to supplement their income, but most involve long hours, additional expenses, or require significant effort to scale. Trading options, however, offers:
✅ Minimal time commitment – With the right plan, you spend less than an hour per day analyzing and placing trades.
✅ Low startup cost – Start with as little as $500 and build from there.
✅ No physical inventory or overhead – You don’t need to buy and store products.
✅ Scalability – As your account grows, you can increase contract size and compound gains.
✅ Financial freedom potential – The profits from consistent, disciplined trading can be used to pay off debt, invest, or build long-term wealth.
The Power of Leverage: Using Trading to Build Wealth
The ultimate goal of trading isn’t just to make a little extra cash—it’s to create financial leverage. Here’s how smart traders use small account growth to create lasting financial success:
1️⃣ Get Out of Debt – Use profits to pay off credit cards, student loans, or other financial burdens. Imagine the freedom of being debt-free.
2️⃣ Reinvest in Larger Opportunities – Once your small account grows, you can scale up your trades, fund larger investments, or even start a business.
3️⃣ Build a Safety Net – Having extra cash flow from trading can serve as an emergency fund, helping you navigate life’s unexpected challenges.
4️⃣ Create a Path to Full-Time Trading – For those who love the process, this side hustle can evolve into a primary source of income over time.
It’s About Discipline, Not Just Trading
The key to successful trading isn’t the market—it’s you.
Many traders fail because they lack the discipline to follow a system. This approach isn’t just about making money; it’s about becoming the kind of person who can execute a plan without emotion, without impulsiveness, and without shortcuts.
Success in trading mirrors success in life: patience, discipline, and consistency always win.
Getting Started – No Excuses
You don’t need a fancy setup. You don’t need to be a finance expert. You just need a phone, iPad, or laptop, a brokerage account (I use Robinhood for its simplicity), and a commitment to mastering a system that works.
If you’re looking for a low-stress, high-reward way to build financial security, trading options with a small account might be the perfect opportunity. It’s time to take control of your future—one trade at a time.

NVDA Long Term Bullish by V lineI’ll looking to buy shares around 110-105
First TP 128
Second TP 134
Third TP 141
Looking Plan to buy shares: 40-30-30 Or 50-30-20

nvda buy alert it bounced to a low or new high at every vertical line and it finally found support at the last blue vertical line

Buying Opportunity Amid Correction?Technical Analysis: NVIDIA has completed a bullish Elliott Wave cycle, reaching a high of $153.13 (wave V). It is currently in a corrective phase, with a recent drop to $116.72. Key support levels to watch are $105.88 and $81.16, which could be attractive levels for a long-term entry. If the price drops to $81.16 (50% retracement), it could be a buying opportunity, as NVIDIA has historically bounced from important support levels. Longer-term, a new bullish cycle could take the price toward $183.20, but it must first complete this correction.
Market Context: The market has experienced recent declines due to macroeconomic concerns, such as inflation and interest rates, along with an investor rotation toward defensive sectors. The technology sector, including NVIDIA, has been particularly affected by fears of weaker chip demand and elevated valuations.
Fundamental Outlook: Despite the correction, NVIDIA remains a leader in AI, gaming, and data centers. Demand for its artificial intelligence GPUs remains strong, and its market position is solid. However, investors should be aware of macroeconomic risks and competition in the semiconductor sector.
Recommendation: For long-term investors, the $105.88 and $81.16 levels could be attractive entry points, with a long-term target of $183.20. However, it is recommended to wait for confirmation of a rebound from these supports and monitor market conditions. For short-term traders, the current volatility could offer trading opportunities in both directions.
#NVIDIA #NVDA #TechnicalAnalysis #Investment #StockMarket #ElliottWaves #Technology
Conclusion
NVIDIA is in a corrective phase after a significant rally, and recent market declines have amplified this correction. However, the support levels identified on the chart could offer buying opportunities for long-term investors, especially if the price drops to $81.16. Despite the macroeconomic challenges, NVIDIA's fundamentals remain strong, making it an attractive candidate for a long-term recovery.

$NVDA downside? h&s?Hello, thinking another move to $110 in the next week. Head and shoulders formed here in a downside tape?
WSL

$NVDA and Elliott Wave.My reasoning;
Wave 2 of the Wave was a Zigzag from the weekly time frame, and as per the rules, Zigzags must be followed by Flats in any correction-- meaning our Wave 4 must be a Flat. Indeed, Wave 4 is a Flat, seen clearly in the daily time frame and it begins after Wave 3(in Black), with a three wave move that is not deep enough to be a correction. This is normal for Wave A in any Flat and is labelled in Dark Blue. After Wave A was completed, we would expect a Wave B and as per the rules, Wave B must go beyond Wave 3's ending. This can be clearly seen in both the daily and weekly time frames. Back to the daily time frame and we can take a closer look at Wave B that is still unfolding. Elliott rules dictate that B must be a three Wave move with two impulses and one corrective wave. The first impulse was formed and the second(corrective) was a Flat which is a corrective structure. Now all that is left is the third wave which will be the second impulse that will complete the Wave B(Dark Blue). Upon completion of this Wave B we could expect a Wave 4 to the downside.
All these Waves have been measured by the Fibonacci Retracement tool.

NVDA: Continuation of the upward trendOn NVDA we would have a high probability of having a continuity of the upward trend given the different configurations on the chart.

Nvdia has a new Aggressor.The boxes you are observing are the Larger scale supply and demand zones. These areas map out the current large liquidity. This includes the newest Player (collective players). This new player has been aggressively on the 17th and 18th.
Why does identifying a new aggressor matter?
New aggressors shape the way we view previous areas of supply and demand. Some look at the price getting to their target, without giving any thought to HOW it gets there.
In this instance:
Previous supply and demand have been established (we do not know how big they are or who is stronger). Some clues we do have is how it approaches these areas, and new aggressors can give us the clues we need... Will it bounce off demand? or fulfill it and continue lower?
New aggressors can put more pressure on these Demand or supply zones simply because they are becoming more aggressive closer to these areas.
Prediction
Scenario 1
Rolling over, and touching the 106 demand zone. Get's bought up, and new aggressors presents themself (bringing more demand). Price Target = 123.
If there is continued demand through this area, a case can be made for a 138 target before a correction/ reversal.
Scenario 2
New demand chews up this new aggressor. We should then have a bullish run to 131. 131 would present itself as a great short-term options (short).
Scenario 3
Rolling over with NEW (short) aggressors. This will put tons of pressure on the 106 players, and hopefully the 96's hang on (not charted).
Please feel free to share you input, thank you for taking the time.
Happy Trading!

Bear flag or bull flag?Could this be a bear flag or bull flag on 1hr chart. If we are truly in a bear market this could be very well be a bear flag. Specially with the death cross imminent.

NVDA) Approaching Critical Resistance – Breakout or Rejection?Technical Analysis & Options Outlook
📌 Current Price: $118.79
📌 Trend: Reversal in Progress with Key Resistance Ahead
📌 Timeframe: 1-Hour
Price Action & Market Structure
1. Bullish Reversal Underway – NVDA bounced strongly from the $115 demand zone, forming a higher low structure.
2. Break of Structure (BOS) Confirmed – Buyers took control, pushing above recent resistance.
3. Change of Character (ChoCh) Detected – Indicating a shift from bearish to bullish momentum.
4. Key Trendline Test – NVDA is now pressing against the upper trendline resistance, a crucial level for either breakout or rejection.
5. MACD & Stoch RSI – Showing bullish momentum, but approaching overbought conditions, signaling possible short-term consolidation.
Key Reversal Detection & Trendline Details to Watch
* Reversal Zone Detection – The red box indicates the prior liquidity grab area, where sellers were exhausted, leading to the current reversal.
* Trendline Resistance – The current uptrend is testing the diagonal resistance level. If NVDA clears $120–$122, it may lead to an acceleration toward $125–$130.
* Trendline Support – If rejected at $120, expect support retests at $115, followed by $110 PUT Wall support if selling pressure returns.
Key Levels to Watch
📍 Immediate Resistance:
🔹 $120 – $122 (Trendline & Minor Resistance)
🔹 $125 – $130 (CALL Resistance Zone)
🔹 $135 – Major Gamma Target Level
📍 Immediate Support:
🔻 $115 – 2nd PUT Wall Support
🔻 $110 – Highest PUT Support & Major Reversal Zone
🔻 $104.77 – Critical Downside Risk Level
Options Flow & GEX Sentiment
* IVR: 24.5 (Low Implied Volatility, favoring directional moves)
* IVx: 50.5 (-6.71%) (Declining volatility)
* GEX (Gamma Exposure): Bearish Bias, but improving
* CALL Walls: $125 & $130 (Potential take-profit zones)
* PUT Walls: $115 & $110 (High liquidity zones where buyers may step in)
📌 Options Insight:
* Above $120, NVDA could see a momentum breakout toward $125+, forcing dealers to hedge by buying shares.
* Below $115, risk increases for a test of $110 PUT Wall, where liquidity is concentrated.
My Thoughts & Trade Recommendation
🚀 Bullish Case: A breakout above $120 could accelerate NVDA into $125–$130 due to CALL gamma buildup.
⚠️ Bearish Case: If NVDA fails at $120 and loses $115, expect a retest of $110, which aligns with major PUT support.
Trade Idea (For Educational Purposes)
📌 Bullish Play:
🔹 Entry: Above $120 Breakout
🔹 Target: $125–$130
🔹 Stop Loss: Below $115
📌 Bearish Play (Hedge Idea):
🔻 Entry: Rejection at $120
🔻 Target: $115 – $110
🔻 Stop Loss: Above $122
Disclaimer
This analysis is for educational purposes only and does not constitute financial advice. Always perform your own research and manage risk accordingly.
Final Thoughts
NVDA is in a critical breakout zone. A strong move above $120 could lead to a sharp rally, while failure could send it back toward $115–$110 for a potential retest. Stay patient and watch for confirmation before entering a position.

NVIDIA - AFTER FED-positive inflation expectation
- more rate cuts expected
- bearish US market
>same retracement target

NVidia Long Lurking. 93% Win Rate.This morning I finished back testing NVidia from 1999. I used 25k as the start up capital but that is besides the point.
The Point is that indicators are pointing out that the next long around is "around the corner". Similar to TESLA but NVidia has bigger.
When can we expect this to happen?
So on average from when the indicators start whispering that a long position might be coming up is an average of 60 days. But following simply this methodology is risky on its own as some signals are produced 15 days and some at 160 days. There is also another approach that intrigues me. A handful of the signals are almost back to back which is great for multiple entries when you measure just these the average is about 240 days. This coincides with Crypto's ETH which has given its heads up signal, which is an average 241.5 days. This all speculation at the end of the day and the signal will come when it does.
So why post this if it could be that far ahead?
I thought I would let people know that indicators are whispering.
Here are some other indicators to take note of:
The higher timeframes are a bit more clearer at the moment. The snapshot as of now indicates some sort of move downwards. This could be 96-98 region in the shorter term especially if we are expecting 60 days before a buy signal is produced.
The back testing did also reveal that no signal was produced from 2011 to about 2018. It did catch the massive moves up but the exit signal did cut the party short in a few trades.
The last signal was in October 2022 which was the Covid Rally. So it could indicate something big is coming globally but let me put my tinfoil hat down.
Stay adaptable and Open minded.

BUBBLE RUN of global marketsTheory! I just like to visualize similar global market events.
NASDAQ:NVDA now vs. Cisco from 1991-2002 — it looks almost identical.
The years 2026-27 could mark the final stage of the current “bubble run”:
> an enormous number of crypto ETFs (even for worthless shitcoins)
> overleveraged funds, from small players to industry leaders
> AI projects with minimal revenue but insanely high infrastructure costs
> soaring Gold prices alongside a decade-long decline in the U.S. manufacturing index, all while the stock market remains expensive
> OpenAI, crypto exchanges, and AI companies with no real revenue planning IPOs in 2026+
I believe we are currently in a Bubble Run!
This could be great for Bitcoin, because historically, Gold (over the past 100 years) has reached all-time highs during the final phase of a stock market bubble and continued rising until the market’s final dip. Then, smart money starts a new bull cycle — selling gold to buy cheap stocks.

I HAVE A NEW STRATEGY! Watch it work for me. SAYS SELL🚨 Exclusive Trading Opportunity – Limited Time Only! 🚨
I've developed an amazing new trading strategy that’s completely unique and never seen before! It’s called the Skyline Scalping Strategy, and it’s designed to pinpoint market direction with extreme accuracy—something that can easily be back-tested by reviewing my previous predictions.
For a limited time, I’ll be posting daily trade signals based on this strategy, allowing you to see exactly where I anticipate the market will move next. Whether you're an amateur trader or a seasoned professional, this is your chance to witness something game-changing in action.
⚠️ Disclaimer: I’m not providing financial advice—just sharing the direction I am planning to make money. The Skyline Scalping Strategy works exclusively on the daily chart, so stay tuned and watch as the predictions unfold!
FOLLOW NOW and don’t miss out on these powerful insights! 📊🔥
Vertical lines are colored and placed to indicate the expected direction of the price. Just my thoughts.

Nvidia Partners With General Motors to Build Self-driving CarsNVIDIA Corporation, a computing infrastructure company, provides graphics and compute and networking solutions in the United States, Singapore, Taiwan, China, Hong Kong, and internationally Partners With General Motors to Build Self-driving Cars.
Also in another news, IBM Taps NVIDIA AI Data Platform Technologies to Accelerate AI at Scale.
Apparently, shares of Nvidia (NASDAQ: NASDAQ:NVDA ) is undeterred by all this news presently down 3.43% trading with a weak RSI of 44.
The 78.6% Fibonacci retracement point is acting as support point for shares of NVidia a break below that pivot could lead to a dip to the 1-month axis. Similarly, a breakout above the 38.2% Fibonacci retracement point could catalyse a bullish renaissance for $NVDA.

Nvidia - That's Officially The Brutal End!Nvidia ( NASDAQ:NVDA ) is breaking all structure:
Click chart above to see the detailed analysis👆🏻
Following previous cycles, Nvidia has been rallying for more than 2 years, creating an overall pump of approximately +1.000%. But now, everything is literally pointing to a significant towards the downside and with a potential drop of -30%, bears are totally taking over Nvidia now.
Levels to watch: $70
Keep your long term vision,
Philip (BasicTrading)

Going Long on NVDA !NVIDIA (NVDA) has been a powerhouse stock, riding the wave of AI, gaming, and data center demand. Recently, the stock experienced a correction, which might have caused some investors to hesitate. However, from an Elliott Wave 2.0 perspective, this pullback was nothing more than a natural ABC correction following a classic 1-2-3-4-5 impulse wave—a textbook setup for long-term bulls.
Understanding the ABC Correction in NVDA
In Elliott Wave theory, after a strong five-wave rally, the market typically experiences a three-wave pullback (ABC correction) before continuing its long-term uptrend. This correction serves to shake out weak hands, reset overbought conditions, and set the stage for the next bullish impulse.
The A-wave is the initial drop as profit-taking kicks in.
The B-wave is the temporary bounce, often mistaken for a continuation.
The C-wave completes the correction, offering smart investors an ideal entry point.
NVDA’s recent pullback aligns perfectly with this structure, meaning the next leg up could be just around the corner.
Why NVDA Remains a Strong Long-Term Bet
AI Dominance – NVIDIA is at the center of the AI revolution, with its GPUs leading the industry.
Data Center Growth – Demand for high-performance computing continues to surge.
Technical Reset – The stock has worked off overbought conditions and is finding new support levels.
The Opportunity: A Strategic Long Entry
Now that the ABC correction has played out, NVDA presents an excellent long entry for those looking to ride the next bullish wave. With strong fundamentals and a technical reset, the stock is primed for another 1-2-3-4-5 impulse move, potentially leading to new all-time highs.
For traders who understand market structure, this is a golden opportunity to go long before the next explosive rally begins. 🚀

NVIDIA’s crushing it as the undisputed king of AI chipsNVIDIA’s crushing it as the undisputed king of AI chips, owning a jaw-dropping 70-95% market share. Their GPUs are the beating heart of data centers worldwide, powering the AI revolution with unstoppable momentum. Last four quarters? A cool $80B in revenue—growth that’s pure rocket fuel. Net margins at +56% scream profitability, while a forward P/E of 23.3 (cheaper than Starbucks!) makes it a steal for this kind of dominance. EPS projected to soar +29% annually over the next five years? That’s long-term winning vibes.
Their Blackwell Ultra chip, set to drop at GTC today, is about to flex even more muscle, and the Vera Rubin superchip’s got tech heads buzzing. Zero debt worries, industry-leading margins, and a massive addressable market—NVIDIA’s fundamentals are a fortress. Sure, trade war noise and a 10% YTD dip spook some, but this oversold gem (RSI 34) is primed to rally hard. Jensen Huang’s a visionary steering this beast, and with AI demand exploding, NVDA’s not just hot—it’s molten. Time to ride this wave, Freund!

I HAVE A NEW STRATEGY! Watch it work for me. SAYS BUY🚨 Exclusive Trading Opportunity – Limited Time Only! 🚨
I've developed an amazing new trading strategy that’s completely unique and never seen before! It’s called the Skyline Scalping Strategy, and it’s designed to pinpoint market direction with extreme accuracy—something that can easily be back-tested by reviewing my previous predictions.
For a limited time, I’ll be posting daily trade signals based on this strategy, allowing you to see exactly where I anticipate the market will move next. Whether you're an amateur trader or a seasoned professional, this is your chance to witness something game-changing in action.
⚠️ Disclaimer: I’m not providing financial advice—just sharing the direction I am planning to make money. The Skyline Scalping Strategy works exclusively on the daily chart, so stay tuned and watch as the predictions unfold!
FOLLOW NOW and don’t miss out on these powerful insights! 📊🔥
Vertical lines are colored and placed to indicate the expected direction of the price. Just my thoughts.

Nvidia moment of truthfull retest of the broken trendline, confirming it as resistance will lead to filling the gap around 70$

$NVDA down Nvidia's inaugural Quantum Day, scheduled for March 20 during its GTC 2025 conference, underscores the company's commitment to advancing quantum computing. This event brings together industry leaders to discuss current capabilities and future potential, highlighting Nvidia's recognition of quantum technology's growing significance.
Impact on Technology Stocks:
The announcement of Quantum Day has already influenced the stock market. Quantum computing companies like D-Wave Quantum, Rigetti Computing, and IonQ have experienced notable stock price increases, reflecting investor optimism about upcoming developments and collaborations that may be unveiled during the event.
Implications for Quantum Computing and AI:
By dedicating a day to quantum computing, Nvidia signals its intent to integrate quantum advancements with artificial intelligence (AI). This integration could lead to significant breakthroughs in processing capabilities, enabling more complex AI models and applications. The focus on quantum computing at GTC 2025 suggests that Nvidia aims to position itself at the forefront of this convergence, potentially accelerating the commercialization of quantum technologies in AI.
In summary, Nvidia's Quantum Day signifies a strategic move to embrace and promote quantum computing, with anticipated positive effects on technology stocks and the future landscape of AI and computational technologies.

Consider a Long Position: Nvidia Poised for AI-Driven Growth- Key Insights: Nvidia remains a robust choice for investors seeking exposure to
AI technology innovation. The stock recently advanced by over 5%, indicative
of strong positive momentum in the semiconductor sector. Nvidia's strategic
positioning in AI and computing technologies, along with the backing of
seasoned investors, bodes well for its future trajectory. The GTC conference
may serve as a pivotal catalyst for further appreciation in Nvidia’s market
value.
- Price Targets: For the upcoming week, consider the following levels for a long
position. Target 1 (T1) is set at $127, and Target 2 (T2) is at $135. Stop
Level 1 (S1) is $116, and Stop Level 2 (S2) is conservatively placed at
$112. These targets account for Nvidia's recent performance, market
momentum, and anticipated technical challenges.
- Recent Performance: Nvidia has demonstrated remarkable resilience, aiding in
the semiconductor sector's recovery with a noteworthy rise in its stock,
particularly over the past week. This performance underscores its pivotal
role in the AI chip market and its capacity to drive growth during broader
market rebounds.
- Expert Analysis: Analysts continue to express a bullish stance on Nvidia,
emphasizing its technological leadership and potential for long-term growth.
Despite recent market corrections, the general sentiment reflects confidence
in Nvidia's trajectory. Industry voices like Brad Gersner view current
valuations as an appealing entry point for heightened future returns, driven
by the company’s advancements in AI and ecosystem integration.
- News Impact: Nvidia's participation in upcoming key events like the GTC
conference has the potential to bolster market sentiment significantly.
Announcements on next-generation AI developments and products could catalyze
further stock appreciation. Additionally, Nvidia’s recognition in AI circles
and strategic innovations solidify its competitive edge amidst global
technological challenges and geopolitical factors. The entry of new
competitors like Deep Seek, however, adds an element of market complexity
that investors should watch closely.
