$GRASS - Long SetupBYBIT:GRASSUSDT | 12h
We shared a detailed long setup on this one last week, and it's now up 66%
If $1.80 holds as support or flips cleanly, $GRASS could push toward $2.50 or even extend to $3.30
I'll be watching for a re-long opportunity in the $1.90–$1.80 zone
Set stoploss just below $1.60
Targets:
$2.25 to $2.30
$2.50 to $2.60
$3.20 to $3.30
GRASSUSDT trade ideas

GRASS PERPETUAL TRADE, Sold From $2.20GRASS PERPETUAL TRADE
GRASS SELL SETUP
Currently $2.20
Sold From $2.20
(Trading plan If GRASS go up to $2.34
will add more shorts)
Expecting target $2.08 OR DOWN
Incase of early exist will update this anaylsis
Its not a Financial advice

GRASSUSDT.P - 1 H Double Top Pattren analysis With Cgi IndicatorGRASSUSDT.P - 1 H Double Top Pattren analysis With Cgi Indicator


Grass long to $1.7128Just recently opened a long position on grass. Target is $1.7128
Stop: $1.5684 or lower.
Roughly 3RR from my entry.
It might correct down a bit for better if you just seeing this.. or not.

$GRASS - Long Trade IdeaBYBIT:GRASSUSDT | 8h
Scaling into long, might add if it dips a bit to 1.42
Stop just below the low 1.34
TPs:
1.47-1.54
1.58-1.67
1.80-1.90

Grass scalp long to $1.6Went long on this grass token a while ago. Expecting a breakout to he upside soon.
Stop 1.5569 or lower.
See chart for more info

Grass shortJust shorted grass.
Downtrend
Likely to retest $1.4980 today
Will exit there. Might scale in later.
Roughly 2RR.
DTT applied. Anyone following these trades should be eating well.
DTT setups are everywhere.

#GRASSUSDT.P - expecting a quick scalp Not much to explain here — just expecting a quick scalp move on #GRASSUSDT.P

#GRASSUSDT.P - Reversal Signal from the Bottom: Target 1.72! Hey folks! Today I'm here with a trade on #GRASSUSDT.P. There’s not much to say, but to sum it up — a bottom formation has formed, and our LONG target is in the $1.69–$1.72 range.
Good luck and may your days be filled with green candles! 💚
Manage your risk, stay in the game! 🎯🔥
#AlyAnaliz #TradeSmart #CryptoVision #GRASSUSDT #Binanciega

GRASS/USDT –Trend Confirmation & Profit Target StrategyTrading Setup: GRASS/USDT Perpetual Contract
Entry Point: $1.61
Stop Loss: $1.5198
Take Profit Targets:
TP1: $1.7163
TP2: $1.7895
TP3: $1.8853
Strategy Overview
Trend Confirmation: Monitor price action for Break of Structure (BOS) or Change of Character (ChoCH) for entry validation.
Risk Management: Position size adjusted to maintain optimal risk-to-reward ratio..
This setup ensures a structured trade approach while managing risk efficiently. If you need refinements or additional indicators, let me know!

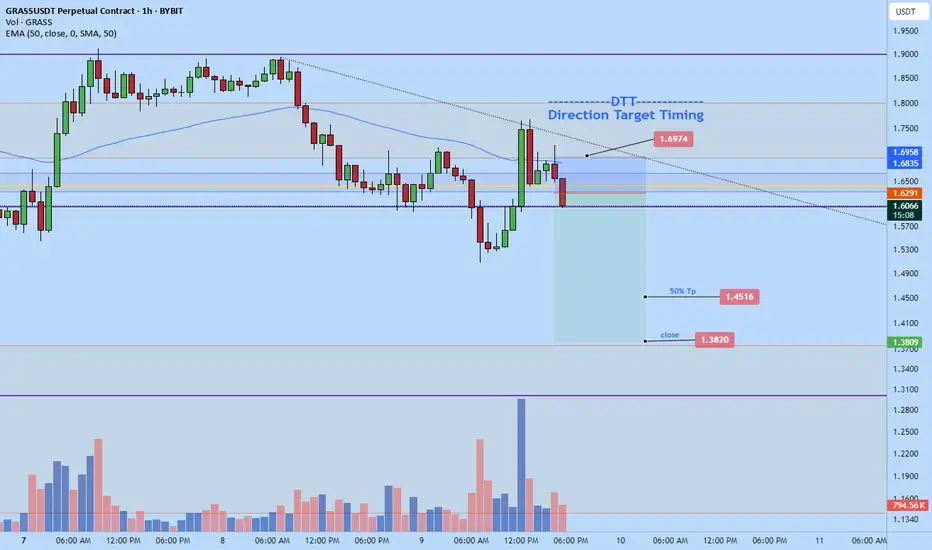
Grassusdt short down to $1.3820Just now opened a short position on grass usdt.
Aiming for $1.3820 area.
Time sensitive.
Setup in alignment with my DTT strategy
$GRASS SHORT GRASS$GRASS 4H - opened short from current levels (1.88) (NOW)
The asset keeps the descending structure. Earlier marked zone of interest was broken without impulse, but entry on it did not take place - that gives even more favorable entry point
Current conditions are favorable for a short-term short strategy
Targets: $1.4888, $1.4079, $1.3250, $1.2195, $1.1322
The main profit taking is at the first two levels.

Golden Cross Setup on GRASS/USDT (15m Chart)Waiting for a pullback to the demand zone around 1.72, aligned with the golden cross (50 EMA crossing above 200 EMA). Looking for a bullish bounce from the zone targeting the previous high near 1.96. Setup confirms momentum shift and potential continuation.

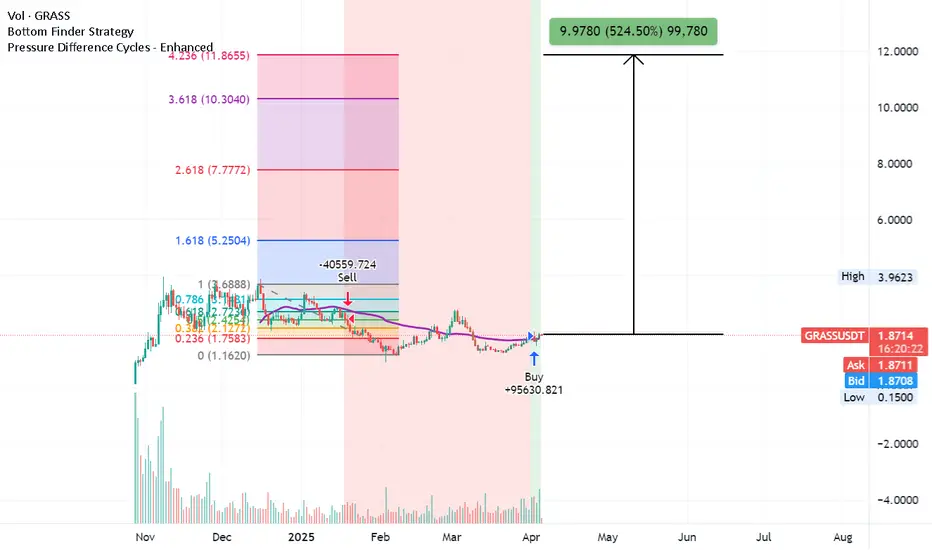
GRASSUSDT | Bottom Finder Strategy + Fib Extension TargetsThis chart illustrates a bullish technical outlook for BYBIT:GRASSUSDT using the Bottom Finder Strategy combined with Enhanced Pressure Difference Cycles and extended Fibonacci projections to forecast possible upside moves.
🔍 Key Observations:
Current Price: ~$1.87
Buy Signal Triggered: A confirmed buy emerged near $1.16 after a prolonged consolidation, backed by pressure reversal and volume support.
Sell Signal History: The previous major sell signal came in around $3.68 during a distribution top, capturing the local peak before the decline.
📐 Fibonacci Extension Levels:
1.618 → $5.25
2.618 → $7.77
3.618 → $10.30
4.236 → $11.86
🚀 Potential Rally Projection:
Price could surge to $9.9780, representing a 524.50% gain from the current level if momentum sustains.
📉 Volume Profile & Market Context:
Volume spiked around accumulation lows and has since stabilized — suggesting exhaustion of selling pressure. With the macro low printed and a fresh cycle beginning, risk/reward is asymmetrically in the bulls’ favor.
⚠️ Cautionary Note:
Although the setup is bullish, broader market volatility (including midterm political tension and possible regulatory shocks) could cause short-term pullbacks. As always, risk management is key.
🧠 Conclusion:
This is a high-reward setup worth watching closely — especially if we see confirmation of breakout volume above $2.50. Patience and positioning matter here.
Good luck to all! 📈🌱
Trading opportunity for GRASSUSDTBased on technical factors there is a Sell position in :
📊 GRASSUSDT
🔴 Sell Now
🪫Stop loss 1.9000
🔋Target 1.3200
📏 R/R 1,5
💸RISK : 1%
We hope it is profitable for you ❤️
Please support our activity with your likes👍 and comments📝

Bullish sentiment on GRASSUSDTUsing the Structure & Liquidity(QM) strategy.
Confluences are-
1) Structure-BoS
2) Liquidity
3) OB(POI)
To target 1:2.5RR minimum.
Note: the market is all about probabilities which also makes my analysis a probability.

GRASS/QUICK LONGS [5% FROM HERE]📉 GRASS/USDT 15m Chart Analysis 📈
Breakdown Confirmation as price drops below support with high momentum.
Key Demand Zone highlighted in blue, potential reversal area.
Moving Averages: Blue (short-term), Orange (long-term) providing confluence.
Projected Move: Expecting a bounce from the demand zone with possible bullish continuation
#Crypto #Trading #TechnicalAnalysis #MarketStructure

GRASS LONG SETUP ALL trading ideas have entry point + stop loss + take profit + Risk level.
hello Traders, here is the full analysis for this pair, let me know in the comment section below if you have any questions, the entry will be taken only if all rules of the strategies will be satisfied. I suggest you keep this pair on your watchlist and see if the rules of your strategy are satisfied. Please also refer to the Important Risk Notice linked below.
Disclaimer

Trading opportunity for Grass GRASSUSDTBased on technical factors there is a Buy position in :
📊 GRASSUSDT
🔵 Buy Now
🪫Stop loss 1.1900
🔋Target 1.6000
📏 R/R 1,8
💸RISK : 1%
We hope it is profitable for you ❤️
Please support our activity with your likes👍 and comments📝

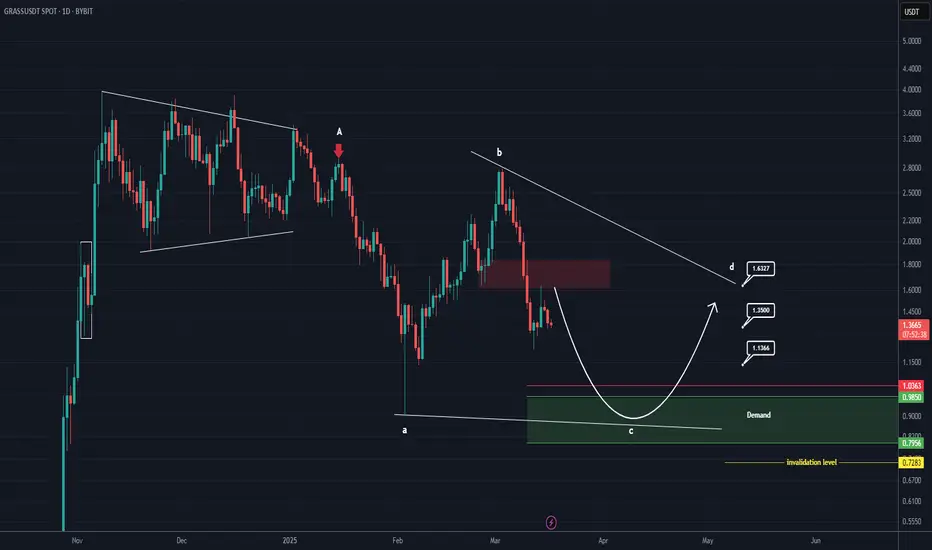
GRASS Analysis (1D)From the point where we placed a red arrow on the chart, it appears that GRASS has entered a corrective phase.
Waves A and B of this correction have completed. It now seems that we are in wave C of this corrective phase.
Wave C is expected to complete within the green zone, leading to the start of wave D.
Wave D is bullish.
The target is marked on the chart.
A daily candle closing below the invalidation level would invalidate this analysis.
For risk management, please don't forget stop loss and capital management
Comment if you have any questions
Thank You
Grass/USDT uptrend Idea....Hello, Traders!
Grass/USDT is showing early signs of an uptrend, encountering initial resistance at $1.500. The asset is currently gathering momentum, with the potential to continue higher. A confirmed breakout above the resistance could lead to a test of the 59-period moving average on the 4-hour timeframe.
I'm eyeing a potential long trade above $1.5250, with a target around $1.700. However, always manage your risk and use appropriate stop-loss orders.
Good luck and trade responsibly!

Grass short to $1.32Entered a short trade on grass . On both a 140to10k challenge account and funded.
Targeting $1.32
Roughly 8.5RR
I did enter earlier than am suppose to in anticipation of the market pushing down from here. I think my stop have good enough invalidation room though.
Everything else aligns with my DTT methodology
